

Rare Earth Elements—End Use and Recyclability - USGS
Rare Earth Elements—End Use and Recyclability - USGS
Rare Earth Elements—End Use and Recyclability - USGS

You also want an ePaper? Increase the reach of your titles
YUMPU automatically turns print PDFs into web optimized ePapers that Google loves.
12 <strong>Rare</strong> <strong>Earth</strong> <strong>Elements—End</strong> <strong>Use</strong> <strong>and</strong> <strong>Recyclability</strong><br />
Other (Unspecified)<br />
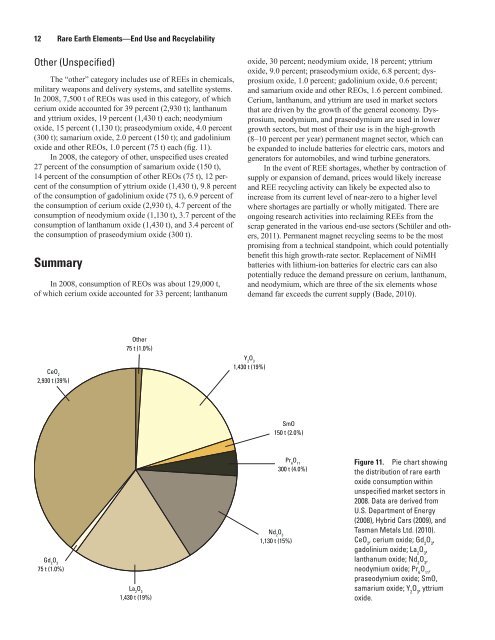
The “other” category includes use of REEs in chemicals,<br />
military weapons <strong>and</strong> delivery systems, <strong>and</strong> satellite systems.<br />
In 2008, 7,500 t of REOs was used in this category, of which<br />
cerium oxide accounted for 39 percent (2,930 t); lanthanum<br />
<strong>and</strong> yttrium oxides, 19 percent (1,430 t) each; neodymium<br />
oxide, 15 percent (1,130 t); praseodymium oxide, 4.0 percent<br />
(300 t); samarium oxide, 2.0 percent (150 t); <strong>and</strong> gadolinium<br />
oxide <strong>and</strong> other REOs, 1.0 percent (75 t) each (fig. 11).<br />
In 2008, the category of other, unspecified uses created<br />
27 percent of the consumption of samarium oxide (150 t),<br />
14 percent of the consumption of other REOs (75 t), 12 percent<br />
of the consumption of yttrium oxide (1,430 t), 9.8 percent<br />
of the consumption of gadolinium oxide (75 t), 6.9 percent of<br />
the consumption of cerium oxide (2,930 t), 4.7 percent of the<br />
consumption of neodymium oxide (1,130 t), 3.7 percent of the<br />
consumption of lanthanum oxide (1,430 t), <strong>and</strong> 3.4 percent of<br />
the consumption of praseodymium oxide (300 t).<br />
Summary<br />
In 2008, consumption of REOs was about 129,000 t,<br />
of which cerium oxide accounted for 33 percent; lanthanum<br />
CeO 2<br />
2,930 t (39%)<br />
Gd 2 O 3<br />
75 t (1.0%)<br />
Other<br />
75 t (1.0%)<br />
La 2 O 3<br />
1,430 t (19%)<br />
oxide, 30 percent; neodymium oxide, 18 percent; yttrium<br />
oxide, 9.0 percent; praseodymium oxide, 6.8 percent; dysprosium<br />
oxide, 1.0 percent; gadolinium oxide, 0.6 percent;<br />
<strong>and</strong> samarium oxide <strong>and</strong> other REOs, 1.6 percent combined.<br />
Cerium, lanthanum, <strong>and</strong> yttrium are used in market sectors<br />
that are driven by the growth of the general economy. Dysprosium,<br />
neodymium, <strong>and</strong> praseodymium are used in lower<br />
growth sectors, but most of their use is in the high-growth<br />
(8–10 percent per year) permanent magnet sector, which can<br />
be exp<strong>and</strong>ed to include batteries for electric cars, motors <strong>and</strong><br />
generators for automobiles, <strong>and</strong> wind turbine generators.<br />
In the event of REE shortages, whether by contraction of<br />
supply or expansion of dem<strong>and</strong>, prices would likely increase<br />
<strong>and</strong> REE recycling activity can likely be expected also to<br />
increase from its current level of near-zero to a higher level<br />
where shortages are partially or wholly mitigated. There are<br />
ongoing research activities into reclaiming REEs from the<br />
scrap generated in the various end-use sectors (Schüler <strong>and</strong> others,<br />
2011). Permanent magnet recycling seems to be the most<br />
promising from a technical st<strong>and</strong>point, which could potentially<br />
benefit this high growth-rate sector. Replacement of NiMH<br />
batteries with lithium-ion batteries for electric cars can also<br />
potentially reduce the dem<strong>and</strong> pressure on cerium, lanthanum,<br />
<strong>and</strong> neodymium, which are three of the six elements whose<br />
dem<strong>and</strong> far exceeds the current supply (Bade, 2010).<br />
Y 2 O 3<br />
1,430 t (19%)<br />
SmO<br />
150 t (2.0%)<br />
Pr 6 O 11<br />
300 t (4.0%)<br />
Nd 2 O 3<br />
1,130 t (15%)<br />
Figure 11. Pie chart showing<br />
the distribution of rare earth<br />
oxide consumption within<br />
unspecified market sectors in<br />
2008. Data are derived from<br />
U.S. Department of Energy<br />
(2008), Hybrid Cars (2009), <strong>and</strong><br />
Tasman Metals Ltd. (2010).<br />
CeO 2 , cerium oxide; Gd 2 O 3 ,<br />
gadolinium oxide; La 2 O 3 ,<br />
lanthanum oxide; Nd 2 O 3 ,<br />
neodymium oxide; Pr 6 O 11 ,<br />
praseodymium oxide; SmO,<br />
samarium oxide; Y 2 O 3 , yttrium<br />
oxide.


