

Rare Earth Elements—End Use and Recyclability - USGS
Rare Earth Elements—End Use and Recyclability - USGS
Rare Earth Elements—End Use and Recyclability - USGS

Create successful ePaper yourself
Turn your PDF publications into a flip-book with our unique Google optimized e-Paper software.
<strong>Rare</strong> <strong>Earth</strong> <strong>Elements—End</strong> <strong>Use</strong> <strong>and</strong> <strong>Recyclability</strong><br />
Scientific Investigations Report 2011–5094<br />
U.S. Department of the Interior<br />
U.S. Geological Survey
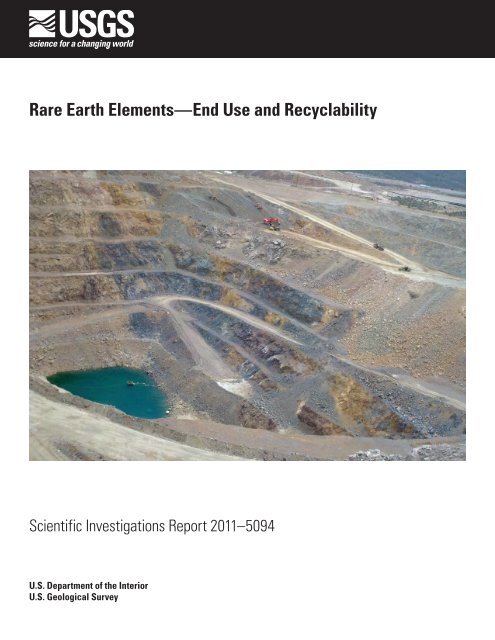
Front Cover. Photograph of the Molycorp, Inc’s Mountain Pass, Calif., mine. The Mountain Pass<br />
mine is one of the two largest rare earth mines in the world outside of China. Photograph by<br />
Dan Cordier, U.S. Geological Survey.
<strong>Rare</strong> <strong>Earth</strong> <strong>Elements—End</strong> <strong>Use</strong> <strong>and</strong><br />
<strong>Recyclability</strong><br />
By Thomas G. Goonan<br />
Scientific Investigations Report 2011–5094<br />
U.S. Department of the Interior<br />
U.S. Geological Survey
U.S. Department of the Interior<br />
KEN SALAZAR, Secretary<br />
U.S. Geological Survey<br />
Marcia K. McNutt, Director<br />
U.S. Geological Survey, Reston, Virginia: 2011<br />
For more information on the <strong>USGS</strong>—the Federal source for science about the <strong>Earth</strong>, its natural <strong>and</strong> living<br />
resources, natural hazards, <strong>and</strong> the environment, visit http://www.usgs.gov or call 1–888–ASK–<strong>USGS</strong>.<br />
For an overview of <strong>USGS</strong> information products, including maps, imagery, <strong>and</strong> publications,<br />
visit http://www.usgs.gov/pubprod<br />
To order this <strong>and</strong> other <strong>USGS</strong> information products, visit http://store.usgs.gov<br />
Any use of trade, product, or firm names is for descriptive purposes only <strong>and</strong> does not imply endorsement by the<br />
U.S. Government.<br />
Although this report is in the public domain, permission must be secured from the individual copyright owners to<br />
reproduce any copyrighted materials contained within this report.<br />
Suggested citation:<br />
Goonan, T.G., 2011, <strong>Rare</strong> earth elements—End use <strong>and</strong> recyclability: U.S. Geological Survey Scientific Investigations<br />
Report 2011–5094, 15 p. available only at http://pubs.usgs.gov/sir/2011/5094/.
Contents<br />
Abstract ...........................................................................................................................................................1<br />
Introduction.....................................................................................................................................................1<br />
End <strong>Use</strong>s For <strong>Rare</strong> <strong>Earth</strong> Elements .............................................................................................................1<br />
Mature Market Sectors .......................................................................................................................2<br />
Catalysts ........................................................................................................................................2<br />
Glass...............................................................................................................................................6<br />
Metallurgy (Excluding Battery Alloy) ........................................................................................7<br />
Phosphors .....................................................................................................................................8<br />
Developing Market Sectors ................................................................................................................8<br />
Ceramics........................................................................................................................................8<br />
Neodymium-Iron-Boron Magnets .............................................................................................9<br />
Battery Alloys .............................................................................................................................10<br />
Other (Unspecified) ...................................................................................................................12<br />
Summary........................................................................................................................................................12<br />
References Cited..........................................................................................................................................13<br />
Figures<br />
1. Chart showing world mine production of rare earth oxides from 1990<br />
through 2008 ..................................................................................................................................2<br />
2. Diagram showing the distribution of rare earth oxide consumption by market<br />
sector in 2008 .................................................................................................................................5<br />
3. Pie chart showing the distribution of rare earth oxide consumption within the<br />
catalysts market sector in 2008 ..................................................................................................6<br />
4. Pie chart showing the distribution of rare earth oxide consumption within the<br />
glass industry market sector in 2008 .........................................................................................7<br />
5. Pie chart showing the distribution of rare earth oxide consumption within the<br />
metallurgy industry market sector, excluding battery alloys, in 2008 ..................................7<br />
6. Pie chart showing the distribution of rare earth oxide consumption within the<br />
phosphor market sector in 2008 .................................................................................................8<br />
7. Pie chart showing the distribution of rare earth oxide consumption within the<br />
ceramics market sector in 2008 .................................................................................................9<br />
8. Pie chart showing the distribution of rare earth oxide consumption within the<br />
neodymium-iron-boron permanent magnet market sector in 2008 ......................................9<br />
9. Pie chart showing the distribution of rare earth oxide consumption within the<br />
battery alloy market sector in 2008 ..........................................................................................10<br />
10. Chart showing dem<strong>and</strong> for rare earth oxides associated with U.S. hybrid<br />
automobile sales from 2000 through 2009 ...............................................................................11<br />
11. Pie chart showing the distribution of rare earth oxide consumption within<br />
unspecified market sectors in 2008 .........................................................................................12<br />
iii
iv<br />
Tables<br />
1. Estimated worldwide end uses for rare earth elements in 2008, by amount of<br />
rare earth oxide in end use. ........................................................................................................3<br />
2. Distribution of rare earth oxide consumption by market sector in 2008. .............................5<br />
Conversion Factors<br />
Multiply By To obtain<br />
Mass<br />
kilogram (kg) 2.205 pound avoirdupois (lb)<br />
kilogram (kg) 32.1507 ounce, troy<br />
megagram (Mg); metric ton (t) 1.102 ton, short (2,000 lb)<br />
Temperature in degrees Celsius (°C) may be converted to degrees Fahrenheit (°F) as follows:<br />
°F=(1.8×°C)+32<br />
Temperature in degrees Fahrenheit (°F) may be converted to degrees Celsius (°C) as follows:<br />
°C=(°F-32)/1.8
<strong>Rare</strong> <strong>Earth</strong> <strong>Elements—End</strong> <strong>Use</strong> <strong>and</strong> <strong>Recyclability</strong><br />
By Thomas G. Goonan<br />
Abstract<br />
<strong>Rare</strong> earth elements are used in mature markets (such<br />
as catalysts, glassmaking, lighting, <strong>and</strong> metallurgy), which<br />
account for 59 percent of the total worldwide consumption of<br />
rare earth elements, <strong>and</strong> in newer, high-growth markets (such<br />
as battery alloys, ceramics, <strong>and</strong> permanent magnets), which<br />
account for 41 percent of the total worldwide consumption of<br />
rare earth elements. In mature market segments, lanthanum<br />
<strong>and</strong> cerium constitute about 80 percent of rare earth elements<br />
used, <strong>and</strong> in new market segments, dysprosium, neodymium,<br />
<strong>and</strong> praseodymium account for about 85 percent of rare earth<br />
elements used. Regardless of the end use, rare earth elements<br />
are not recycled in large quantities, but could be if recycling<br />
became m<strong>and</strong>ated or very high prices of rare earth elements<br />
made recycling feasible.<br />
Introduction<br />
<strong>Rare</strong> earth elements (REEs) are not particularly rare in<br />
terms of abundance, but for many years remained rarely separated<br />
from each other owing to their similar chemical characteristics<br />
(Hurst, 2010). Although REEs (which are also known<br />
as the lanthanide series in the periodic table of elements) are<br />
widely distributed geographically, they are chiefly mined, concentrated,<br />
<strong>and</strong> separated in China. Semifabrication also takes<br />
place in China, so China is important to world production on<br />
several levels. The manufacture of assemblies that contain<br />
REEs is more broadly distributed.<br />
World mine production of rare earth oxides (REOs) grew<br />
rapidly (about 7 percent per year) from 1990 through 2006<br />
before decreasing in 2007 owing to worldwide economic<br />
conditions, with growth increasing but at a slower pace after<br />
2007 (fig. 1). The growth in REO production directly correlates<br />
to the growth in REO consumption, which, in turn, has<br />
been tied to the general economic growth for the historic uses<br />
of REOs (catalysts for fluid cracking <strong>and</strong> catalytic converters<br />
for automobiles, glass <strong>and</strong> metallurgical industries, <strong>and</strong> phosphors)<br />
<strong>and</strong> the increase of high-technology uses tied mainly to<br />
alternative energy systems (such as batteries for hybrid cars)<br />
<strong>and</strong> permanent magnet applications for electric motors, stereo<br />
speakers, <strong>and</strong> wind turbine generators.<br />
The U.S. Geological Survey is not a “principal statistical<br />
agency” <strong>and</strong> does not have a m<strong>and</strong>ate to routinely collect<br />
end-use data from primary sources. End-use data are collected<br />
<strong>and</strong> (or) developed from <strong>and</strong> attributed to private communications<br />
with experts, published <strong>and</strong> Web site materials, <strong>and</strong> other<br />
third party sources. In this report, the tables <strong>and</strong> figures for<br />
REO end use by selected sectors are based on data in Bade<br />
(2010). REE statistics are usually reported as REO equivalents.<br />
The REE-to-REO ratio for each of the REEs is about<br />
1:0.85. This makes the relative fractions of REOs in the enduse<br />
table closely approximate the relative REE end use (table<br />
1). Regardless of the shortcomings of single-source data, the<br />
data in this report present a reasonable first approximation of<br />
the distribution of worldwide REO consumption by end use.<br />
Quantity data as detailed in this report are rounded to no more<br />
than three significant digits, <strong>and</strong> percentages are rounded to no<br />
more than two significant digits.<br />
End <strong>Use</strong>s For <strong>Rare</strong> <strong>Earth</strong> Elements<br />
In 2008, 129,000 metric tons (t) of REOs was consumed<br />
worldwide (Cordier <strong>and</strong> Hedrick, 2010). Mature applications<br />
(catalysts <strong>and</strong> the glass, lighting, <strong>and</strong> metallurgical industries,<br />
sectors that grow at the rate of growth for the general economy)<br />
consumed about 60 percent of the total, <strong>and</strong> the remaining<br />
40 percent was consumed in developing, high-growth<br />
technologies (battery alloys, ceramics, magnets, <strong>and</strong> other<br />
sectors that grow at 4 to 10 percent per year) (Bade, 2010).<br />
The distribution of REO consumption by type is not<br />
homogeneous among market sectors (table 1). However,<br />
REO consumption is split rather evenly among the following<br />
applications: glass industry (polishing, 68 percent; additives,<br />
42 percent), 28,400 t; catalysts (fluid cracking, 72 percent;<br />
catalytic converters, 28 percent), 27,400 t; neodymium-ironboron<br />
magnets, 26,300 t; metallurgy <strong>and</strong> alloys, 23,600 t;<br />
<strong>and</strong> other uses, 23,500 t (fig. 2; table 2). Figure 2 shows the<br />
distribution of REOs from end uses to the consumer product<br />
reservoir to various modes of disposition. Estimates are based<br />
on assumptions about previous production <strong>and</strong> consumer product<br />
life. There are no estimates for manufacturer-generated<br />
scrap. The estimates in figure 2 should not be taken as definitive<br />
because they are based on incomplete <strong>and</strong> anecdotal
2 <strong>Rare</strong> <strong>Earth</strong> <strong>Elements—End</strong> <strong>Use</strong> <strong>and</strong> <strong>Recyclability</strong><br />
World mine production, in thous<strong>and</strong> metric tons<br />
150<br />
140<br />
130<br />
120<br />
110<br />
100<br />
90<br />
80<br />
70<br />
60<br />
50<br />
40<br />
30<br />
20<br />
10<br />
0<br />
Trend line<br />
1990 1992 1994 1996 1998 2000 2002 2004 2006 2008<br />
Year<br />
Figure 1. Chart showing world mine production of rare earth oxides from 1990 through 2008. Data are from Hedrick (1996–2009) <strong>and</strong><br />
Cordier <strong>and</strong> Hedrick (2010).<br />
information. What is important about disposition is that there<br />
is currently very little recycling of REOs. This suggests that<br />
the value of REOs that could potentially be recovered from<br />
recycling is insufficient to cover the cost to do so based on<br />
current technology, <strong>and</strong> possible future shortages that could<br />
cause sustained higher prices for these materials can likely be<br />
mitigated by this recycling potential. Indeed, Hitachi Ltd. of<br />
Japan is exploring recycling of REEs in response to Chinese<br />
REO export limitations (Clenfield <strong>and</strong> others, 2010). Kosaka<br />
Smelting <strong>and</strong> Refining (a subsidiary of Dowa Holdings) is<br />
in the process of developing the means to reclaim rare earths<br />
from electronic scrap (Tabuchi, 2010; Fast Company, 2011).<br />
Mature Market Sectors<br />
The mature REO end-use markets (catalysts, glass<br />
industry, metallurgy excluding battery alloy, <strong>and</strong> phosphors)<br />
consume mainly cerium (45 percent), lanthanum (39 percent),<br />
<strong>and</strong> yttrium (8.0 percent) oxides. Dysprosium, gadolinium,<br />
neodymium, <strong>and</strong> praseodymium oxides <strong>and</strong> other REOs contribute<br />
the remaining 7.0 percent of total REOs consumed in<br />
these sectors.<br />
Catalysts<br />
Fluid cracking is one process in petroleum refining that<br />
converts a heavy hydrocarbon input into lighter hydrocarbon<br />
fractions. Fluid cracking depends on the control of temperature<br />
<strong>and</strong> pressure conditions <strong>and</strong> the presence of a suitable<br />
catalyst, which provides active physical reaction sites on<br />
which the desired reactions can take place. The catalyst is<br />
based on zeolite, a molecular sieve that has a great amount of<br />
reactive area within its own mineral structure. The zeolite is<br />
dealuminized, which increases the silicon-to-aluminum ratio<br />
but weakens the structure of the mineral. The former aluminum<br />
sites in the zeolite are repopulated with REOs through an<br />
ion exchange process. REO concentration in catalysts varies<br />
between 1.5 <strong>and</strong> 5.0 percent by weight <strong>and</strong> averages about
Table 1. Estimated worldwide end uses for rare earth elements in 2008, by amount of rare earth oxide in end use.<br />
[Values are in metric tons of rare earth oxides <strong>and</strong> are rounded to three significant digits. Percentages are rounded to the nearest decimal. Values may not add to totals shown owing to independent rounding.<br />
CeO , cerium oxide; Dy O , dysprosium oxide; Eu O , europium oxide; Gd O , gadolinium oxide; La O , lanthanum oxide; Nd O , neodymium oxide; Pr O , praseodymium oxide; SmO, samarium oxide;<br />
2 2 3 2 3 2 3 2 3 2 3 6 11<br />
Tb O , terbium oxide; Y O , yttrium oxide; REO, rare earth oxide; —, no consumption]<br />
6 7 2 3<br />
End uses CeO La O Nd O Y O Pr O Dy O Gd O SmO Tb O Eu O Other<br />
2 2 3 2 3 2 3 6 11 2 3 2 3 6 7 2 3<br />
Quantity used, in metric tons<br />
Automobile catalytic converters 6,840 380 228 — 152 — — — — — —<br />
Ceramics 840 1,190 840 3,710 420 — — — — — —<br />
Fluid catalytic cracking 1,980 17,800 — — — — — — — — —<br />
Glass additives 7,920 2,880 360 240 120 — — — — — 480<br />
Metallurgy, except batteries 5,980 2,990 1,900 — 633 — — — — — —<br />
Neodymium magnets — — 18,200 — 6,140 1,310 525 — 53 — —<br />
Battery alloys 4,040 6,050 1,210 — 399 — — 399 — — —<br />
Phosphors 990 765 — 6,230 — — 162 — 414 441 —<br />
Glass polishing 10,700 5,170 — — 574 — — — — — —<br />
Other 2,930 1,430 1,130 1,430 300 — 75 150 — — 75<br />
Total 42,200 38,700 23,900 11,600 8,740 1,310 762 549 467 441 555<br />
Percentage of total REOs used<br />
Automobile catalytic converters 90.0 5.0 3.0 — 2.0 — — — — — —<br />
Ceramics 12.0 17.0 12.0 53.0 6.0 — — — — — —<br />
Fluid catalytic cracking 10.0 90.0 — — — — — — — — —<br />
Glass additives 66.0 24.0 3.0 2.0 1.0 — — — — — 4.0<br />
Metallurgy, except batteries 52.0 26.0 16.5 — 5.5 — — — — — —<br />
Neodymium magnets — — 69.4 — 23.4 5.0 2.0 — 0.2 — —<br />
End <strong>Use</strong>s For <strong>Rare</strong> <strong>Earth</strong> Elements 3<br />
Battery alloys 33.4 50.0 10.0 — 3.3 — — 3.3 — — —<br />
Phosphors 11.0 8.5 — 69.2 — — 1.8 — 4.6 4.9 —<br />
Glass polishing 65.1 31.4 — — 3.5 — — — — — —<br />
Other 39.0 19.0 15.0 19.0 4.0 — 1.0 2.0 — — 1.0<br />
Total 32.7 29.9 18.5 9.0 6.8 1.0 0.6 0.4 0.4 0.3 0.4
4 <strong>Rare</strong> <strong>Earth</strong> <strong>Elements—End</strong> <strong>Use</strong> <strong>and</strong> <strong>Recyclability</strong><br />
2,930<br />
4,040<br />
840<br />
990<br />
5,980<br />
18,600<br />
8,820<br />
CeO2 42,200 t<br />
1,310<br />
Dy O 2 3<br />
1,310 t<br />
441<br />
Eu O 2 3<br />
441 t<br />
75<br />
525<br />
162<br />
Gd O 2 3<br />
762 t<br />
1,430<br />
6,050<br />
1,190<br />
765<br />
2,990<br />
8,050<br />
18,200<br />
La O 2 3<br />
38,700 t<br />
1,130<br />
1,210<br />
18,200<br />
840<br />
1,900<br />
360<br />
228<br />
Nd O 2 3<br />
23,900 t<br />
300<br />
399<br />
6,140<br />
420<br />
633<br />
694<br />
152<br />
Pr O 6 7<br />
8,740 t<br />
150<br />
399<br />
SmO<br />
549 t<br />
53<br />
414<br />
Tb O 6 7<br />
467 t<br />
1,430<br />
3,710<br />
6,230<br />
240<br />
Y O 2 3<br />
11,600 t<br />
76<br />
480<br />
Other<br />
555 t<br />
Other<br />
7,500 t<br />
Battery alloy<br />
12,100 t<br />
NdFeB magnets<br />
26,300 t<br />
Ceramics<br />
7,000 t<br />
Phosphor<br />
9,000 t<br />
Metallurgy1 11,500 t<br />
Glass industry<br />
28,400 t<br />
Catalysts<br />
27,400 t<br />
Total consumption<br />
129,000 t<br />
Net change to consumer product reservoir<br />
38,800<br />
Other<br />
6,800 t<br />
Battery alloy<br />
4,000 t<br />
NdFeB magnets<br />
6,290 t<br />
Ceramics<br />
5,800 t<br />
Phosphor<br />
8,150 t<br />
Metallurgy1 7,700 t<br />
Glass industry<br />
27,000 t<br />
Catalysts<br />
24,700 t<br />
Total consumer scrap<br />
90,400 t<br />
Disposition<br />
Recycled<br />
0 t<br />
Stockpiled<br />
2,320 t<br />
Downgraded use<br />
8,310 t<br />
Construction aggregate<br />
21,000 t<br />
L<strong>and</strong>fill<br />
58,700 t<br />
Total disposition<br />
90,400 t
Table 2. Distribution of rare earth oxide consumption by market sector in 2008.<br />
[Data are derived from Bade (2010). Values may not add to totals shown owing to independent rounding. —, no consumption]<br />
End <strong>Use</strong>s For <strong>Rare</strong> <strong>Earth</strong> Elements 5<br />
<strong>Rare</strong> earth oxide Catalysts Ceramics<br />
Glass<br />
industry<br />
Metallurgy,<br />
except<br />
batteries<br />
Neodymium<br />
magnets<br />
Battery<br />
alloys<br />
Phosphors Other Total<br />
Cerium oxide<br />
8,820 840 18,620 5,980 — 4,040 990 2,930 42,200<br />
Dysprosium oxide — — — — 1,310 — — — 1,310<br />
Europium oxide<br />
— — — — — — 441 — 441<br />
Gadolinium oxide — — — — 525 — 162 75 762<br />
Lanthanum oxide 18,180 1,190 8,050 2,990 — 6,050 765 1,430 38,700<br />
Neodymium oxide 228 840 360 1,900 18,200 1,210 — 1,130 23,900<br />
Praseodymium oxide 152 420 694 633 6,140 399 — 300 8,740<br />
Samarium oxide<br />
— — — — — 399 — 150 549<br />
Terbium oxide<br />
— — — — 53 — 414 — 467<br />
Yttrium oxide<br />
— 3,710 240 — — — 6,230 1,430 11,600<br />
Other oxides<br />
— — 480 — — — — 75 555<br />
Total<br />
27,400 7,000 28,400 11,500 26,300 12,100 9,000 7,500 129,000<br />
Figure 2 (facing page). Diagram showing the distribution of<br />
rare earth oxide consumption by market sector in 2008. Data are<br />
derived from Bade (2010). Values may not add to totals shown<br />
owing to independent rounding. CeO 2 , cerium oxide; Dy 2 O 3 ,<br />
dysprosium oxide; Eu 2 O 3 , europium oxide; Gd 2 O 3 , gadolinium<br />
oxide; La 2 O 3 , lanthanum oxide; Nd 2 O 3 , neodymium oxide; Pr 6 O 7 ,<br />
praseodymium oxide; SmO, samarium oxide; Tb 6 O 7 , terbium oxide;<br />
Y 2 O 3 , yttrium oxide. The metallurgy end use does not include<br />
batteries, which are shown as a separate end use.
6 <strong>Rare</strong> <strong>Earth</strong> <strong>Elements—End</strong> <strong>Use</strong> <strong>and</strong> <strong>Recyclability</strong><br />
3.5 percent (Du <strong>and</strong> others, 2009). As fluid cracking proceeds,<br />
catalyst contaminated with carbon is continually created <strong>and</strong><br />
separated from the stream of light hydrocarbon products. The<br />
contaminated catalyst is regenerated <strong>and</strong> blended with a new<br />
catalyst at a 1:1 ratio <strong>and</strong> returned to the cracking area (Bulatov<br />
<strong>and</strong> Jirnov, 2009).<br />
In 2008, 27,400 t of REOs was used as catalysts for fluid<br />
cracking (72 percent) <strong>and</strong> automobile catalytic converters<br />
(28 percent), of which lanthamum oxide contributed 66 percent;<br />
cerium oxide, 32 percent; neodymium oxide, 0.8 percent;<br />
<strong>and</strong> praseodymium oxide, 0.6 percent (fig. 3).<br />
In 2008, catalysts accounted for 47 percent of the consumption<br />
of lanthanum oxide (18,200 t, of which 98 percent<br />
went to fluid cracking <strong>and</strong> 2.0 percent went to automobile<br />
catalysts), 21 percent of the consumption of cerium oxide<br />
(8,820 t, of which 78 percent went to automobile catalysts <strong>and</strong><br />
22 percent went to fluid cracking), 1.7 percent of the consumption<br />
of praseodymium oxide (152 t, 100 percent of which went<br />
to automobile catalysts), <strong>and</strong> 1.0 percent of the consumption<br />
of neodymium oxide (228 t, 100 percent of which went to<br />
automobile catalysts).<br />
La 2 O 3<br />
18,200 t (66%)<br />
Pr O 6 11<br />
152 t (0.6%)<br />
Nd O 2 3<br />
228 t (0.8%)<br />
CeO 2<br />
8,820 t (32%)<br />
Figure 3. Pie chart showing the distribution of rare earth oxide<br />
consumption within the catalysts market sector in 2008. Data are<br />
derived from Bade (2010). CeO 2 , cerium oxide; La 2 O 3 , lanthanum<br />
oxide; Nd 2 O 3 , neodymium oxide; Pr 6 O 11 , praseodymium oxide.<br />
Spent catalysts are generally considered to be hazardous<br />
wastes <strong>and</strong> as such incur higher disposal costs. Nevertheless,<br />
REOs are not recovered, but rather, depending on<br />
circumstances, are disposed in lined l<strong>and</strong>fills, combined with<br />
other materials to make construction aggregates, or processed<br />
through cement kilns where they substitute for material <strong>and</strong><br />
fuel inputs that would otherwise have to be extracted from the<br />
<strong>Earth</strong>.<br />
With regard to automobile catalytic converters, REOs<br />
are not the major catalyst, but rather function as a protective<br />
coating for the major catalytic elements (palladium <strong>and</strong><br />
platinum), which are generally more valuable <strong>and</strong> are used in<br />
much larger quantities for this end use. Very small amounts,<br />
if any, of the REOs used in catalysts are recycled within the<br />
processes that recover the major elements. The REOs separate<br />
to slag in these processes <strong>and</strong> are most likely a dissipative loss<br />
to construction aggregate or to l<strong>and</strong>fills.<br />
Growth in the dem<strong>and</strong> for REOs that is generated by<br />
a catalyst’s category of usage will likely be tied directly to<br />
worldwide growth in automobile production <strong>and</strong> fluid cracking.<br />
Growth is expected to depend upon general economic<br />
conditions <strong>and</strong> can vary by region.<br />
Glass<br />
REOs are added to glass to perform such functions<br />
as absorbing ultraviolet light, altering the refractive index,<br />
<strong>and</strong> colorizing or decolorizing (AZoNano.com, 2009; Herbert,<br />
2010; <strong>Rare</strong>-<strong>Earth</strong>-Technology, 2010). Yttrium is used<br />
with garnet to form yttrium-aluminum-garnet (YAG) lasers.<br />
Neodymium <strong>and</strong> other REEs are used as dopants to alter the<br />
properties of the YAG lasers (Anscombe, 2002; VLOC, 2002).<br />
Polishing powder is sprayed on spinning glass where<br />
chemical dissolving <strong>and</strong> mechanical abrading agents work<br />
together to provide superior polished glass surfaces. <strong>Rare</strong> earth<br />
glass polishing powders at end-of-life contain 66 to 95 percent<br />
REOs in the following percentages: cerium oxide, 50 to 99<br />
percent; lanthanum oxide, 0 to 35 percent; neodymium oxide,<br />
0 to 15 percent; <strong>and</strong> praseodymium oxide, 0 to 5 percent. In<br />
2008, 28,400 t of REOs was used in the glass industry, of<br />
which cerium oxide accounted for 65 percent; lanthanum<br />
oxide, 28 percent; praseodymium oxide, 2.4 percent; other<br />
oxides, 1.7 percent; neodymium oxide, 1.3 percent; <strong>and</strong><br />
yttrium oxide, 0.9 percent (fig. 4).<br />
In 2008, the glass industry accounted for 86 percent of<br />
the consumption of other REOs (480 t, of which 100 percent<br />
went to glass additives), 44 percent of the consumption of<br />
cerium oxide (18,600 t, of which 57 percent went to glass<br />
polishing <strong>and</strong> 43 percent went to glass additives), 21 percent<br />
of the consumption of lanthanum oxide (8,050 t, of which<br />
64 percent went to glass polishing <strong>and</strong> 36 percent went to<br />
glass additives), 8 percent of the consumption of praseodymium<br />
oxide (694 t, of which 83 percent went to glass polishing<br />
<strong>and</strong> 17 percent went to glass additives), <strong>and</strong> 2 percent<br />
of the consumption of neodymium oxide (360 t, of which
La 2 O 3<br />
8,050 t (28%)<br />
Pr 6 O 11<br />
694 t (2.4%)<br />
Nd 2 O 3<br />
360 t (1.3%)<br />
Y 2 O 3<br />
240 t (0.9%)<br />
Other<br />
480 t (1.7%)<br />
CeO 2<br />
18,600 t (65%)<br />
Figure 4. Pie chart showing the distribution of rare earth oxide<br />
consumption within the glass industry market sector in 2008.<br />
Data are derived from Bade (2010). CeO 2 , cerium oxide; La 2 O 3 ,<br />
lanthanum oxide; Nd 2 O 3 , neodymium oxide; Pr 6 O 11 , praseodymium<br />
oxide; Y 2 O 3 , yttrium oxide.<br />
100 percent went to glass additives) <strong>and</strong> yttrium oxide (240 t,<br />
of which 100 percent went to glass additives).<br />
Clear glass, which is unlikely to contain REEs, is recycled<br />
easily into containers, <strong>and</strong> clear glass cullet (crushed glass<br />
scrap) is highly prized in new clear glass production. Colored<br />
glass, some of which can contain REEs, is h<strong>and</strong> or machine<br />
sorted before becoming cullet. It can be recycled into colored<br />
glass under high quality control conditions, but is more<br />
likely to be used to manufacture color tile <strong>and</strong> glass fibers, as<br />
construction aggregate, or to be disposed of in a l<strong>and</strong>fill (Container<br />
Recycling Institute, 2008; <strong>Earth</strong>911.com, 2010a,b).<br />
Neodymium is used for the production of YAG lasers.<br />
No REE-bearing scrap material is recycled for use in this<br />
crystal-growing process. During production, 80 percent of the<br />
neodymium input is lost to a scrap material that contains as<br />
much as 5 percent neodymium oxide. This material, for lack<br />
of buyers, is sent to l<strong>and</strong>fills (Michael Brennan, manager, YAG<br />
Crystal Growth, VLOC, written commun., January 25, 2001).<br />
Polishing powders can be regenerated with costly chemical<br />
processing (Xu <strong>and</strong> Peng, 2009).<br />
End <strong>Use</strong>s For <strong>Rare</strong> <strong>Earth</strong> Elements 7<br />
Metallurgy (Excluding Battery Alloy)<br />
REEs are added to aluminum, iron, steel, <strong>and</strong> other<br />
host metals in small quantities to improve selected physical<br />
properties of the resulting alloys. The rare earths are added as<br />
ferroalloys, master alloys, mischmetal (a mix of mostly cerium<br />
<strong>and</strong> lanthanum oxides), or metals.<br />
In 2008, 11,500 t of REOs was used in this category,<br />
of which cerium oxide accounted for 52 percent; lanthanum<br />
oxide, 26 percent; neodymium oxide, 17 percent; <strong>and</strong> praseodymium<br />
oxide, 5.5 percent (fig. 5).<br />
In 2008, the metallurgy sector (excluding battery alloy)<br />
accounted for 14 percent of the consumption of cerium<br />
oxide (5,980 t), 8.0 percent for neodymium oxide (1,990 t),<br />
7.7 percent of the consumption of lanthanum oxide (2,990 t),<br />
<strong>and</strong> 7.2 percent of the consumption of praseodymium oxide<br />
(633 t).<br />
The use of REEs in metallurgical alloys is generally dissipative<br />
because the rare earths congregate in low concentrations<br />
in the slag generated by melting scrap types that contain<br />
the rare earths. Slag is used as construction aggregate <strong>and</strong> (or)<br />
is disposed in l<strong>and</strong>fills.<br />
Nd 2 O 3<br />
1,900 t (16%)<br />
La 2 O 3<br />
2,990 t (26%)<br />
Pr 6 O 11<br />
633 t (5.5%)<br />
CeO 2<br />
5,980 t (52%)<br />
Figure 5. Pie chart showing the distribution of rare earth oxide<br />
consumption within the metallurgy industry market sector,<br />
excluding battery alloys, in 2008. Data are derived from Bade<br />
(2010). CeO 2 , cerium oxide; La 2 O 3 , lanthanum oxide; Nd 2 O 3 ,<br />
neodymium oxide; Pr 6 O 11 , praseodymium oxide.
8 <strong>Rare</strong> <strong>Earth</strong> <strong>Elements—End</strong> <strong>Use</strong> <strong>and</strong> <strong>Recyclability</strong><br />
Phosphors<br />
Phosphors are used in cathode ray tube displays, fluorescent<br />
lamps, <strong>and</strong> other applications that require color in the<br />
light exhibited. Not all phosphors contain REEs, but many do.<br />
Phosphors convert incident radiation into light of designed<br />
color based on the properties of the elements included in the<br />
phosphor (Heyes, 1998).<br />
In 2008, 9,000 t of REOs was used in this category, of<br />
which yttrium oxide contributed 69 percent; cerium oxide,<br />
11 percent; lanthanum oxide, 8.5 percent; europium oxide,<br />
4.9 percent; terbium oxide, 4.6 percent; <strong>and</strong> gadolinium oxide,<br />
1.8 percent (fig. 6).<br />
In 2008, phosphors accounted for 100 percent of the<br />
consumption of europium oxide (441 t), 89 percent of the consumption<br />
of terbium oxide (414 t), 54 percent of the consumption<br />
of yttrium oxide (6,230 t), 21 percent of the consumption<br />
of gadolinium oxide (162 t), 2.4 percent of the consumption<br />
of cerium oxide (990 t), <strong>and</strong> 2.0 percent of the consumption of<br />
lanthanum oxide (765 t).<br />
Rhodia Group has estimated that, by 2015, recycled<br />
lamps will contain more than 250 t of REOs. Currently (2011),<br />
REOs as a constituent of the phosphor powder that can be<br />
recovered from recycled lamps is disposed in l<strong>and</strong>fills. However,<br />
research efforts by Rhodia <strong>and</strong> others to economically<br />
recover this material continue (U.S. Department of Energy,<br />
2009, p. 34141).<br />
Y 2 O 3<br />
6,230 t (69%)<br />
CeO 2<br />
990 t (11%)<br />
Eu 2 O 3<br />
441 t (4.9%)<br />
Developing Market Sectors<br />
In developing high-technology market sectors, neodymium<br />
oxide accounted for 41 percent of REOs used in these sectors;<br />
lanthanum oxide, 16 percent; cerium oxide, 15 percent;<br />
praseodymium oxide, 14 percent; yttrium oxide, 10 percent;<br />
dysprosium oxide, 2.5 percent; <strong>and</strong> gadolinium <strong>and</strong> samarium<br />
oxides, 1.0 percent each.<br />
Ceramics<br />
REEs are added to ceramic glazes for color control<br />
(Campbell <strong>and</strong> Keane, 2010). Barium titanate powder, which<br />
is used in electronic applications, is doped with lanthanides to<br />
modify the properties of the titanate. Yttrium is used to make<br />
ferrites for high frequencies <strong>and</strong> to stabilize zirconia in oxygen<br />
sensors (Yoldjian, 1985).<br />
In 2008, 7,000 t of REOs was used in this category, of<br />
which yttrium oxide accounted for 53 percent; lanthanum<br />
oxide, 17 percent; cerium <strong>and</strong> neodymium oxides, 12 percent<br />
each; <strong>and</strong> praseodymium oxide, 6.0 percent (fig. 7).<br />
In 2008, ceramics accounted for 32 percent of the<br />
consumption of yttrium oxide (3,710 t), 4.8 percent of the<br />
consumption of praseodymium oxide (420 t), 3.5 percent of<br />
the consumption of neodymium oxide (840 t), 3.1 percent of<br />
the consumption of lanthanum oxide (1,190 t), <strong>and</strong> 2.0 percent<br />
Gd 2 O 3<br />
162 t (1.8%)<br />
La 2 O 3<br />
765 t (8.5%)<br />
Tb 6 O 7<br />
414 t (4.6%)<br />
Figure 6. Pie chart showing<br />
the distribution of rare earth<br />
oxide consumption within the<br />
phosphor market sector in<br />
2008. Data are derived from<br />
Bade (2010). CeO 2 , cerium<br />
oxide; Eu 2 O 3 , europium oxide;<br />
Gd 2 O 3 , gadolinium oxide;<br />
La 2 O 3 , lanthanum oxide; Tb 6 O 7 ,<br />
terbium oxide; Y 2 O 3 , yttrium<br />
oxide.
Y 2 O 3<br />
3,710 t (53%)<br />
CeO 2<br />
840 t (12%)<br />
La 2 O 3<br />
1,190 t (17%)<br />
Pr 6 O 11<br />
420 t (6.0%)<br />
Nd 2 O 3<br />
840 t (12%)<br />
Figure 7. Pie chart showing the distribution of rare earth oxide<br />
consumption within the ceramics market sector in 2008. Data are<br />
derived from Bade (2010). CeO 2 , cerium oxide; La 2 O 3 , lanthanum<br />
oxide; Nd 2 O 3 , neodymium oxide; Pr 6 O 11 , praseodymium oxide; Y 2 O 3 ,<br />
yttrium oxide.<br />
of the consumption of cerium oxide (840 t). Technology is<br />
available to recycle these materials, but little actual recycling<br />
occurs because the cost to separate the REEs is higher than the<br />
potential value of the materials (Lucchesi, 2010).<br />
Neodymium-Iron-Boron Magnets<br />
Because of their superior magnetic flux density,<br />
neodymium-iron-boron magnets are in high dem<strong>and</strong> for<br />
small <strong>and</strong> large motors <strong>and</strong> generators. Small (servo) motors<br />
power disc drives in computers, windows in automobiles, <strong>and</strong><br />
multitudes of other everyday applications. Larger motors,<br />
such as those in electric cars, can use up to 200 grams (g) of<br />
neodymium <strong>and</strong> 30 g of dysprosium per motor (Keane, 2009).<br />
Wind turbine generators can contain 1 t of neodymium per<br />
megawatt of electric capacity generated (Barton, 2009).<br />
In 2008, 26,300 t of REOs was used in this category, of<br />
which neodymium oxide accounted for 69 percent; praseodymium<br />
oxide, 23 percent; dysprosium oxide, 5.0 percent;<br />
gadolinium oxide, 2.0 percent; <strong>and</strong> terbium oxide, 0.2 percent<br />
(fig. 8).<br />
End <strong>Use</strong>s For <strong>Rare</strong> <strong>Earth</strong> Elements 9<br />
In 2008, the neodymium-iron-boron magnet category<br />
created 100 percent of the consumption of dysprosium oxide<br />
(1,310 t), 76 percent of the consumption of neodymium oxide<br />
(18,200 t), 70 percent of the consumption of praseodymium<br />
oxide (6,140 t), 69 percent of the consumption of gadolinium<br />
oxide (525 t), <strong>and</strong> 11 percent of the consumption of terbium<br />
oxide (53 t).<br />
Neodymium-iron-boron magnets have the potential to<br />
be recycled, remanufactured, <strong>and</strong> reused because the magnets<br />
can be selectively disengaged from the assemblies in which<br />
they are used. Until recently, there had been no evidence of<br />
ongoing recovery activity (Walter Benecki, Walter Benecki<br />
LLC, written commun., January 26, 2011), partly because<br />
neodymium-iron-boron magnets often corrode with use,<br />
which increases the cost to recover useful elements, <strong>and</strong> partly<br />
because magnets that use plating materials (nickel) are more<br />
complex to recycle (Goodier, 2005). However, Hitachi has<br />
developed technologies to recycle rare earth magnets from<br />
hard disk drives <strong>and</strong> has successfully extracted rare earths<br />
from rare earth magnets (Hitachi, Ltd., 2010).<br />
Pr 6 O 11<br />
6,140 t (23%)<br />
Tb 6 O 7<br />
53 t (0.2%)<br />
Dy O 2 3<br />
1,310 t (5.0%)<br />
Gd O 2 3<br />
525 t (2.0%)<br />
Nd 2 O 3<br />
18,200 t (70%)<br />
Figure 8. Pie chart showing the distribution of rare earth oxide<br />
consumption within the neodymium-iron-boron permanent magnet<br />
market sector in 2008. Data are derived from Bade (2010). CeO 2 ,<br />
cerium oxide; Dy 2 O 3 , dysprosium oxide; Nd 2 O 3 , neodymium oxide;<br />
Pr 6 O 11 , praseodymium oxide; Tb 6 O 7 , terbium oxide.
10 <strong>Rare</strong> <strong>Earth</strong> <strong>Elements—End</strong> <strong>Use</strong> <strong>and</strong> <strong>Recyclability</strong><br />
Battery Alloys<br />
The negative electrode of nickel-metal-hydride (NiMH)<br />
rechargeable batteries comprises a variety of materials whose<br />
principal function is to store hydrogen within the lattice of the<br />
electrode. Some of these materials have REO participation,<br />
particularly the class called RENi 5 where the REO is mostly<br />
cerium or lanthanum oxide, with small amounts of other REOs<br />
included, depending on the nature of the mischmetal used in<br />
manufacture (Kopera, 2004).<br />
In 2008, 12,100 t of REOs was used in this category, of<br />
which lanthanum oxide accounted for 50 percent (6,050 t);<br />
cerium oxide, 33 percent (4,040 t); neodymium oxide, 10<br />
percent (1,210 t); <strong>and</strong> praseodymium <strong>and</strong> samarium oxides,<br />
3.3 percent each (399 t) (fig. 9).<br />
In 2008, the battery alloy category created 73 percent<br />
of the consumption of samarium oxide (399 t), 16 percent of<br />
the consumption of lanthanum oxide (6,050), 10 percent of<br />
the consumption of cerium oxide (4,040 t), 5.1 percent of the<br />
consumption of neodymium oxide (1,210 t); <strong>and</strong> 4.6 percent of<br />
the consumption of praseodymium oxide (399 t).<br />
The RENi 5 chemistry is used almost exclusively in<br />
electric car batteries; the high growth rates expected for sales<br />
of electric cars have created concern about whether there is<br />
sufficient supply of REEs to cover the dem<strong>and</strong> that electric car<br />
batteries would generate (fig. 10).<br />
By yearend 2010, most of the hybrid <strong>and</strong> electric vehicles<br />
sold in the United States were powered by NiMH batteries.<br />
Lithium-ion batteries, which do not use REOs, are expected to<br />
replace the NiMH battery in electric vehicles sometime in the<br />
future (Anderson <strong>and</strong> Patiño-Echeverri, 2009). Future dem<strong>and</strong><br />
for the REEs used in the production of NiMH vehicle batteries<br />
is dependent upon acceptance by the public of electric vehicles<br />
as suitable substitutes for internal-combustion-powered<br />
vehicles, worldwide general economic growth, acceptance of<br />
lithium-ion batteries as a suitable substitute for NiMH batteries,<br />
<strong>and</strong> the technological response of NiMH battery manufacturers<br />
to the penetration of lithium-ion batteries into the<br />
electric vehicle battery market.<br />
NiMH batteries can <strong>and</strong> are being recycled. A spent<br />
NiMH battery contains, by weight, 50 percent nickel,<br />
33 percent REEs, 10 percent cobalt, 6 percent manganese,<br />
<strong>and</strong> 2 percent aluminum (Xu <strong>and</strong> Peng, 2009). The battery is<br />
pyrometallurgically recycled for the nickel <strong>and</strong> cobalt content,<br />
<strong>and</strong> the remainder separates to slag, which is l<strong>and</strong>filled or sold<br />
as construction aggregate.<br />
Nd 2 O 3<br />
1,210 t (10%)<br />
La 2 O 3<br />
6,050 t (50%)<br />
Pr 6 O 11<br />
399 t (3.3%)<br />
SmO<br />
399 t (3.3%)<br />
CeO 2<br />
4,040 t (34%)<br />
Figure 9. Pie chart showing the distribution of rare earth oxide<br />
consumption within the battery alloy market sector in 2008.<br />
Data are derived from Bade (2010). CeO 2 , cerium oxide; La 2 O 3 ,<br />
lanthanum oxide; Nd 2 O 3 , neodymium oxide; Pr 6 O 11 , praseodymium<br />
oxide; SmO, samarium oxide.
Consumption, in thous<strong>and</strong> metric tons<br />
10<br />
9<br />
8<br />
7<br />
6<br />
5<br />
4<br />
3<br />
2<br />
1<br />
0<br />
End <strong>Use</strong>s For <strong>Rare</strong> <strong>Earth</strong> Elements 11<br />
2000 2001 2002 2003 2004 2005 2006 2007 2008 2009<br />
Figure 10. Chart showing dem<strong>and</strong> for rare earth oxides associated with U.S. hybrid automobile sales from 2000 through 2009. Data are<br />
derived from Bade (2010).<br />
Year
12 <strong>Rare</strong> <strong>Earth</strong> <strong>Elements—End</strong> <strong>Use</strong> <strong>and</strong> <strong>Recyclability</strong><br />
Other (Unspecified)<br />
The “other” category includes use of REEs in chemicals,<br />
military weapons <strong>and</strong> delivery systems, <strong>and</strong> satellite systems.<br />
In 2008, 7,500 t of REOs was used in this category, of which<br />
cerium oxide accounted for 39 percent (2,930 t); lanthanum<br />
<strong>and</strong> yttrium oxides, 19 percent (1,430 t) each; neodymium<br />
oxide, 15 percent (1,130 t); praseodymium oxide, 4.0 percent<br />
(300 t); samarium oxide, 2.0 percent (150 t); <strong>and</strong> gadolinium<br />
oxide <strong>and</strong> other REOs, 1.0 percent (75 t) each (fig. 11).<br />
In 2008, the category of other, unspecified uses created<br />
27 percent of the consumption of samarium oxide (150 t),<br />
14 percent of the consumption of other REOs (75 t), 12 percent<br />
of the consumption of yttrium oxide (1,430 t), 9.8 percent<br />
of the consumption of gadolinium oxide (75 t), 6.9 percent of<br />
the consumption of cerium oxide (2,930 t), 4.7 percent of the<br />
consumption of neodymium oxide (1,130 t), 3.7 percent of the<br />
consumption of lanthanum oxide (1,430 t), <strong>and</strong> 3.4 percent of<br />
the consumption of praseodymium oxide (300 t).<br />
Summary<br />
In 2008, consumption of REOs was about 129,000 t,<br />
of which cerium oxide accounted for 33 percent; lanthanum<br />
CeO 2<br />
2,930 t (39%)<br />
Gd 2 O 3<br />
75 t (1.0%)<br />
Other<br />
75 t (1.0%)<br />
La 2 O 3<br />
1,430 t (19%)<br />
oxide, 30 percent; neodymium oxide, 18 percent; yttrium<br />
oxide, 9.0 percent; praseodymium oxide, 6.8 percent; dysprosium<br />
oxide, 1.0 percent; gadolinium oxide, 0.6 percent;<br />
<strong>and</strong> samarium oxide <strong>and</strong> other REOs, 1.6 percent combined.<br />
Cerium, lanthanum, <strong>and</strong> yttrium are used in market sectors<br />
that are driven by the growth of the general economy. Dysprosium,<br />
neodymium, <strong>and</strong> praseodymium are used in lower<br />
growth sectors, but most of their use is in the high-growth<br />
(8–10 percent per year) permanent magnet sector, which can<br />
be exp<strong>and</strong>ed to include batteries for electric cars, motors <strong>and</strong><br />
generators for automobiles, <strong>and</strong> wind turbine generators.<br />
In the event of REE shortages, whether by contraction of<br />
supply or expansion of dem<strong>and</strong>, prices would likely increase<br />
<strong>and</strong> REE recycling activity can likely be expected also to<br />
increase from its current level of near-zero to a higher level<br />
where shortages are partially or wholly mitigated. There are<br />
ongoing research activities into reclaiming REEs from the<br />
scrap generated in the various end-use sectors (Schüler <strong>and</strong> others,<br />
2011). Permanent magnet recycling seems to be the most<br />
promising from a technical st<strong>and</strong>point, which could potentially<br />
benefit this high growth-rate sector. Replacement of NiMH<br />
batteries with lithium-ion batteries for electric cars can also<br />
potentially reduce the dem<strong>and</strong> pressure on cerium, lanthanum,<br />
<strong>and</strong> neodymium, which are three of the six elements whose<br />
dem<strong>and</strong> far exceeds the current supply (Bade, 2010).<br />
Y 2 O 3<br />
1,430 t (19%)<br />
SmO<br />
150 t (2.0%)<br />
Pr 6 O 11<br />
300 t (4.0%)<br />
Nd 2 O 3<br />
1,130 t (15%)<br />
Figure 11. Pie chart showing<br />
the distribution of rare earth<br />
oxide consumption within<br />
unspecified market sectors in<br />
2008. Data are derived from<br />
U.S. Department of Energy<br />
(2008), Hybrid Cars (2009), <strong>and</strong><br />
Tasman Metals Ltd. (2010).<br />
CeO 2 , cerium oxide; Gd 2 O 3 ,<br />
gadolinium oxide; La 2 O 3 ,<br />
lanthanum oxide; Nd 2 O 3 ,<br />
neodymium oxide; Pr 6 O 11 ,<br />
praseodymium oxide; SmO,<br />
samarium oxide; Y 2 O 3 , yttrium<br />
oxide.
References Cited<br />
Anderson, D.L., <strong>and</strong> Patiño-Echeverri, Dalia, 2009, An<br />
evaluation of current <strong>and</strong> future costs for lithium-ion batteries<br />
for use in electrified vehicle powertrains: Raleigh-<br />
Durham, N.C., Nicholas School of the Environment,<br />
Duke University masters thesis, 44 p., accessed November<br />
17, 2009, at http://dukespace.lib.duke.edu/dspace/<br />
bitstream/10161/1007/1/Li-Ion_Battery_costs_-_MP_<br />
Final.pdf.<br />
Anscombe, Nadya, 2002, A new spin—Thin-disc<br />
Yb:YAG lasers: Photonics Spectra, November, accessed<br />
December 21, 2010, at http://www.photonics.com/<br />
Article.aspx?AID=14119.<br />
AZoNano.com, 2009, <strong>Rare</strong>-earth metal making phosphate<br />
glass block UV light: AZoNano.com, December 15,<br />
accessed January 21, 2011, at http://www.azonano.com/<br />
news.aspx?newsID=15133.<br />
Bade, Roger, 2010, <strong>Rare</strong> earths review—Is the hype justified?:<br />
Libertas Capital Corporate Finance Limited, 79 p., accessed<br />
November 4, 2010, at http://www.ucoreraremetals.com/<br />
docs/69555705.pdf.<br />
Barton, Charles, 2009, Wind <strong>and</strong> neodymium: The Nuclear<br />
Green Revolution, January 26, accessed December 3,<br />
2010, at http://nucleargreen.blogspot.com/2009/01/<br />
jack-liftons-research-on-mineral.html.<br />
Bulatov, R.M., <strong>and</strong> Jirnov, B.S., 2009, FCC process of heavy<br />
feed stock with improved yield of light olefins: Oil <strong>and</strong><br />
Gas Business, no. 1, 10 p., accessed January 19, 2011, at<br />
http://www.ogbus.ru/eng/authors/Bulatov/Bulatov_1.pdf.<br />
Campbell, Max, <strong>and</strong> Keane, Chris, 2010, <strong>Rare</strong> earth colorants:<br />
Ceramics Today, aAccessed January 26, 2011, at<br />
http://www.ceramicstoday.com/articles/lanthanides.htm.<br />
Clenfield, Jason, Yasu, Mariko, <strong>and</strong> Biggs, Stuart, 2010,<br />
Hitachi recycles rare earth as China crimps supply (update<br />
2): Bloomberg Business Week, December 8, accessed<br />
December 14, 2010, at http://www.businessweek.com/<br />
news/2010-12-08/hitachi-recycles-rare-earth-as-chinacrimps-supply.html.<br />
Container Recycling Institute, 2008, Wasting <strong>and</strong> recycling<br />
trends—Conclusions from CRI’s 2008 beverage market<br />
data analysis: Container Recycling Institute, 16 p., accessed<br />
January 24, 2011, at http://www.container-recycling.org/<br />
assets/pdfs/reports/2008-BMDA-conclusions.pdf.<br />
Cordier, D.J., <strong>and</strong> Hedrick, J.B., 2010, <strong>Rare</strong> earths: U.S. Geological<br />
Survey Minerals Yearbook 2008, v. I, p. 60.1–60.15.<br />
(Also available at http://minerals.er.usgs.gov/minerals/pubs/<br />
commodity/rare_earths/myb1-2008-raree.pdf.)<br />
References Cited 13<br />
Du, Jun, Li, Zheng, Da, Zhijian, <strong>and</strong> He, Mingyuan, 2009,<br />
<strong>Rare</strong>-earth Y-zeolite catalyst for cracking hydrocarbons <strong>and</strong><br />
a method for preparing same: U.S. Patent 7,514,385 B2,<br />
assigned to China Petroleum <strong>and</strong> Chemical Corporation<br />
<strong>and</strong> Research Institute of Petroleum Processing, Sinopec<br />
(Beijing, CN), 14 p.<br />
<strong>Earth</strong>911.com, 2010a, Facts about glass recycling: <strong>Earth</strong> 911.<br />
com, accessed January 24, 2011, at http://earth911.com/<br />
recycling/glass/facts-about-glass-recycling/.<br />
<strong>Earth</strong>911.com, 2010b, How glass is recycled: <strong>Earth</strong> 911.com,<br />
accessed January 24, 2011, at http://earth911.com/recycling/<br />
glass/how-is-glass-recycled/.<br />
Fast Company, 2011, Kosaka Smelting <strong>and</strong> Refining—For<br />
turning old cell phones into gold mines:<br />
Mansueto Ventures LLC, accessed May 20, 2011,<br />
at http://www.fastcompany.com/most-innovativecompanies/2011/profile/kosaka-smelting-<strong>and</strong>-refining.php.<br />
Goodier, Ewan, 2005, The recycling <strong>and</strong> future selection of<br />
permanent magnets <strong>and</strong> powder cores: Arnold Magnetic<br />
Technologies presentation, 32 p., accessed December<br />
16, 2010, at http://www.arnoldmagnetics.com/WorkArea/<br />
DownloadAsset.aspx?ID=4474.<br />
Herbert, A.J., 2010, Lanthanum glass: Austin, Tex., Austin<br />
Community College paper, [unpaginated], accessed<br />
January 12, 2011, at http://www.austincc.edu/photo/pdf/<br />
lanthanum.pdf.<br />
Hedrick, J.B., 1996, <strong>Rare</strong> earths: U.S. Geological Survey<br />
Minerals Yearbook 1994, v. I, p. 60.1–60.10. (Also available<br />
at http://minerals.er.usgs.gov/minerals/pubs/commodity/<br />
rare_earths/740494.pdf.)<br />
Hedrick, J.B., 1997, <strong>Rare</strong> earths: U.S. Geological Survey<br />
Minerals Yearbook 1995, v. I, p. 60.1–60.10. (Also available<br />
at http://minerals.er.usgs.gov/minerals/pubs/commodity/<br />
rare_earths/740495.pdf.)<br />
Hedrick, J.B., 1998, <strong>Rare</strong> earths: U.S. Geological Survey<br />
Minerals Yearbook 1996, v. I, p. 60.1–60.11. (Also available<br />
at http://minerals.er.usgs.gov/minerals/pubs/commodity/<br />
rare_earths/740496.pdf.)<br />
Hedrick, J.B., 1999, <strong>Rare</strong> earths: U.S. Geological Survey Minerals<br />
Yearbook, 1997, v. I, p. 60.1–60.12. (Also available<br />
at http://minerals.er.usgs.gov/minerals/pubs/commodity/<br />
rare_earths/740497.pdf.)<br />
Hedrick, J.B., 2000, <strong>Rare</strong> earths: U.S. Geological Survey Minerals<br />
Yearbook, 1998, v. I, p. 60.1–60.14. (Also available<br />
at http://minerals.er.usgs.gov/minerals/pubs/commodity/<br />
rare_earths/740498.pdf.)<br />
Hedrick, J.B., 2001, <strong>Rare</strong> earths: U.S. Geological Survey Minerals<br />
Yearbook, 1999, v. I, p. 60.1–60.12. (Also available
14 <strong>Rare</strong> <strong>Earth</strong> <strong>Elements—End</strong> <strong>Use</strong> <strong>and</strong> <strong>Recyclability</strong><br />
at http://minerals.er.usgs.gov/minerals/pubs/commodity/<br />
rare_earths/740499.pdf.)<br />
Hedrick, J.B., 2002, <strong>Rare</strong> earths: U.S. Geological Survey Minerals<br />
Yearbook, 2000, v. I, p. 60.1–60.17. (Also available<br />
at http://minerals.er.usgs.gov/minerals/pubs/commodity/<br />
rare_earths/740400.pdf.)<br />
Hedrick, J.B., 2003, <strong>Rare</strong> earths: U.S. Geological Survey Minerals<br />
Yearbook, 2001, v. I, p. 60.1–60.17. (Also available<br />
at http://minerals.er.usgs.gov/minerals/pubs/commodity/<br />
rare_earths/raremyb01.pdf.)<br />
Hedrick, J.B., 2004, <strong>Rare</strong> earths: U.S. Geological Survey Minerals<br />
Yearbook, 2002, v. I, p. 60.1–60.16. (Also available<br />
at http://minerals.er.usgs.gov/minerals/pubs/commodity/<br />
rare_earths/rareemyb02.pdf.)<br />
Hedrick, J.B., 2005, <strong>Rare</strong> earths: U.S. Geological Survey Minerals<br />
Yearbook, 2003, v. I, p. 60.1–60.15. (Also available<br />
at http://minerals.er.usgs.gov/minerals/pubs/commodity/<br />
rare_earths/rareemyb03.pdf.)<br />
Hedrick, J.B., 2006, <strong>Rare</strong> earths: U.S. Geological Survey Minerals<br />
Yearbook, 2004, v. I, p. 60.1–60.15. (Also available<br />
at http://minerals.er.usgs.gov/minerals/pubs/commodity/<br />
rare_earths/rareemyb04.pdf.)<br />
Hedrick, J.B., 2007, <strong>Rare</strong> earths: U.S. Geological Survey Minerals<br />
Yearbook, 2005, v. I, p. 60.1–60.14. (Also available<br />
at http://minerals.er.usgs.gov/minerals/pubs/commodity/<br />
rare_earths/rareemyb05.pdf.)<br />
Hedrick, J.B., 2008, <strong>Rare</strong> earths: U.S. Geological Survey Minerals<br />
Yearbook, 2006, v. I, p. 60.1–60.14. (Also available<br />
at http://minerals.er.usgs.gov/minerals/pubs/commodity/<br />
rare_earths/myb1-2006-raree.pdf.)<br />
Hedrick, J.B., 2009, <strong>Rare</strong> earths: U.S. Geological Survey Minerals<br />
Yearbook, 2007, v. I, p. 60.1–60.19. (Also available<br />
at http://minerals.er.usgs.gov/minerals/pubs/commodity/<br />
rare_earths/myb1-2007-raree.pdf.)<br />
Heyes, S.J., 1998, Electronic spectroscopy <strong>and</strong> optical properties<br />
of lanthanide compounds: Oxford University, accessed<br />
January 26, 2011, at http://www.chem.ox.ac.uk/icl/heyes/<br />
lanthact/L9.html.<br />
Hitachi, Ltd., 2010, Hitachi develops recycling technologies<br />
for rare-earth metals: Tokyo, Japan, Hitatchi, Ltd.<br />
news release, December 6, accessed January 24, 2011, at<br />
http://www.hitachi.com/New/cnews/101206.html.<br />
Hurst, Cindy, 2010, China’s rare earth elements industry—<br />
What can the west learn?: Washington, D.C., Institute for<br />
Analysis of Global Security, 42 p., accessed November<br />
1, 2010, at http://fmso.leavenworth.army.mil/documents/<br />
rareearth.pdf.<br />
Hybrid Cars, 2009, November 2009 hybrid car sales<br />
numbers: Hybrid Cars, accessed January 21, 2011, at<br />
http://www.hybridcars.com/print/26281.<br />
Keane, Eamon, 2009, Neodymium magnets provide key to<br />
underst<strong>and</strong>ing rare earth trends: Seeking Alpha, June 23, 4<br />
p., accessed December 1, 2010, at http://seekingalpha.com/<br />
instablog/345817-eamon-keane/9675-neodymium-magnetsprovide-key-to-underst<strong>and</strong>ing-rare-earth-trends.<br />
Kopera, J.J.C., 2004, Inside the nickel metal hydride battery:<br />
Cobasys LLC, accessed November 3, 2010, at<br />
http://www.cobasys.com/pdf/tutorial/InsideNimhBattery/<br />
inside_nimh_battery_technology.html.<br />
Lucchesi, B.G., 2010, Mining the scrap pile: U.S. Department<br />
of Energy, The Ames Laboratory, accessed<br />
December 14, 2010, at https://www.ameslab.gov/news/<br />
inquiry/2010-2-mining-scrap-pile.<br />
<strong>Rare</strong>-<strong>Earth</strong>-Technology, 2010, <strong>Rare</strong> earth glass <strong>and</strong> monitors:<br />
<strong>Rare</strong> <strong>Earth</strong> Metals, accessed January 24, 2011, at<br />
http://www.rare-earth-tech.com/rare-earth-glass-<strong>and</strong>monitors.<br />
Schüler, Doris, Buchert, Matthias, Liu, Ran, Dittrich, Stefanie,<br />
<strong>and</strong> Merz, Cornelia, 2011, Study on rare earths <strong>and</strong><br />
their recycling: Darmstadt, Germany, Öko-Institut e.V.,<br />
January, 162 p. (Also available at http://www.oeko.de/<br />
oekodoc/1112/2011-003-en.pdf.)<br />
Tabuchi, Hiroko, 2010, Japan recycles minerals from used<br />
electronics: The New York Times, October 4, accessed<br />
March 16, 2011, at http://www.nytimes.com/2010/10/05/<br />
business/global/05recycle.html.<br />
Tasman Metals Ltd., 2010, Principal uses of rare earth elements:<br />
Tasman Metals Ltd., accessed November 5, 2010, at<br />
http://www.tasmanmetals.com/s/Principal<strong>Use</strong>s.asp.<br />
U.S. Department of Energy, 2008, Historical U.S. hybrid<br />
vehicle sales: U.S. Department of Energy Vehicle Technologies<br />
Program fact #514, April 14, accessed January<br />
21, 2011, at http://www1.eere.energy.gov/vehicles<strong>and</strong>fuels/<br />
facts/2008_fotw514.html.<br />
U.S. Department of Energy, 2009, Energy Conservation<br />
Program—Energy conservation st<strong>and</strong>ards <strong>and</strong><br />
test procedures for general service fluorescent lamps<br />
<strong>and</strong> inc<strong>and</strong>escent reflector lamps: Federal Register,<br />
v. 74, no. 133, July 14, p. 34080–34179. (Also available<br />
online at http://www1.eere.energy.gov/buildings/<br />
appliance_st<strong>and</strong>ards/pdfs/74fr34080.pdf.)<br />
Veolia Environmental Services Inc., 2010, George Martin<br />
discusses researching new recycling technologies: Veolia<br />
Environmental Services Inc., accessed November 3,<br />
2010, at http://veoliaes-ts.com/George%20Martin%20
Discusses%20Researching%20New%20Recycling%20<br />
Technologies?id=2413&lid=1.<br />
VLOC, 2002, Yttrium aluminum garnet laser materials:<br />
VLOC brochure, 5 p., accessed January 12, 2011,<br />
at http://www.optoiq.com/etc/medialib/platform-7/<br />
laser-focus_world/site-images.Par.13920.File.dat/<br />
vloc_yag_tech_brochure.pdf.<br />
Xu, Tao, <strong>and</strong> Peng, Huiqing, 2009, Formation cause, composition<br />
analysis <strong>and</strong> comprehensive utilization of rare earth<br />
solid wastes: Journal of <strong>Rare</strong> <strong>Earth</strong>s, v. 27, no. 6, December,<br />
p. 1096-1102. (Also available at http://www.re-journal.com/<br />
en/download.asp?ID=981.)<br />
References Cited 15<br />
Yoldjian, G., 1985, The use of rare earths in ceramics: Journal<br />
of the Less Common Metals, v. 111, no. 1–2, September,<br />
accessed January 25, 2011, at http://www.sciencedirect.com/<br />
science?_ob=ArticleURL&_udi=B759D-48GNF08-2N&_<br />
user=696292&_coverDate=09%2F30%2F1985&_<br />
rdoc=1&_fmt=high&_orig=gateway&_<br />
origin=gateway&_sort=d&_docanchor=&view=c&_<br />
searchStrId=1739465215&_rerunOrigin=google&_<br />
acct=C000038819&_version=1&_urlVersion=0&_userid=<br />
696292&md5=173c6a8d4943c513163d0f5602e9d25b&sea<br />
rchtype=a.
Printed on recycled paper<br />
Goonan—<strong>Rare</strong> <strong>Earth</strong> <strong>Elements—End</strong> <strong>Use</strong> <strong>and</strong> <strong>Recyclability</strong>—Scientific Investigations Report 2011–5094


