CalEnviroscreen Version 1.1 - OEHHA - State of California
CalEnviroscreen Version 1.1 - OEHHA - State of California
CalEnviroscreen Version 1.1 - OEHHA - State of California

Create successful ePaper yourself
Turn your PDF publications into a flip-book with our unique Google optimized e-Paper software.
CalEnviroScreen <strong>1.1</strong><br />
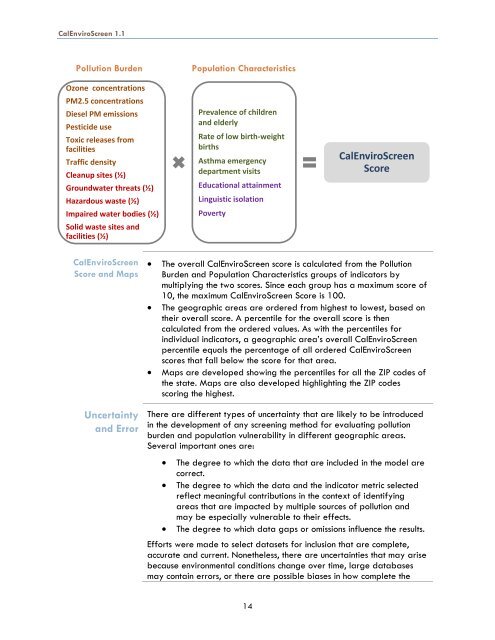
Pollution Burden<br />
Ozone concentrations<br />
PM2.5 concentrations<br />
Diesel PM emissions<br />
Pesticide use<br />
Toxic releases from<br />
facilities<br />
Traffic density<br />
Cleanup sites (½)<br />
Groundwater threats (½)<br />
Hazardous waste (½)<br />
Impaired water bodies (½)<br />
Solid waste sites and<br />
facilities (½)<br />
Population Characteristics<br />
Prevalence <strong>of</strong> children<br />
and elderly<br />
Rate <strong>of</strong> low birth-weight<br />
births<br />
Asthma emergency<br />
department visits<br />
Educational attainment<br />
Linguistic isolation<br />
Poverty<br />
CalEnviroScreen<br />
Score<br />
CalEnviroScreen<br />
Score and Maps <br />
<br />
<br />
The overall CalEnviroScreen score is calculated from the Pollution<br />
Burden and Population Characteristics groups <strong>of</strong> indicators by<br />
multiplying the two scores. Since each group has a maximum score <strong>of</strong><br />
10, the maximum CalEnviroScreen Score is 100.<br />
The geographic areas are ordered from highest to lowest, based on<br />
their overall score. A percentile for the overall score is then<br />
calculated from the ordered values. As with the percentiles for<br />
individual indicators, a geographic area’s overall CalEnviroScreen<br />
percentile equals the percentage <strong>of</strong> all ordered CalEnviroScreen<br />
scores that fall below the score for that area.<br />
Maps are developed showing the percentiles for all the ZIP codes <strong>of</strong><br />
the state. Maps are also developed highlighting the ZIP codes<br />
scoring the highest.<br />
Uncertainty<br />
and Error<br />
There are different types <strong>of</strong> uncertainty that are likely to be introduced<br />
in the development <strong>of</strong> any screening method for evaluating pollution<br />
burden and population vulnerability in different geographic areas.<br />
Several important ones are:<br />
<br />
<br />
<br />
The degree to which the data that are included in the model are<br />
correct.<br />
The degree to which the data and the indicator metric selected<br />
reflect meaningful contributions in the context <strong>of</strong> identifying<br />
areas that are impacted by multiple sources <strong>of</strong> pollution and<br />
may be especially vulnerable to their effects.<br />
The degree to which data gaps or omissions influence the results.<br />
Efforts were made to select datasets for inclusion that are complete,<br />
accurate and current. Nonetheless, there are uncertainties that may arise<br />
because environmental conditions change over time, large databases<br />
may contain errors, or there are possible biases in how complete the<br />
14