Package 'txtplot'
Package 'txtplot'
Package 'txtplot'
Create successful ePaper yourself
Turn your PDF publications into a flip-book with our unique Google optimized e-Paper software.
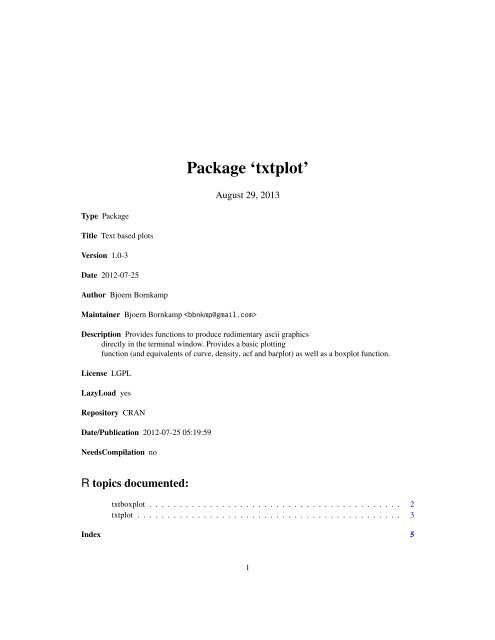
<strong>Package</strong> ‘txtplot’<br />
August 29, 2013<br />
Type <strong>Package</strong><br />
Title Text based plots<br />
Version 1.0-3<br />
Date 2012-07-25<br />
Author Bjoern Bornkamp<br />
Maintainer Bjoern Bornkamp <br />
Description Provides functions to produce rudimentary ascii graphics<br />
directly in the terminal window. Provides a basic plotting<br />
function (and equivalents of curve, density, acf and barplot) as well as a boxplot function.<br />
License LGPL<br />
LazyLoad yes<br />
Repository CRAN<br />
Date/Publication 2012-07-25 05:19:59<br />
NeedsCompilation no<br />
R topics documented:<br />
txtboxplot . . . . . . . . . . . . . . . . . . . . . . . . . . . . . . . . . . . . . . . . . . 2<br />
txtplot . . . . . . . . . . . . . . . . . . . . . . . . . . . . . . . . . . . . . . . . . . . . 3<br />
Index 5<br />
1
2 txtboxplot<br />
txtboxplot<br />
Text based boxplot<br />
Description<br />
Produces rudimentary ascii boxplots. The boxplot statistics are produced using the boxplot.stats<br />
function.<br />
Usage<br />
txtboxplot(..., range = 1.5, legend = NULL, xlab = NULL,<br />
width = round(options()$width * 0.8))<br />
Arguments<br />
... Numeric vectors for which a boxplot should be produced<br />
range<br />
legend<br />
xlab<br />
width<br />
This determines how far the plot whiskers extend out from the box. See boxplot.stats<br />
and the coef function for details.<br />
Logical determining whether a legend should be drawn. If legend is NULL<br />
there will be a legend drawn in case there is more than one boxplot.<br />
label for x-axis of boxplot, if NULL no x-label will be plotted<br />
Width of the plot<br />
Note<br />
Due to rounding to a relatively crude grid results can only be approximate. E.g. the equally spaced<br />
axis ticks may be non-equally spaced in the plot.<br />
Author(s)<br />
Bjoern Bornkamp<br />
See Also<br />
txtplot<br />
Examples<br />
rand1
txtplot 3<br />
txtplot<br />
Ascii graphics<br />
Description<br />
Provides a function to produce rudimentary ascii graphics directly in the terminal window.<br />
txtplot provides the basic plotting function of two numeric vectors. All other functions below are<br />
based on this.<br />
txtcurve is a text based equivalent of the curve function<br />
txtdensity is a text based density estimation function based on the density function<br />
txtacf is a text based equivalent of the acf function and based on the acf function.<br />
txtbarchart is a text based barplot and plots the relative frequences of the occurences of the<br />
different levels of a factor (in percent)<br />
Usage<br />
txtplot(x, y = NULL, pch = "*", width = round(options()$width*0.8),<br />
height = round(0.25*width), xlab = NULL, ylab = NULL,<br />
xlim = NULL, ylim = NULL)<br />
txtcurve(expr, from = NULL, to = NULL, n = 101,<br />
pch = "*", width = round(options()$width*0.8),<br />
height = round(0.25*width), xlab = NULL, ylab = NULL)<br />
txtdensity(x, pch = "*", width = round(options()$width*0.8),<br />
height = round(0.25*width), xlab = NULL, ylab = NULL)<br />
txtacf(x, pch = "*", lag.max = 20, type = c("correlation", "covariance", "partial"),<br />
na.action = na.fail, demean = TRUE, width = round(options()$width*0.8),<br />
height = round(0.25*width), xlab = NULL, ylab = NULL)<br />
txtbarchart(x, pch = "*", width = round(options()$width*0.8),<br />
height = round(0.25*width), ylab = NULL)<br />
Arguments<br />
x<br />
y<br />
pch<br />
width, height<br />
xlab, ylab<br />
numeric containing the x-values to plot (for txtbarchart this needs to be of<br />
class factor). NA, NaN are removed for plotting. Infinities cause an error<br />
numeric containing the x-values to plot (needs to be of the same length as x).<br />
If NULL the numeric x is plotted against 1:length(x). NA, NaN are removed<br />
for plotting. Infinities cause an error<br />
Plotting symbol<br />
Width and height of the plots in points<br />
labels for x and y axis
4 txtplot<br />
Note<br />
xlim, ylim<br />
limits for x and y axis in plot, if equal to NULL automatically determined from<br />
x and y.<br />
expr An expression to plot (containing x)<br />
from,to<br />
Defines boundaries of plotting region for expr in txtcurve<br />
n<br />
integer specifying the number of x values between from and to<br />
lag.max, type, na.action, demean<br />
arguments for call of acf function, see ?acf for details<br />
Due to rounding to a relatively crude grid results can only be approximate! The equally spaced axis<br />
ticks, for example, may be non-equally spaced in the plot.<br />
Due to the crude grid also there might be several points per pixel. The function uses the same<br />
plotting symbol no matter how many points coincide on one pixel<br />
Author(s)<br />
See Also<br />
Bjoern Bornkamp<br />
txtboxplot<br />
Examples<br />
## basic plotting function<br />
require(stats)<br />
txtplot(cars[,1], cars[,2])<br />
## can include axis labels when desired<br />
txtplot(cars[,1], cars[,2], xlab = "speed", ylab = "distance")<br />
## text based density plot<br />
txtdensity(rnorm(500))<br />
## text based plotting of functions<br />
txtcurve(x/(x+1), 0, 4, xlab = "Emax model")<br />
## text based acf<br />
txtacf(rnorm(100))<br />
## text based barchart<br />
x
Index<br />
∗Topic hplot<br />
txtboxplot, 2<br />
txtplot, 3<br />
boxcore (txtboxplot), 2<br />
boxplot.stats, 2<br />
checkNA (txtplot), 3<br />
drawLegend (txtplot), 3<br />
getRng (txtplot), 3<br />
getTicks (txtplot), 3<br />
insEOL (txtplot), 3<br />
txtacf (txtplot), 3<br />
txtbarchart (txtplot), 3<br />
txtboxplot, 2, 4<br />
txtcurve (txtplot), 3<br />
txtdensity (txtplot), 3<br />
txtplot, 2, 3<br />
5


