Construction and Validation of the 4-Item Dynamic Gait Index
Construction and Validation of the 4-Item Dynamic Gait Index
Construction and Validation of the 4-Item Dynamic Gait Index

Create successful ePaper yourself
Turn your PDF publications into a flip-book with our unique Google optimized e-Paper software.
use <strong>of</strong> <strong>the</strong> nonparametric Mann-<br />
Whitney U test with a type I error rate<br />
<strong>of</strong> less than .05. Because <strong>of</strong> <strong>the</strong> significant<br />
age difference between <strong>the</strong> test<br />
<strong>and</strong> control subject groups, this analysis<br />
also was performed with subjects stratified<br />
by age at younger than 65 years<br />
<strong>and</strong> 65 years <strong>and</strong> older.<br />
The discriminative abilities <strong>of</strong> <strong>the</strong> gait<br />
measures, recorded with <strong>the</strong> reduceditem<br />
DGI, to detect performance<br />
changes attributable to vestibular or balance<br />
dysfunction were compared with<br />
those <strong>of</strong> <strong>the</strong> 8-item DGI by use <strong>of</strong> receiver<br />
operating characteristic curve (ROC)<br />
analysis. 24 For both <strong>the</strong> 8-item test <strong>and</strong><br />
<strong>the</strong> reduced-item test total scores, <strong>the</strong><br />
sensitivity <strong>and</strong> specificity for identifying<br />
test <strong>and</strong> control subjects were determined<br />
for each possible total score. The<br />
area under <strong>the</strong> curve (AUC) that was<br />
generated by plotting sensitivity against<br />
<strong>the</strong> rate <strong>of</strong> false-positive results (1 <br />
sensitivity) for detecting test <strong>and</strong> control<br />
subjects was tested against a nullhypo<strong>the</strong>sis<br />
AUC <strong>of</strong> .50, indicating no<br />
discriminative value.<br />
Curves for both <strong>the</strong> 8-item test <strong>and</strong> <strong>the</strong><br />
reduced-item test total scores were analyzed<br />
by use <strong>of</strong> a type I error rate <strong>of</strong> less<br />
than .05. The total scores on both <strong>the</strong><br />
8-item DGI <strong>and</strong> <strong>the</strong> reduced-item DGI<br />
that maximized <strong>the</strong> sensitivity <strong>and</strong> specificity<br />
for discriminating test subjects<br />
from control subjects were identified.<br />
Because <strong>of</strong> <strong>the</strong> significant mean age<br />
difference between <strong>the</strong> test <strong>and</strong> control<br />
subjects, with test subjects generally<br />
being older, <strong>the</strong> ROC curve analysis was<br />
performed for subjects stratified by age<br />
at younger than 65 years <strong>and</strong> 65 years<br />
<strong>and</strong> older.<br />
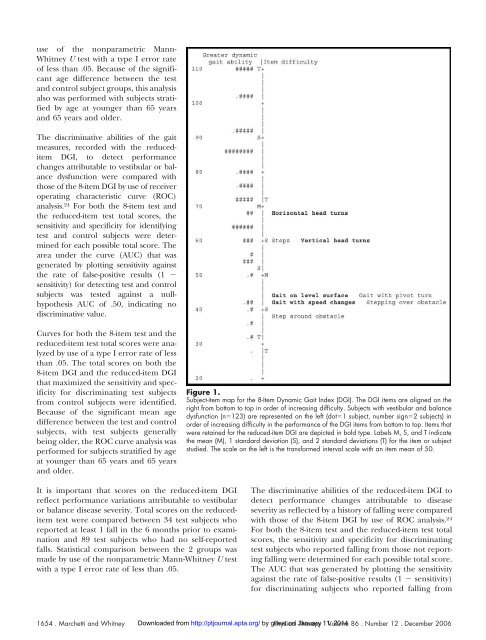
Figure 1.<br />
Subject-item map for <strong>the</strong> 8-<strong>Item</strong> <strong>Dynamic</strong> <strong>Gait</strong> <strong>Index</strong> (DGI). The DGI items are aligned on <strong>the</strong><br />
right from bottom to top in order <strong>of</strong> increasing difficulty. Subjects with vestibular <strong>and</strong> balance<br />
dysfunction (n123) are represented on <strong>the</strong> left (dot1 subject, number sign2 subjects) in<br />
order <strong>of</strong> increasing difficulty in <strong>the</strong> performance <strong>of</strong> <strong>the</strong> DGI items from bottom to top. <strong>Item</strong>s that<br />
were retained for <strong>the</strong> reduced-item DGI are depicted in bold type. Labels M, S, <strong>and</strong> T indicate<br />
<strong>the</strong> mean (M), 1 st<strong>and</strong>ard deviation (S), <strong>and</strong> 2 st<strong>and</strong>ard deviations (T) for <strong>the</strong> item or subject<br />
studied. The scale on <strong>the</strong> left is <strong>the</strong> transformed interval scale with an item mean <strong>of</strong> 50.<br />
It is important that scores on <strong>the</strong> reduced-item DGI<br />
reflect performance variations attributable to vestibular<br />
or balance disease severity. Total scores on <strong>the</strong> reduceditem<br />
test were compared between 34 test subjects who<br />
reported at least 1 fall in <strong>the</strong> 6 months prior to examination<br />
<strong>and</strong> 89 test subjects who had no self-reported<br />
falls. Statistical comparison between <strong>the</strong> 2 groups was<br />
made by use <strong>of</strong> <strong>the</strong> nonparametric Mann-Whitney U test<br />
with a type I error rate <strong>of</strong> less than .05.<br />
The discriminative abilities <strong>of</strong> <strong>the</strong> reduced-item DGI to<br />
detect performance changes attributable to disease<br />
severity as reflected by a history <strong>of</strong> falling were compared<br />
with those <strong>of</strong> <strong>the</strong> 8-item DGI by use <strong>of</strong> ROC analysis. 24<br />
For both <strong>the</strong> 8-item test <strong>and</strong> <strong>the</strong> reduced-item test total<br />
scores, <strong>the</strong> sensitivity <strong>and</strong> specificity for discriminating<br />
test subjects who reported falling from those not reporting<br />
falling were determined for each possible total score.<br />
The AUC that was generated by plotting <strong>the</strong> sensitivity<br />
against <strong>the</strong> rate <strong>of</strong> false-positive results (1 sensitivity)<br />
for discriminating subjects who reported falling from<br />
1654 . Marchetti <strong>and</strong> Whitney Downloaded from http://ptjournal.apta.org/ by guest Physical on January Therapy 11, . Volume 2014 86 . Number 12 . December 2006