Construction and Validation of the 4-Item Dynamic Gait Index
Construction and Validation of the 4-Item Dynamic Gait Index
Construction and Validation of the 4-Item Dynamic Gait Index

Create successful ePaper yourself
Turn your PDF publications into a flip-book with our unique Google optimized e-Paper software.
subject separation reliability for <strong>the</strong><br />
4-item DGI was shown to be high (.79).<br />
The item difficulty separation reliability<br />
was shown to be excellent (.99).<br />
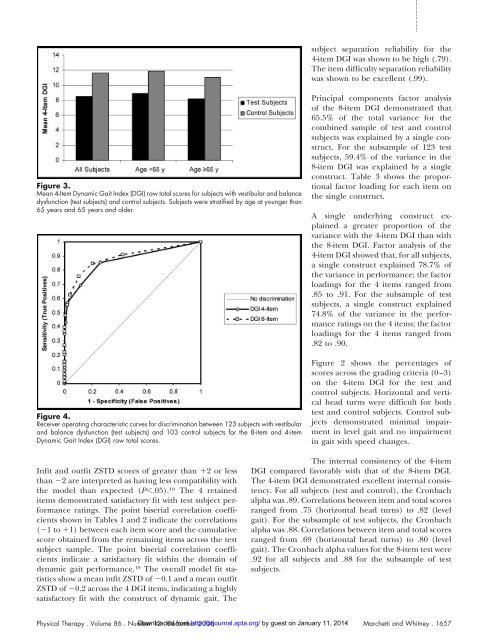
Figure 3.<br />
Mean 4-<strong>Item</strong> <strong>Dynamic</strong> <strong>Gait</strong> <strong>Index</strong> (DGI) raw total scores for subjects with vestibular <strong>and</strong> balance<br />
dysfunction (test subjects) <strong>and</strong> control subjects. Subjects were stratified by age at younger than<br />
65 years <strong>and</strong> 65 years <strong>and</strong> older.<br />
Figure 4.<br />
Receiver operating characteristic curves for discrimination between 123 subjects with vestibular<br />
<strong>and</strong> balance dysfunction (test subjects) <strong>and</strong> 103 control subjects for <strong>the</strong> 8-item <strong>and</strong> 4-item<br />
<strong>Dynamic</strong> <strong>Gait</strong> <strong>Index</strong> (DGI) raw total scores.<br />
Principal components factor analysis<br />
<strong>of</strong> <strong>the</strong> 8-item DGI demonstrated that<br />
65.5% <strong>of</strong> <strong>the</strong> total variance for <strong>the</strong><br />
combined sample <strong>of</strong> test <strong>and</strong> control<br />
subjects was explained by a single construct.<br />
For <strong>the</strong> subsample <strong>of</strong> 123 test<br />
subjects, 59.4% <strong>of</strong> <strong>the</strong> variance in <strong>the</strong><br />
8-item DGI was explained by a single<br />
construct. Table 3 shows <strong>the</strong> proportional<br />
factor loading for each item on<br />
<strong>the</strong> single construct.<br />
A single underlying construct explained<br />
a greater proportion <strong>of</strong> <strong>the</strong><br />
variance with <strong>the</strong> 4-item DGI than with<br />
<strong>the</strong> 8-item DGI. Factor analysis <strong>of</strong> <strong>the</strong><br />
4-item DGI showed that, for all subjects,<br />
a single construct explained 78.7% <strong>of</strong><br />
<strong>the</strong> variance in performance; <strong>the</strong> factor<br />
loadings for <strong>the</strong> 4 items ranged from<br />
.85 to .91. For <strong>the</strong> subsample <strong>of</strong> test<br />
subjects, a single construct explained<br />
74.8% <strong>of</strong> <strong>the</strong> variance in <strong>the</strong> performance<br />
ratings on <strong>the</strong> 4 items; <strong>the</strong> factor<br />
loadings for <strong>the</strong> 4 items ranged from<br />
.82 to .90.<br />
Figure 2 shows <strong>the</strong> percentages <strong>of</strong><br />
scores across <strong>the</strong> grading criteria (0–3)<br />
on <strong>the</strong> 4-item DGI for <strong>the</strong> test <strong>and</strong><br />
control subjects. Horizontal <strong>and</strong> vertical<br />
head turns were difficult for both<br />
test <strong>and</strong> control subjects. Control subjects<br />
demonstrated minimal impairment<br />
in level gait <strong>and</strong> no impairment<br />
in gait with speed changes.<br />
Infit <strong>and</strong> outfit ZSTD scores <strong>of</strong> greater than 2 or less<br />
than 2 are interpreted as having less compatibility with<br />
<strong>the</strong> model than expected (P.05). 19 The 4 retained<br />
items demonstrated satisfactory fit with test subject performance<br />
ratings. The point biserial correlation coefficients<br />
shown in Tables 1 <strong>and</strong> 2 indicate <strong>the</strong> correlations<br />
(1 to1) between each item score <strong>and</strong> <strong>the</strong> cumulative<br />
score obtained from <strong>the</strong> remaining items across <strong>the</strong> test<br />
subject sample. The point biserial correlation coefficients<br />
indicate a satisfactory fit within <strong>the</strong> domain <strong>of</strong><br />
dynamic gait performance. 19 The overall model fit statistics<br />
show a mean infit ZSTD <strong>of</strong> 0.1 <strong>and</strong> a mean outfit<br />
ZSTD <strong>of</strong> 0.2 across <strong>the</strong> 4 DGI items, indicating a highly<br />
satisfactory fit with <strong>the</strong> construct <strong>of</strong> dynamic gait. The<br />
The internal consistency <strong>of</strong> <strong>the</strong> 4-item<br />
DGI compared favorably with that <strong>of</strong> <strong>the</strong> 8-item DGI.<br />
The 4-item DGI demonstrated excellent internal consistency.<br />
For all subjects (test <strong>and</strong> control), <strong>the</strong> Cronbach<br />
alpha was .89. Correlations between item <strong>and</strong> total scores<br />
ranged from .75 (horizontal head turns) to .82 (level<br />
gait). For <strong>the</strong> subsample <strong>of</strong> test subjects, <strong>the</strong> Cronbach<br />
alpha was .88. Correlations between item <strong>and</strong> total scores<br />
ranged from .69 (horizontal head turns) to .80 (level<br />
gait). The Cronbach alpha values for <strong>the</strong> 8-item test were<br />
.92 for all subjects <strong>and</strong> .88 for <strong>the</strong> subsample <strong>of</strong> test<br />
subjects.<br />
Physical Therapy . Volume 86 . Number Downloaded 12 . December from http://ptjournal.apta.org/<br />
2006 by guest on January 11, 2014 Marchetti <strong>and</strong> Whitney . 1657