Construction and Validation of the 4-Item Dynamic Gait Index
Construction and Validation of the 4-Item Dynamic Gait Index
Construction and Validation of the 4-Item Dynamic Gait Index

Create successful ePaper yourself
Turn your PDF publications into a flip-book with our unique Google optimized e-Paper software.
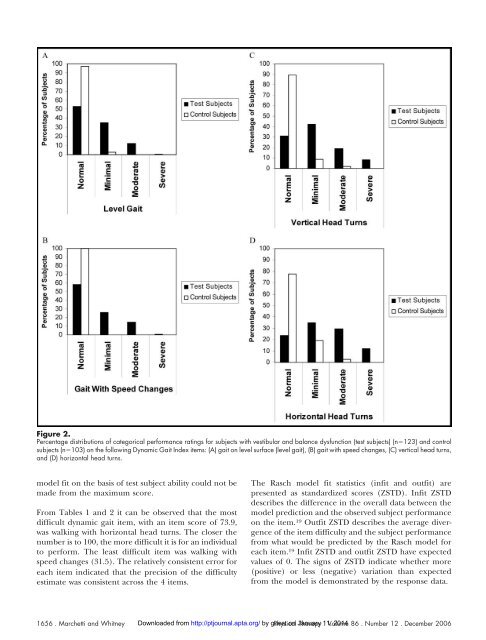
Figure 2.<br />
Percentage distributions <strong>of</strong> categorical performance ratings for subjects with vestibular <strong>and</strong> balance dysfunction (test subjects) (n123) <strong>and</strong> control<br />
subjects (n103) on <strong>the</strong> following <strong>Dynamic</strong> <strong>Gait</strong> <strong>Index</strong> items: (A) gait on level surface (level gait), (B) gait with speed changes, (C) vertical head turns,<br />
<strong>and</strong> (D) horizontal head turns.<br />
model fit on <strong>the</strong> basis <strong>of</strong> test subject ability could not be<br />
made from <strong>the</strong> maximum score.<br />
From Tables 1 <strong>and</strong> 2 it can be observed that <strong>the</strong> most<br />
difficult dynamic gait item, with an item score <strong>of</strong> 73.9,<br />
was walking with horizontal head turns. The closer <strong>the</strong><br />
number is to 100, <strong>the</strong> more difficult it is for an individual<br />
to perform. The least difficult item was walking with<br />
speed changes (31.5). The relatively consistent error for<br />
each item indicated that <strong>the</strong> precision <strong>of</strong> <strong>the</strong> difficulty<br />
estimate was consistent across <strong>the</strong> 4 items.<br />
The Rasch model fit statistics (infit <strong>and</strong> outfit) are<br />
presented as st<strong>and</strong>ardized scores (ZSTD). Infit ZSTD<br />
describes <strong>the</strong> difference in <strong>the</strong> overall data between <strong>the</strong><br />
model prediction <strong>and</strong> <strong>the</strong> observed subject performance<br />
on <strong>the</strong> item. 19 Outfit ZSTD describes <strong>the</strong> average divergence<br />
<strong>of</strong> <strong>the</strong> item difficulty <strong>and</strong> <strong>the</strong> subject performance<br />
from what would be predicted by <strong>the</strong> Rasch model for<br />
each item. 19 Infit ZSTD <strong>and</strong> outfit ZSTD have expected<br />
values <strong>of</strong> 0. The signs <strong>of</strong> ZSTD indicate whe<strong>the</strong>r more<br />
(positive) or less (negative) variation than expected<br />
from <strong>the</strong> model is demonstrated by <strong>the</strong> response data.<br />
1656 . Marchetti <strong>and</strong> Whitney Downloaded from http://ptjournal.apta.org/ by guest Physical on January Therapy 11, . Volume 2014 86 . Number 12 . December 2006