BP STATS REVIEW OBC
BP STATS REVIEW OBC
BP STATS REVIEW OBC

You also want an ePaper? Increase the reach of your titles
YUMPU automatically turns print PDFs into web optimized ePapers that Google loves.
Energy in focus<br />
<strong>BP</strong> Statistical Review of World Energy June 2004
2 2003 in review<br />
Oil<br />
4 Reserves<br />
6 Production<br />
9 Consumption<br />
12 Regional consumption – by product group<br />
14 Prices<br />
15 Stocks<br />
16 Refining<br />
18 Trade movements<br />
Natural gas<br />
20 Reserves<br />
22 Production<br />
25 Consumption<br />
28 Trade movements<br />
29 Prices<br />
Coal<br />
30 Reserves<br />
30 Prices<br />
32 Production<br />
33 Consumption<br />
Nuclear energy<br />
34 Consumption<br />
Hydroelectricity<br />
35 Consumption<br />
Primary energy<br />
37 Consumption<br />
38 Consumption by fuel<br />
40 Fossil fuel reserves-to-production (R/P) ratios<br />
40 Consumption – per capita<br />
Appendices<br />
Conversion factors<br />
Definitions<br />
Find out more online<br />
The <strong>BP</strong> Statistical Review of World Energy 2004 is<br />
available online at www.bp.com/statisticalreview2004<br />
Our website contains all data found in the printed<br />
edition, plus a number of additions, including:<br />
• The historical series from 1965 for many sections;<br />
• Extra tables for natural gas, coal, hydroelectricity,<br />
nuclear energy and electricity;<br />
• Additional energy topics including renewable energy;<br />
• Energy charting tool, where you can view<br />
pre-determined reports or chart-specific data<br />
according to energy type, region and year;<br />
• Oil, natural gas and LNG conversion calculator;<br />
• Alternative file formats and a full list of file downloads.<br />
About <strong>BP</strong><br />
<strong>BP</strong> is one of the world’s largest oil and gas companies,<br />
serving some 13 million customers in more than 100<br />
countries across six continents. Our main businesses<br />
are exploration and production; refining and marketing;<br />
gas, power and renewables; and petrochemicals.<br />
Through these business segments, we provide<br />
fuel for transportation, energy for heat and light,<br />
retail brands, and petrochemicals products for use<br />
in everyday items.
Foreword<br />
In a period of great volatility and uncertainty in world<br />
energy markets, it is important to establish the facts,<br />
because only facts can provide a sound basis for<br />
judgement and policy.<br />
The <strong>BP</strong> Statistical Review of World Energy, now<br />
in its 53rd year, aims to provide one important part of<br />
that fact base – recording, year by year, the production<br />
and consumption of all the main forms of energy on a<br />
global basis.<br />
This year’s Review contains much fascinating<br />
information, and I would draw your attention to just<br />
four points of particular significance.<br />
Firstly, the data illustrates the continued growth in<br />
reserve volumes across the world. At current levels of<br />
consumption there are sufficient reserves to meet oil<br />
demand for some 40 years and to meet natural gas<br />
demand for well over 60 years. On recent trends there<br />
appears to be considerable scope for proved reserves<br />
(and production) to keep rising in Russia and elsewhere.<br />
Reserves, globally, have grown over time and it is clear<br />
that the issue of energy security, which has been so<br />
prominent over the last year, is driven not by a physical<br />
shortage of supply but by the challenges of ensuring, in<br />
a world where demand and supply are not co-located,<br />
that there will be sufficient traded oil and gas to meet<br />
rising demand.<br />
Secondly, the Review puts in context the recent<br />
surge in prices. Even at $40 per barrel, the price<br />
of crude oil in real terms is still only half the level<br />
reached in 1980. An effective global market and<br />
continued advances in technology have enabled the<br />
world to absorb a 25% increase in daily oil demand<br />
in the intervening period.<br />
Thirdly, though oil remains a vital fuel, with few<br />
viable substitutes in the transport sector in particular,<br />
the energy mix is being balanced by continued growth<br />
in demand for natural gas. Technical advances have<br />
encouraged gas consumption, as has the desire to move<br />
to fuels that emit less carbon. The Review records last<br />
year’s double-digit growth in liquefied natural gas trade,<br />
one indicator of the fact that gas is now traded<br />
internationally as well as regionally.<br />
Fourthly, the Review tracks the changing geographic<br />
pattern of the energy market led by the doubling of<br />
Chinese oil demand over the last 10 years. China has<br />
now overtaken Japan as the world’s second largest<br />
consumer of oil behind the United States. Chinese<br />
decisions on imports and trading links, for both oil<br />
and natural gas, will be a major influence on the<br />
world energy scene from now on.<br />
I would like to thank all those within <strong>BP</strong> and<br />
beyond who have helped to produce this year’s<br />
edition, which can be found on our website at<br />
www.bp.com/statisticalreview2004. I hope you will<br />
find it a useful and stimulating summary of a fascinating<br />
and ever evolving story, which remains at the heart of<br />
human progress.<br />
The Lord Browne of Madingley<br />
Group Chief Executive<br />
June 2004<br />
<strong>BP</strong> 2004 Statistical Review of World Energy
2003 in review<br />
This year’s Statistical Review includes a new improved data<br />
series for proved oil and natural gas reserves. The new series<br />
does not necessarily meet the United States Securities and<br />
Exchange Commission definitions and guidelines for determining<br />
proved reserves nor necessarily represent <strong>BP</strong>’s view of proved<br />
reserves by country. Rather it has been compiled using a<br />
combination of primary official sources and third-party data<br />
to provide more complete and timely series than published<br />
previously. Historic data has also been revised. In addition, oil<br />
reserves include more comprehensive data on condensate and<br />
natural gas liquids. Canadian oil sands ‘under active development’<br />
have also been included in proved oil reserves.<br />
Following initial deliveries of<br />
liquid natural gas (LNG) in 2003,<br />
Europe’s first integrated<br />
gasification and power project is<br />
now in full operation. With storage<br />
tanks almost twice the diameter<br />
of St Paul’s Cathedral dome in<br />
London, the terminal has capacity<br />
to process over 2.7 billion cubic<br />
metres of LNG every year.<br />
A year of exceptional strength<br />
in energy markets<br />
2003 was a year of exceptional strength in energy<br />
markets. Oil and natural gas prices reached new 20-year<br />
highs as world primary energy consumption increased<br />
by a relatively strong 2.9%, on the back of global<br />
economic recovery and the ongoing boom in China.<br />
Energy developments<br />
Primary energy consumption increased in all regions of the world<br />
in 2003. The strongest increase was in Asia Pacific, up 6.3%,<br />
while North America recorded the weakest growth, at 0.2%. As in<br />
2002, coal was the fastest-growing fuel, rising by 6.9% globally.<br />
Oil consumption was also relatively strong but the growth of<br />
natural gas use was held back by a steep, price-induced fall in US<br />
consumption. Hydroelectric generation was up by only 0.4% and<br />
nuclear generation suffered only the second contraction in its history.<br />
Oil<br />
Oil prices in 2003 were the highest (in nominal terms) for 20 years:<br />
Brent dated averaged $28.83 per barrel. Brent began the year at<br />
around $30 per barrel and rose to a high of just under $35 per barrel<br />
on 10 March, a week before the start of war in Iraq. Prices then fell<br />
steeply to reach a low of under $23 at the end of April, as the Iraq<br />
conflict drew to a close, before trending upwards for the rest of the<br />
year, ending the year above $30 per barrel once again.<br />
Oil consumption grew strongly in 2003, despite high oil prices.<br />
Consumption grew by almost 1.5 million barrels per day (b/d)<br />
or 2.1%, above the 10-year annual average growth rate of 1.6%.<br />
Consumption increased in all regions of the world but most<br />
strongly in Asia Pacific, up by 860,000 b/d or 4%.<br />
Venezuela and Iraq suffered supply disruptions in 2003, with<br />
production falling by 230,000 b/d and 690,000 b/d respectively.<br />
However, OPEC oil production overall increased substantially by<br />
1.88 million b/d as other members of the organization more than<br />
compensated for the loss of supply. Saudi Arabia’s output rose by<br />
more than 1 million b/d to hit a 22-year high of over 9.8 million b/d.<br />
Oil production outside OPEC grew by 830,000 b/d in 2003, down on<br />
the 1.33 million b/d growth seen in 2002 but somewhat above the<br />
10-year average. Russia, where production grew by 840,000 b/d,<br />
accounted for essentially all of this increase. Mexico and Canada<br />
were the only other Non-OPEC countries to register growth of more<br />
than 100,000 b/d. The UK registered the biggest production decline,<br />
down by 220,000 b/d, followed by the USA, down by 170,000 b/d.<br />
2 <strong>BP</strong> 2004 Statistical Review of World Energy
The Na Kika field is one of<br />
20 operated by <strong>BP</strong> in the<br />
Gulf of Mexico. In production<br />
since 2003, Na Kika is the first in<br />
a new generation of deepwater<br />
operations in a region where <strong>BP</strong><br />
has operated since the 1980s.<br />
For 50 years the lake at<br />
Forggensee, Southern Germany,<br />
an area of outstanding natural<br />
beauty, has been used as a<br />
source of hydroelectric power –<br />
an economically viable renewable<br />
energy source. It is estimated<br />
that only 10% of the world’s<br />
potential hydroelectric resources<br />
have yet been realized.<br />
Natural gas<br />
World natural gas consumption grew by a relatively weak 2% in<br />
2003 as gas consumption in the USA, the world’s largest market,<br />
contracted by almost 5%. Outside the USA, gas consumption<br />
growth was generally robust, averaging over 4%.<br />
Sales of liquefied natural gas (LNG) grew especially fast last year,<br />
rising by over 12%. US LNG imports more than doubled on the back<br />
of new supplies from Trinidad & Tobago and as high gas prices drew<br />
in spot cargoes. LNG sales to Japan and South Korea, the world’s<br />
largest LNG markets, were up by over 9%.<br />
For the second year running, North America was the only region to<br />
see a decline in gas production, as lower Canadian output was only<br />
partially offset by small gains in the USA and Mexico. The recovery in<br />
Russian gas output that began in 2002 gathered pace last year, as<br />
production expanded by over 4%. Within Europe, Norwegian output<br />
continued to grow strongly, up 12% over the year. Production in the<br />
rest of Europe fell for the second year running, mainly as a result of<br />
declines in the UK, Italy and the Netherlands.<br />
Other fuels<br />
World coal consumption increased by 6.9% in 2003. As in 2002, the<br />
result was heavily influenced by the big gain (over 15%) in reported<br />
Chinese coal use. However, coal demand was also strong in other<br />
parts of the world. North American coal consumption rose by 2.5%<br />
to a new record high. Coal use also rose strongly in Europe & Eurasia<br />
by 4.4% and in Asia Pacific (excluding China) by 3.5%.<br />
Nuclear power generation contracted by 2% globally in 2003 as<br />
Japan, the world’s third largest nuclear producer, suffered a steep<br />
27% drop in generation. US nuclear output also decreased: by 2%.<br />
Only two new reactors were brought online globally in 2003, the<br />
lowest number for over 35 years. Hydroelectric generation increased<br />
by a modest 0.4% in 2003 as gains in Latin America and Asia Pacific<br />
outweighed a large weather-driven fall in Europe and a smaller<br />
decline in North America.<br />
Acknowledgements<br />
We express our gratitude to our numerous contacts worldwide who<br />
provide the basic data for this publication.<br />
3
Oil<br />
At end 1983 At end 1993 At end 2002 At end 2003<br />
Thousand Thousand Thousand Thousand Thousand<br />
Proved reserves<br />
million million million million million Share R/P<br />
barrels barrels barrels tonnes barrels of total ratio<br />
USA 35.6 30.2 30.7 4.2 30.7 2.7% 11.3<br />
Canada 9.6 10.0 17.6 2.3 16.9 1.5% 15.5<br />
Mexico 49.9 50.8 17.2 2.3 16.0 1.4% 11.6<br />
Total North America 95.2 91.0 65.5 8.8 63.6 5.5% 12.2<br />
Argentina 2.4 2.0 2.8 0.4 3.2 0.3% 11.0<br />
Brazil 2.1 5.0 9.8 1.5 10.6 0.9% 18.7<br />
Colombia 0.6 3.2 1.8 0.2 1.5 0.1% 7.3<br />
Ecuador 0.9 2.3 4.6 0.6 4.6 0.4% 29.6<br />
Peru 0.7 0.8 1.0 0.1 1.0 0.1% 28.4<br />
Trinidad & Tobago 0.5 0.6 1.9 0.3 1.9 0.2% 31.1<br />
Venezuela 25.9 64.4 77.2 11.2 78.0 6.8% 71.5<br />
Other S. & Cent. America 0.5 0.9 1.5 0.2 1.5 0.1% 24.8<br />
Total S. & Cent. America 33.7 79.1 100.5 14.6 102.2 8.9% 41.5<br />
Azerbaijan n/a n/a 7.0 1.0 7.0 0.6% 61.2<br />
Denmark 0.3 0.7 1.3 0.2 1.3 0.1% 9.5<br />
Italy 0.6 0.6 0.7 0.1 0.7 0.1% 19.0<br />
Kazakhstan n/a n/a 9.0 1.2 9.0 0.8% 22.3<br />
Norway 3.8 9.5 10.4 1.4 10.1 0.9% 8.5<br />
Romania 1.6 1.0 1.1 0.1 0.9 0.1% 20.6<br />
Russian Federation n/a n/a 67.0 9.5 69.1 6.0% 22.2<br />
Turkmenistan n/a n/a 0.5 0.1 0.5<br />
◆<br />
7.1<br />
United Kingdom 6.9 4.5 4.5 0.6 4.5 0.4% 5.4<br />
Uzbekistan n/a n/a 0.6 0.1 0.6 0.1% 9.8<br />
Other Europe & Eurasia 86.8 64.1 2.1 0.3 2.1 0.2% 11.9<br />
Total Europe & Eurasia 100.1 80.4 104.3 14.5 105.9 9.2% 17.1<br />
Iran 55.3 92.9 130.7 18.0 130.7 11.4% 92.9<br />
Iraq 65.0 100.0 115.0 15.5 115.0 10.0% *<br />
Kuwait 67.0 96.5 96.5 13.3 96.5 8.4% *<br />
Oman 3.5 5.0 5.7 0.8 5.6 0.5% 18.5<br />
Qatar 3.3 3.1 15.2 2.0 15.2 1.3% 45.5<br />
Saudi Arabia 168.8 261.4 262.8 36.1 262.7 22.9% 73.3<br />
Syria 1.5 3.0 2.3 0.3 2.3 0.2% 10.5<br />
United Arab Emirates 32.3 98.1 97.8 13.0 97.8 8.5% *<br />
Yemen – 0.1 0.7 0.1 0.7 0.1% 4.2<br />
Other Middle East 0.2 0.1 0.1 † 0.1<br />
◆<br />
6.1<br />
Total Middle East 396.9 660.1 726.8 99.0 726.6 63.3% 88.1<br />
Algeria 9.2 9.2 11.3 1.4 11.3 1.0% 16.7<br />
Angola 1.7 1.9 8.9 1.2 8.9 0.8% 27.5<br />
Cameroon 0.4 0.3 0.2 † 0.2<br />
◆<br />
9.0<br />
Rep. of Congo (Brazzaville) 0.7 0.7 1.5 0.2 1.5 0.1% 17.1<br />
Egypt 4.0 3.4 3.5 0.5 3.6 0.3% 13.2<br />
Gabon 0.5 0.7 2.4 0.3 2.4 0.2% 27.0<br />
Libya 21.8 22.8 36.0 4.7 36.0 3.1% 66.3<br />
Nigeria 16.6 21.0 34.3 4.6 34.3 3.0% 43.1<br />
Sudan 0.3 0.3 0.7 0.1 0.7 0.1% 7.5<br />
Tunisia 2.5 0.4 0.5 0.1 0.5<br />
◆<br />
20.8<br />
Other Africa 0.5 0.3 2.3 0.3 2.3 0.2% 17.5<br />
Total Africa 58.2 60.9 101.7 13.5 101.8 8.9% 33.2<br />
Australia 1.9 3.3 3.7 0.6 4.4 0.4% 19.3<br />
Brunei 1.5 1.3 1.1 0.1 1.1 0.1% 14.1<br />
China 18.2 29.5 23.7 3.2 23.7 2.1% 19.1<br />
India 3.6 5.9 5.6 0.7 5.6 0.5% 19.3<br />
Indonesia 10.1 5.2 4.7 0.6 4.4 0.4% 10.3<br />
Malaysia 2.6 5.0 4.2 0.5 4.0 0.3% 12.5<br />
Papua New Guinea – 0.5 0.4 0.1 0.4<br />
◆<br />
22.5<br />
Thailand † 0.2 0.7 0.1 0.7 0.1% 8.7<br />
Vietnam – 0.6 2.5 0.3 2.5 0.2% 18.4<br />
Other Asia Pacific 1.1 0.7 0.9 0.1 0.9 0.1% 15.4<br />
Total Asia Pacific 39.0 52.0 47.5 6.4 47.7 4.2% 16.6<br />
TOTAL WORLD 723.0 1023.6 1146.3 156.7 1147.7 100.0% 41.0<br />
of which: OECD 110.3 111.0 87.3 11.7 85.8 7.5% 11.1<br />
OPEC 475.3 774.5 881.6 120.4 882.0 76.9% 79.5<br />
Non-OPEC‡ 162.9 186.5 179.9 24.4 178.8 15.6% 13.6<br />
Former Soviet Union 84.8 62.6 84.8 11.9 86.9 7.6% 22.7<br />
*Over 100 years.<br />
†Less than 0.05.<br />
◆ Less than 0.05%.<br />
‡Excludes Former Soviet Union.<br />
n/a not available.<br />
Notes:<br />
Proved reserves of oil – Generally taken to be those quantities that geological and engineering information indicates with reasonable certainty can be recovered in the future from<br />
known reservoirs under existing economic and operating conditions.<br />
Reserves-to-production (R/P) ratio – If the reserves remaining at the end of the year are divided by the production in that year, the result is the length of time that those remaining<br />
reserves would last if production were to continue at that level.<br />
Source of data – The estimates in this table have been compiled using a combination of primary official sources, third-party data from the OPEC Secretariat, World Oil, Oil & Gas<br />
Journal and an independent estimate of Russian reserves based on information in the public domain. The reserves figures shown do not necessarily meet the United States<br />
Securities and Exchange Commission definitions and guidelines for determining proved reserves nor necessarily represent <strong>BP</strong>’s view of proved reserves by country. The figure for<br />
Canadian oil reserves includes an official estimate of Canadian oil sands 'under active development'. Oil includes gas condensate and natural gas liquids as well as crude oil.<br />
For the purposes of this table, shares of total are calculated using thousand million barrels figures.<br />
4 <strong>BP</strong> 2004 Statistical Review of World Energy
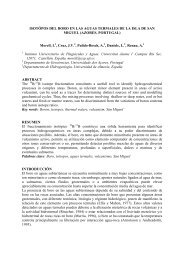
Proved reserves at end 2003<br />
Thousand million barrels<br />
Middle East<br />
726.6<br />
Asia Pacific<br />
47.7<br />
North America<br />
63.6<br />
Africa<br />
101.8<br />
S. & Cent. America<br />
102.2<br />
Europe & Eurasia<br />
105.9<br />
Distribution of proved reserves 2003<br />
Percentage<br />
Proved reserves<br />
Thousand million barrels<br />
1200<br />
Asia Pacific<br />
4.2%<br />
North America<br />
5.5%<br />
1000<br />
Africa<br />
8.9%<br />
S. & Cent.<br />
America<br />
8.9%<br />
Middle East<br />
63.3%<br />
800<br />
600<br />
Europe &<br />
Eurasia<br />
9.2%<br />
400<br />
200<br />
0 83 93 03<br />
5
Oil<br />
Change 2003<br />
Production*<br />
2003 over share<br />
Thousand barrels daily 1993 1994 1995 1996 1997 1998 1999 2000 2001 2002 2003 2002 of total<br />
USA 8583 8389 8322 8295 8269 8011 7731 7733 7669 7626 7454 –1.6% 9.2%<br />
Canada 2184 2276 2402 2480 2588 2672 2604 2721 2712 2838 2986 5.9% 3.8%<br />
Mexico 3132 3142 3065 3277 3410 3499 3343 3450 3560 3585 3789 5.8% 5.1%<br />
Total North America 13899 13807 13789 14052 14267 14182 13678 13904 13941 14049 14229 1.9% 18.2%<br />
Argentina 630 695 758 823 877 890 847 819 829 808 793 –1.9% 1.1%<br />
Brazil 664 693 718 807 868 1003 1133 1268 1337 1499 1552 3.3% 2.1%<br />
Colombia 458 460 591 635 667 775 838 711 627 601 564 –6.2% 0.8%<br />
Ecuador 353 388 395 393 397 384 382 409 416 410 427 4.2% 0.6%<br />
Peru 127 128 123 121 120 119 110 104 98 98 92 –6.2% 0.1%<br />
Trinidad & Tobago 134 141 142 141 135 134 141 138 135 155 163 4.4% 0.2%<br />
Venezuela 2592 2752 2959 3137 3321 3510 3248 3321 3233 3218 2987 –7.2% 4.2%<br />
Other S. & Cent. America 83 90 96 102 108 125 122 129 138 153 163 6.8% 0.2%<br />
Total S. & Cent. America 5040 5347 5782 6159 6493 6940 6822 6899 6813 6942 6741 –3.1% 9.2%<br />
Azerbaijan 209 193 185 183 185 230 278 281 300 311 313 0.6% 0.4%<br />
Denmark 170 187 188 207 233 235 301 364 347 372 368 –1.3% 0.5%<br />
Italy 89 94 101 104 114 108 96 88 79 106 107 0.7% 0.2%<br />
Kazakhstan 490 430 434 474 536 537 631 744 836 1018 1106 8.4% 1.4%<br />
Norway 2377 2693 2903 3233 3280 3139 3139 3343 3416 3329 3260 –2.7% 4.1%<br />
Romania 144 145 145 142 141 137 133 131 130 127 123 –2.9% 0.2%<br />
Russian Federation 7173 6419 6288 6114 6227 6169 6178 6536 7056 7698 8543 11.0% 11.4%<br />
Turkmenistan 92 87 84 90 108 129 143 144 162 182 210 15.6% 0.3%<br />
United Kingdom 2119 2675 2749 2735 2702 2793 2893 2657 2476 2463 2245 –8.9% 2.9%<br />
Uzbekistan 94 124 172 174 182 191 191 177 171 171 166 –0.9% 0.2%<br />
Other Europe & Eurasia 601 609 576 548 526 507 475 466 467 483 487 1.2% 0.6%<br />
Total Europe & Eurasia 13557 13656 13825 14004 14233 14175 14458 14932 15441 16259 16927 4.1% 22.1%<br />
Iran 3712 3730 3744 3759 3776 3855 3603 3818 3734 3420 3852 12.6% 5.1%<br />
Iraq 455 505 530 580 1166 2126 2541 2583 2371 2030 1344 –33.9% 1.8%<br />
Kuwait 1945 2085 2130 2129 2137 2176 2000 2105 2069 1871 2238 20.0% 3.0%<br />
Oman 785 819 868 897 909 905 911 959 961 900 823 –8.6% 1.1%<br />
Qatar 460 451 461 568 719 747 797 855 854 783 917 17.3% 1.1%<br />
Saudi Arabia 8962 9023 9032 9180 9361 9370 8694 9297 8992 8664 9817 13.8% 12.8%<br />
Syria 566 563 596 586 577 576 579 550 583 572 594 3.9% 0.8%<br />
United Arab Emirates 2443 2482 2410 2479 2493 2558 2302 2499 2430 2159 2520 17.3% 3.2%<br />
Yemen 209 346 351 357 375 380 405 450 471 462 454 –1.9% 0.6%<br />
Other Middle East 53 52 52 50 50 49 48 48 48 48 48 – 0.1%<br />
Total Middle East 19591 20057 20175 20584 21564 22742 21880 23163 22512 20909 22607 8.3% 29.6%<br />
Algeria 1329 1324 1327 1386 1421 1461 1515 1578 1562 1681 1857 11.4% 2.1%<br />
Angola 504 557 633 716 741 731 745 746 742 905 885 –2.2% 1.2%<br />
Cameroon 130 115 106 110 124 105 95 88 80 72 68 –5.5% 0.1%<br />
Chad – – – – – – – – – – 40 >100% 0.1%<br />
Rep. of Congo (Brazzaville) 185 185 180 200 225 264 293 275 271 259 243 –6.2% 0.3%<br />
Egypt 941 921 924 894 873 857 827 781 758 753 750 –0.5% 1.0%<br />
Equatorial Guinea 5 5 7 17 60 83 100 113 181 237 249 5.0% 0.3%<br />
Gabon 305 337 356 365 364 337 340 327 301 295 240 –18.5% 0.3%<br />
Libya 1402 1431 1439 1452 1489 1480 1425 1475 1425 1376 1488 8.2% 1.9%<br />
Nigeria 1985 1988 1998 2138 2303 2163 2028 2104 2199 2013 2185 8.6% 2.9%<br />
Sudan 2 2 2 5 9 12 63 174 211 233 255 9.4% 0.3%<br />
Tunisia 99 93 90 89 81 83 84 78 71 73 66 –9.2% 0.1%<br />
Other Africa 36 42 51 62 64 63 56 61 64 65 74 14.6% 0.1%<br />
Total Africa 6922 7001 7112 7434 7754 7638 7571 7800 7866 7962 8401 5.5% 10.8%<br />
Australia 572 614 583 619 669 644 625 809 733 731 624 –15.6% 0.7%<br />
Brunei 175 179 175 165 163 157 182 193 203 210 214 2.1% 0.3%<br />
China 2888 2930 2989 3170 3211 3212 3213 3252 3306 3346 3396 1.5% 4.6%<br />
India 620 708 804 778 800 791 788 780 780 794 793 –0.1% 1.0%<br />
Indonesia 1588 1589 1578 1580 1557 1520 1408 1456 1389 1288 1179 –8.6% 1.6%<br />
Malaysia 662 674 724 736 764 815 791 791 786 828 875 5.5% 1.0%<br />
Thailand 87 87 87 97 116 121 132 164 174 191 217 15.7% 0.2%<br />
Vietnam 128 144 155 179 205 245 296 328 350 354 372 4.0% 0.5%<br />
Other Asia Pacific 277 259 231 246 228 218 219 198 194 200 203 1.3% 0.3%<br />
Total Asia Pacific 6997 7184 7325 7571 7713 7724 7654 7971 7914 7943 7872 –1.0% 10.2%<br />
TOTAL WORLD 66006 67052 68008 69803 72024 73400 72063 74669 74487 74065 76777 3.8% 100.0%<br />
of which: OECD 19672 20528 20737 21356 21665 21477 21082 21504 21330 21402 21185 –0.7% 27.0%<br />
OPEC 26874 27360 27607 28387 29743 30965 29561 31090 30258 28503 30383 6.6% 39.7%<br />
Non-OPEC‡ 30937 32300 33103 34245 34904 35044 34951 35565 35570 36049 35917 –0.2% 46.4%<br />
Former Soviet Union 8196 7391 7297 7171 7377 7391 7551 8013 8659 9513 10477 10.2% 13.9%<br />
*Includes crude oil, shale oil, oil sands and NGLs (natural gas liquids – the liquid content of natural gas where this is recovered separately).<br />
Excludes liquid fuels from other sources such as coal derivatives.<br />
‡Excludes Former Soviet Union.<br />
Notes: Annual changes and shares of total are calculated using million tonnes per annum figures rather than thousand barrels daily.<br />
Because of rounding some totals may not agree exactly with the sum of their component parts.<br />
6 <strong>BP</strong> 2004 Statistical Review of World Energy
Change 2003<br />
Production*<br />
2003 over share<br />
Million tonnes 1993 1994 1995 1996 1997 1998 1999 2000 2001 2002 2003 2002 of total<br />
USA 397.0 387.5 383.6 382.1 380.0 368.1 352.6 352.6 349.2 346.9 341.1 –1.6% 9.2%<br />
Canada 102.0 106.4 111.9 115.5 120.7 125.1 121.0 126.9 127.5 134.0 141.9 5.9% 3.8%<br />
Mexico 153.8 154.4 150.5 162.6 169.7 173.5 165.2 171.2 176.6 178.4 188.8 5.8% 5.1%<br />
Total North America 652.9 648.3 646.0 660.1 670.4 666.7 638.8 650.8 653.3 659.2 671.8 1.9% 18.2%<br />
Argentina 31.1 34.5 37.5 40.8 43.4 44.0 41.8 40.4 40.8 39.7 39.0 –1.9% 1.1%<br />
Brazil 32.9 34.3 35.5 40.2 43.1 49.8 56.3 63.2 66.3 74.4 76.8 3.3% 2.1%<br />
Colombia 22.9 23.0 29.5 31.8 33.2 38.5 41.6 35.3 31.0 29.7 27.9 –6.2% 0.8%<br />
Ecuador 17.9 19.7 20.1 20.0 20.2 19.5 19.4 20.9 21.2 20.8 21.7 4.2% 0.6%<br />
Peru 6.3 6.3 6.1 6.0 5.9 5.8 5.4 5.1 4.8 4.8 4.5 –6.2% 0.1%<br />
Trinidad & Tobago 6.8 7.1 7.0 7.0 6.7 6.7 7.0 6.8 6.5 7.5 7.9 4.4% 0.2%<br />
Venezuela 134.0 142.0 152.4 162.2 171.4 181.0 167.0 171.6 166.4 165.4 153.4 –7.2% 4.2%<br />
Other S. & Cent. America 3.9 4.3 4.6 5.0 5.3 6.2 6.2 6.6 7.0 7.8 8.4 6.8% 0.2%<br />
Total S. & Cent. America 255.7 271.2 292.8 312.9 329.1 351.5 344.6 349.8 344.1 350.2 339.5 –3.1% 9.2%<br />
Azerbaijan 10.3 9.6 9.2 9.1 9.2 11.4 13.8 14.0 14.9 15.4 15.5 0.6% 0.4%<br />
Denmark 8.3 9.1 9.2 10.1 11.4 11.4 14.7 17.8 16.9 18.1 17.9 –1.3% 0.5%<br />
Italy 4.6 4.9 5.2 5.5 6.0 5.6 5.0 4.6 4.1 5.5 5.6 0.7% 0.2%<br />
Kazakhstan 23.0 20.3 20.6 23.0 25.8 25.9 30.1 35.3 40.1 48.2 52.2 8.4% 1.4%<br />
Norway 114.2 128.6 138.4 154.8 156.3 149.7 149.7 160.1 162.1 157.3 153.0 –2.7% 4.1%<br />
Romania 6.9 7.0 7.0 6.9 6.8 6.6 6.4 6.3 6.2 6.1 5.9 –2.9% 0.2%<br />
Russian Federation 354.9 317.6 310.8 302.9 307.4 304.3 304.8 323.3 348.1 379.6 421.4 11.0% 11.4%<br />
Turkmenistan 4.4 4.2 4.1 4.4 5.4 6.4 7.1 7.2 8.0 9.0 10.4 15.6% 0.3%<br />
United Kingdom 100.2 126.5 129.9 129.7 127.9 132.1 136.8 125.9 116.7 115.9 105.6 –8.9% 2.9%<br />
Uzbekistan 4.0 5.5 7.6 7.6 7.9 8.2 8.1 7.5 7.2 7.2 7.1 –0.9% 0.2%<br />
Other Europe & Eurasia 29.0 29.4 27.7 26.3 25.2 24.3 22.7 22.4 22.3 23.1 23.4 1.2% 0.6%<br />
Total Europe & Eurasia 659.8 662.7 669.6 680.2 689.0 686.0 699.2 724.4 746.6 785.5 818.0 4.1% 22.1%<br />
Iran 184.3 185.0 185.5 186.6 187.0 190.8 178.1 189.4 184.6 168.8 190.1 12.6% 5.1%<br />
Iraq 22.3 24.8 26.0 28.6 57.1 104.4 124.9 127.3 116.5 99.7 65.9 –33.9% 1.8%<br />
Kuwait 96.6 103.4 104.9 105.1 105.1 107.2 98.3 104.0 101.9 91.8 110.2 20.0% 3.0%<br />
Oman 38.8 40.5 42.8 44.4 44.9 44.7 45.0 47.6 47.5 44.5 40.7 –8.6% 1.1%<br />
Qatar 21.1 20.6 21.1 26.2 33.3 34.3 36.0 38.7 38.4 35.1 41.2 17.3% 1.1%<br />
Saudi Arabia 432.8 435.3 435.4 443.5 451.3 452.0 419.1 450.6 434.1 417.3 474.8 13.8% 12.8%<br />
Syria 28.1 28.0 29.6 29.2 28.7 28.6 28.8 27.4 29.0 28.4 29.5 3.9% 0.8%<br />
United Arab Emirates 114.8 116.6 114.0 117.1 117.1 119.9 107.7 117.3 113.5 100.4 117.8 17.3% 3.2%<br />
Yemen 9.9 16.4 16.7 16.9 17.7 18.0 19.2 21.3 22.3 21.8 21.4 –1.9% 0.6%<br />
Other Middle East 2.5 2.4 2.4 2.3 2.3 2.3 2.2 2.2 2.2 2.2 2.2 – 0.1%<br />
Total Middle East 951.1 972.8 978.3 999.9 1044.5 1102.3 1059.2 1125.8 1090.0 1010.1 1093.7 8.3% 29.6%<br />
Algeria 56.7 56.4 56.6 59.3 60.3 61.8 63.9 66.8 65.8 70.9 79.0 11.4% 2.1%<br />
Angola 24.8 27.4 31.2 35.4 36.5 36.0 36.7 36.9 36.6 44.6 43.6 –2.2% 1.2%<br />
Cameroon 6.6 5.8 5.4 5.6 6.3 5.3 4.8 4.5 4.1 3.7 3.5 –5.5% 0.1%<br />
Chad – – – – – – – – – – 2.1 >100% 0.1%<br />
Rep. of Congo (Brazzaville) 9.5 9.6 9.3 10.4 11.6 13.6 15.1 14.2 14.0 13.4 12.5 –6.2% 0.3%<br />
Egypt 47.5 46.5 46.6 45.1 43.8 43.0 41.4 38.8 37.3 37.0 36.8 –0.5% 1.0%<br />
Equatorial Guinea 0.2 0.2 0.3 0.9 3.0 4.1 5.0 5.6 9.0 11.7 12.3 5.0% 0.3%<br />
Gabon 15.2 16.8 17.8 18.3 18.2 16.9 17.0 16.4 15.0 14.7 12.0 –18.5% 0.3%<br />
Libya 66.1 67.5 67.9 68.6 70.0 69.6 67.0 69.5 67.0 64.7 70.0 8.2% 1.9%<br />
Nigeria 97.1 97.0 97.5 104.7 112.7 105.9 99.2 103.3 107.8 98.6 107.2 8.6% 2.9%<br />
Sudan 0.1 0.1 0.1 0.2 0.4 0.6 3.1 8.6 10.4 11.5 12.6 9.4% 0.3%<br />
Tunisia 4.7 4.4 4.3 4.2 3.8 3.9 4.0 3.7 3.4 3.4 3.1 –9.2% 0.1%<br />
Other Africa 1.7 2.0 2.5 3.0 3.1 3.0 2.7 3.0 3.1 3.1 3.6 14.6% 0.1%<br />
Total Africa 330.4 333.8 339.3 355.7 369.8 363.6 359.8 371.2 373.2 377.3 398.3 5.5% 10.8%<br />
Australia 25.1 27.0 25.4 26.9 28.8 27.4 26.7 35.3 31.8 31.6 26.6 –15.6% 0.7%<br />
Brunei 8.5 8.7 8.5 8.0 7.9 7.6 8.9 9.4 9.9 10.2 10.5 2.1% 0.3%<br />
China 144.0 146.1 149.0 158.5 160.1 160.2 160.2 162.6 164.8 166.9 169.3 1.5% 4.6%<br />
India 29.0 33.3 37.8 36.3 37.3 36.7 36.5 36.1 36.0 36.8 36.7 –0.1% 1.0%<br />
Indonesia 76.9 76.9 76.5 76.7 75.7 74.2 68.6 71.5 68.0 63.0 57.5 –8.6% 1.6%<br />
Malaysia 31.1 31.7 34.0 34.4 35.1 36.9 35.6 35.5 35.0 36.7 38.8 5.5% 1.0%<br />
Thailand 3.4 3.5 3.4 3.8 4.5 4.7 5.2 6.6 7.0 7.8 9.0 15.7% 0.2%<br />
Vietnam 6.3 7.1 7.7 8.9 10.1 12.1 14.6 16.2 17.1 17.3 18.0 4.0% 0.5%<br />
Other Asia Pacific 13.0 12.1 10.8 11.5 10.6 10.2 10.2 9.3 9.1 9.3 9.4 1.3% 0.3%<br />
Total Asia Pacific 337.2 346.3 352.9 365.1 370.1 370.0 366.4 382.6 378.6 379.5 375.8 –1.0% 10.2%<br />
TOTAL WORLD 3187.0 3235.0 3278.9 3373.9 3472.9 3540.0 3468.0 3604.4 3585.7 3561.7 3697.0 3.8% 100.0%<br />
of which: OECD 926.7 966.5 974.6 1006.7 1019.7 1011.0 988.4 1010.8 1001.0 1004.5 997.5 –0.7% 27.0%<br />
OPEC 1302.6 1325.4 1337.7 1378.7 1441.1 1501.0 1429.8 1510.0 1463.9 1375.7 1466.9 6.6% 39.7%<br />
Non-OPEC‡ 1481.3 1545.9 1582.8 1641.9 1669.8 1676.5 1668.3 1701.1 1697.4 1720.5 1717.0 –0.2% 46.4%<br />
Former Soviet Union 403.2 363.7 358.4 353.3 362.0 362.5 369.9 393.3 424.5 465.6 513.1 10.2% 13.9%<br />
*Includes crude oil, shale oil, oil sands and NGLs (natural gas liquids – the liquid content of natural gas where this is recovered separately).<br />
Excludes liquid fuels from other sources such as coal derivatives.<br />
‡Excludes Former Soviet Union.<br />
Note: Because of rounding some totals may not agree exactly with the sum of their component parts.<br />
7
Oil<br />
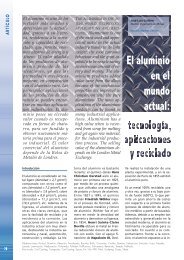
Production by area<br />
Million barrels daily<br />
80<br />
70<br />
60<br />
50<br />
40<br />
30<br />
20<br />
10<br />
0 78 79 80 81 82 83 84 85 86 87 88 89 90 91 92 93 94 95 96 97 98 99 00 01 02 03<br />
North America S. & Cent. America Europe & Eurasia Middle East Africa Asia Pacific<br />
Oil production rose sharply in 2003, despite supply disruptions in Venezuela and Iraq, as the rest of OPEC increased production by almost 12%.<br />
Reserves-to-production (R/P) ratios<br />
World<br />
50<br />
2003 by area<br />
100<br />
40<br />
80<br />
30<br />
60<br />
20<br />
40<br />
10<br />
20<br />
0 81 83 85 87 89 91 93 95 97 99 01 03<br />
0<br />
World<br />
North America<br />
S. & Cent. America Europe & Eurasia Middle East Africa Asia Pacific<br />
The world’s oil reserves-to-production ratio was 41 years in 2003, down around 6% from the peak of 43.7 years in 1989. Both proved reserves and production have<br />
increased since 1989: by 12.5% and 20% respectively.<br />
8 <strong>BP</strong> 2004 Statistical Review of World Energy
Change 2003<br />
Consumption*<br />
2003 over share<br />
Thousand barrels daily 1993 1994 1995 1996 1997 1998 1999 2000 2001 2002 2003 2002 of total<br />
USA 17236 17719 17725 18309 18621 18917 19519 19701 19649 19761 20071 1.9% 25.1%<br />
Canada 1712 1742 1776 1818 1888 1913 1926 1937 2023 2068 2149 4.5% 2.6%<br />
Mexico 1638 1772 1650 1697 1768 1844 1842 1911 1897 1835 1864 1.5% 2.3%<br />
Total North America 20586 21232 21151 21824 22276 22675 23287 23549 23569 23663 24083 2.1% 30.1%<br />
Argentina 418 416 415 432 451 467 445 431 404 364 371 2.4% 0.5%<br />
Brazil 1354 1418 1498 1601 1729 1800 1879 1855 1896 1853 1817 –1.7% 2.3%<br />
Chile 174 190 209 228 242 247 251 238 232 231 227 –1.6% 0.3%<br />
Colombia 238 246 260 268 272 266 238 232 245 222 222 –0.1% 0.3%<br />
Ecuador 106 115 112 125 142 145 131 129 132 131 134 2.6% 0.2%<br />
Peru 123 134 150 155 154 155 159 155 148 148 151 6.4% 0.2%<br />
Venezuela 430 436 446 426 452 475 474 496 545 594 526 –11.5% 0.7%<br />
Other S. & Cent. America 963 1022 1044 1065 1098 1128 1129 1125 1138 1151 1176 2.1% 1.6%<br />
Total S. & Cent. America 3804 3977 4136 4300 4539 4683 4705 4661 4739 4692 4624 –1.2% 6.0%<br />
Austria 237 235 234 242 246 255 250 244 265 271 296 9.3% 0.4%<br />
Azerbaijan 165 163 171 140 120 151 149 124 74 73 89 22.7% 0.1%<br />
Belarus 281 257 247 186 193 167 141 132 118 104 123 17.3% 0.2%<br />
Belgium & Luxembourg 546 556 546 606 629 656 670 702 669 691 715 3.7% 1.0%<br />
Bulgaria 127 118 115 114 92 100 93 84 87 90 92 3.0% 0.1%<br />
Czech Republic 142 149 169 177 170 174 174 169 178 174 183 4.7% 0.2%<br />
Denmark 196 209 217 235 229 223 222 215 205 200 194 –3.1% 0.3%<br />
Finland 206 216 208 216 213 221 224 224 222 226 239 4.4% 0.3%<br />
France 1940 1878 1893 1930 1948 2016 2044 2007 2023 1967 1991 1.5% 2.6%<br />
Germany 2904 2880 2882 2921 2913 2915 2824 2763 2804 2714 2664 –1.8% 3.4%<br />
Greece 342 346 361 372 379 374 383 406 408 410 428 4.0% 0.6%<br />
Hungary 162 169 159 148 150 157 151 145 142 140 136 –2.4% 0.2%<br />
Iceland 15 15 16 16 18 18 18 19 18 19 18 –1.0%<br />
◆<br />
Republic of Ireland 106 116 118 124 136 152 172 170 185 182 176 –3.9% 0.2%<br />
Italy 1924 1920 1987 1956 1969 1974 1980 1956 1946 1943 1927 –0.9% 2.5%<br />
Kazakhstan 315 247 242 204 207 171 141 148 179 200 191 –4.7% 0.3%<br />
Lithuania 78 72 64 66 66 76 63 49 56 53 53 0.5% 0.1%<br />
Netherlands 788 792 828 810 856 854 880 899 948 951 969 1.6% 1.2%<br />
Norway 210 212 212 218 223 215 216 201 213 208 212 1.5% 0.3%<br />
Poland 296 314 321 368 391 424 431 427 415 420 443 5.9% 0.6%<br />
Portugal 252 253 272 259 293 322 330 324 327 338 346 2.4% 0.5%<br />
Romania 242 226 274 260 276 242 195 203 217 226 232 3.0% 0.3%<br />
Russian Federation 3788 3267 2934 2606 2593 2484 2534 2474 2456 2480 2503 0.9% 3.4%<br />
Slovakia 67 70 69 71 72 80 73 73 68 76 79 4.6% 0.1%<br />
Spain 1079 1120 1177 1221 1290 1381 1423 1452 1508 1526 1559 2.4% 2.1%<br />
Sweden 335 354 338 362 336 338 337 318 318 317 328 4.2% 0.4%<br />
Switzerland 264 272 253 261 276 279 271 263 281 267 259 –2.7% 0.3%<br />
Turkey 574 553 610 635 646 640 638 695 665 676 687 2.0% 0.9%<br />
Turkmenistan 64 74 78 60 60 56 56 62 78 80 74 –7.5% 0.1%<br />
Ukraine 498 398 380 284 277 287 255 240 255 249 262 5.4% 0.4%<br />
United Kingdom 1791 1777 1757 1798 1752 1750 1735 1697 1688 1697 1666 –1.8% 2.1%<br />
Uzbekistan 163 145 134 148 135 141 145 136 141 137 131 –4.4% 0.2%<br />
Other Europe & Eurasia 447 389 383 409 450 446 439 434 451 466 486 4.2% 0.6%<br />
Total Europe & Eurasia 20545 19764 19647 19424 19603 19736 19657 19453 19609 19571 19751 1.0% 25.9%<br />
Iran 1044 1099 1204 1248 1221 1160 1192 1158 1127 1115 1132 1.5% 1.5%<br />
Kuwait 102 124 130 126 139 180 202 202 206 222 266 19.8% 0.4%<br />
Qatar 17 19 21 23 25 26 24 25 30 44 37 –14.1%<br />
◆<br />
Saudi Arabia 1116 1160 1123 1163 1199 1267 1306 1333 1347 1363 1437 5.6% 1.8%<br />
United Arab Emirates 335 353 349 346 345 282 266 243 273 284 296 4.2% 0.4%<br />
Other Middle East 1090 1135 1202 1207 1261 1292 1314 1356 1389 1418 1312 –7.6% 1.7%<br />
Total Middle East 3704 3891 4028 4112 4189 4207 4304 4317 4372 4446 4480 0.8% 5.9%<br />
Algeria 210 204 198 187 187 194 187 192 200 222 229 2.7% 0.3%<br />
Egypt 438 437 474 501 531 559 573 564 548 534 550 2.7% 0.7%<br />
South Africa 383 401 427 437 445 451 462 475 488 501 513 2.5% 0.7%<br />
Other Africa 1042 1088 1098 1116 1144 1179 1214 1216 1240 1258 1281 1.8% 1.7%<br />
Total Africa 2074 2130 2198 2240 2307 2383 2437 2447 2476 2515 2573 2.2% 3.3%<br />
Australia 720 753 781 794 823 825 843 837 845 846 845 0.3% 1.0%<br />
Bangladesh 43 45 59 60 69 76 68 66 79 83 87 5.0% 0.1%<br />
China 2913 3145 3390 3672 3935 4047 4416 4985 5030 5379 5982 11.5% 7.6%<br />
China Hong Kong SAR 174 185 198 194 192 184 193 201 243 268 271 1.4% 0.4%<br />
India 1313 1413 1580 1700 1828 1963 2134 2254 2284 2374 2426 1.9% 3.1%<br />
Indonesia 782 774 820 888 963 914 980 1049 1088 1115 1131 1.5% 1.5%<br />
Japan 5441 5746 5784 5813 5762 5525 5618 5577 5435 5359 5451 2.1% 6.8%<br />
Malaysia 330 372 381 405 431 407 439 441 448 489 519 6.4% 0.7%<br />
New Zealand 112 121 125 127 131 131 134 135 139 142 149 5.0% 0.2%<br />
Pakistan 272 291 315 329 339 350 363 373 366 359 342 –5.1% 0.5%<br />
Philippines 290 306 344 360 389 392 375 348 347 332 332 –0.1% 0.4%<br />
Singapore 516 590 617 586 630 651 619 654 716 699 672 –3.9% 0.9%<br />
South Korea 1675 1840 2009 2144 2373 2030 2178 2229 2235 2282 2303 1.0% 2.9%<br />
Taiwan 620 665 713 717 741 766 820 816 819 843 880 4.2% 1.1%<br />
Thailand 556 617 717 776 785 736 734 725 701 766 812 6.2% 1.1%<br />
Other Asia Pacific 217 222 245 281 298 324 331 366 386 408 399 –2.5% 0.5%<br />
Total Asia Pacific 15974 17083 18077 18842 19685 19320 20246 21056 21161 21743 22601 4.0% 28.8%<br />
TOTAL WORLD 66687 68077 69235 70742 72599 73004 74637 75483 75926 76631 78112 2.1% 100.0%<br />
of which: European Union 15 12646 12654 12817 13051 13189 13429 13474 13376 13516 13434 13496 0.5% 17.6%<br />
OECD 42912 44099 44475 45647 46499 46603 47507 47693 47719 47707 48347 1.6% 61.2%<br />
Former Soviet Union 5536 4744 4357 3779 3751 3638 3581 3459 3449 3470 3525 1.6% 4.8%<br />
Other EMEs 18239 19234 20403 21316 22350 22764 23549 24331 24759 25454 26240 3.1% 34.0%<br />
*Inland demand plus international aviation and marine bunkers and refinery fuel and loss.<br />
◆ Less than 0.05%.<br />
Notes: Annual changes and shares of total are calculated using million tonnes per annum figures rather than thousand barrels daily.<br />
Differences between these world consumption figures and world production statistics on page 6 are accounted for by stock changes, consumption of non-petroleum additives and<br />
substitute fuels, and unavoidable disparities in the definition, measurement or conversion of oil supply and demand data.<br />
9
Oil<br />
Change 2003<br />
Consumption*<br />
2003 over share<br />
Million tonnes 1993 1994 1995 1996 1997 1998 1999 2000 2001 2002 2003 2002 of total<br />
USA 789.3 809.8 807.7 836.5 848.0 863.8 888.9 897.6 896.1 897.4 914.3 1.9% 25.1%<br />
Canada 77.1 78.4 79.8 82.1 85.2 86.7 87.2 88.1 90.5 92.2 96.4 4.5% 2.6%<br />
Mexico 72.9 79.6 73.3 75.7 79.1 82.9 82.4 85.7 84.9 81.4 82.6 1.5% 2.3%<br />
Total North America 939.3 967.9 960.8 994.3 1012.3 1033.4 1058.5 1071.4 1071.5 1071.0 1093.2 2.1% 30.1%<br />
Argentina 19.6 19.4 19.5 20.4 21.2 22.1 21.0 20.3 19.0 17.1 17.5 2.4% 0.5%<br />
Brazil 62.9 65.7 69.2 74.1 79.9 83.2 85.7 85.8 87.5 85.5 84.1 –1.7% 2.3%<br />
Chile 8.0 8.8 9.7 10.6 11.2 11.4 11.6 10.9 10.6 10.6 10.4 –1.6% 0.3%<br />
Colombia 10.8 11.1 11.8 12.2 12.3 12.0 10.6 10.5 11.1 10.0 10.0 –0.1% 0.3%<br />
Ecuador 4.8 5.2 5.1 5.7 6.5 6.6 6.0 5.8 5.9 5.9 6.1 2.6% 0.2%<br />
Peru 5.9 6.4 7.2 7.4 7.3 7.4 7.5 7.4 7.0 6.9 7.4 6.4% 0.2%<br />
Venezuela 19.4 19.6 20.0 19.0 20.4 21.6 21.3 22.5 24.8 27.0 23.9 –11.5% 0.7%<br />
Other S. & Cent. America 47.3 50.2 51.2 52.4 53.9 55.3 55.2 55.1 55.6 56.2 57.3 2.1% 1.6%<br />
Total S. & Cent. America 178.5 186.4 193.7 201.8 212.7 219.6 219.0 218.2 221.5 219.2 216.6 –1.2% 6.0%<br />
Austria 11.4 11.3 11.3 11.6 11.9 12.3 12.1 11.8 12.8 13.0 14.3 9.3% 0.4%<br />
Azerbaijan 8.2 8.1 8.5 7.0 6.0 7.5 7.4 6.2 3.7 3.6 4.4 22.7% 0.1%<br />
Belarus 14.0 12.8 12.3 9.3 9.6 8.3 7.0 6.6 5.9 5.2 6.1 17.3% 0.2%<br />
Belgium & Luxembourg 26.5 27.0 26.4 29.4 30.3 31.6 32.4 33.9 32.2 33.5 34.8 3.7% 1.0%<br />
Bulgaria 6.2 5.8 5.6 5.5 4.4 4.8 4.5 3.9 4.0 4.2 4.3 3.0% 0.1%<br />
Czech Republic 6.9 7.1 8.0 8.4 8.0 8.3 8.2 7.9 8.3 8.2 8.6 4.7% 0.2%<br />
Denmark 9.5 10.1 10.5 11.4 11.1 10.7 10.6 10.4 9.8 9.6 9.3 –3.1% 0.3%<br />
Finland 9.9 10.4 9.9 10.3 10.2 10.5 10.7 10.7 10.5 10.9 11.4 4.4% 0.3%<br />
France 91.1 88.2 89.0 91.0 91.7 95.0 96.4 94.9 95.5 92.9 94.2 1.5% 2.6%<br />
Germany 136.3 135.1 135.1 137.4 136.5 136.6 132.4 129.8 131.6 127.4 125.1 –1.8% 3.4%<br />
Greece 16.7 16.9 17.6 18.2 18.4 18.2 18.7 19.9 20.0 20.1 20.9 4.0% 0.6%<br />
Hungary 7.7 8.1 7.7 7.1 7.1 7.4 7.1 6.8 6.7 6.4 6.2 –2.4% 0.2%<br />
Iceland 0.7 0.7 0.8 0.8 0.9 0.9 0.9 0.9 0.9 0.9 0.9 –1.0%<br />
◆<br />
Republic of Ireland 5.1 5.6 5.7 6.0 6.6 7.4 8.3 8.2 9.0 8.8 8.4 –3.9% 0.2%<br />
Italy 92.6 92.5 95.5 94.2 94.6 94.7 94.4 93.5 92.8 92.9 92.1 –0.9% 2.5%<br />
Kazakhstan 15.7 12.3 12.0 10.2 10.3 8.5 7.0 7.4 8.9 10.0 9.5 –4.7% 0.3%<br />
Lithuania 3.9 3.6 3.2 3.3 3.3 3.8 3.1 2.4 2.7 2.5 2.5 0.5% 0.1%<br />
Netherlands 36.4 36.4 38.0 37.4 39.5 39.4 40.6 41.7 43.9 43.8 44.5 1.6% 1.2%<br />
Norway 9.5 9.6 9.6 10.1 10.3 10.0 10.1 9.4 9.7 9.4 9.6 1.5% 0.3%<br />
Poland 14.0 14.8 14.9 17.2 18.2 19.9 19.9 20.0 19.2 19.4 20.5 5.9% 0.6%<br />
Portugal 12.0 12.0 13.0 12.2 13.9 15.5 15.9 15.5 15.8 16.2 16.6 2.4% 0.5%<br />
Romania 12.1 11.2 13.5 13.0 13.7 12.0 9.5 10.0 10.6 10.6 11.0 3.0% 0.3%<br />
Russian Federation 188.6 162.7 146.1 130.1 129.1 123.7 126.2 123.5 122.3 123.5 124.7 0.9% 3.4%<br />
Slovakia 3.2 3.3 3.2 3.4 3.4 3.8 3.4 3.4 3.2 3.5 3.7 4.6% 0.1%<br />
Spain 51.3 53.5 56.3 58.7 62.0 66.4 68.4 70.0 72.7 73.8 75.5 2.4% 2.1%<br />
Sweden 16.1 17.0 16.1 17.4 16.1 16.2 16.1 15.2 15.2 15.2 15.8 4.2% 0.4%<br />
Switzerland 12.3 12.7 11.8 12.2 12.8 13.0 12.6 12.2 13.1 12.4 12.1 –2.7% 0.3%<br />
Turkey 27.0 25.8 28.4 29.8 30.0 29.6 29.5 31.6 30.5 31.3 31.9 2.0% 0.9%<br />
Turkmenistan 3.2 3.7 3.9 3.0 3.0 2.8 2.8 3.1 3.9 4.0 3.7 –7.5% 0.1%<br />
Ukraine 24.8 19.8 18.9 14.2 13.8 14.3 12.7 12.0 12.7 12.4 13.1 5.4% 0.4%<br />
United Kingdom 84.0 82.9 81.9 83.9 81.3 81.2 80.1 78.6 77.9 78.3 76.8 –1.8% 2.1%<br />
Uzbekistan 8.1 7.2 6.7 7.4 6.7 7.0 7.2 6.8 7.0 6.8 6.5 –4.4% 0.2%<br />
Other Europe & Eurasia 22.0 19.1 18.8 20.0 21.8 21.7 21.4 21.1 21.9 22.6 23.5 4.2% 0.6%<br />
Total Europe & Eurasia 987.0 947.3 940.3 930.9 936.2 942.7 937.4 929.4 934.9 933.1 942.3 1.0% 25.9%<br />
Iran 50.9 53.4 58.4 60.6 59.0 55.9 57.3 56.1 54.0 53.2 54.0 1.5% 1.5%<br />
Kuwait 5.0 6.2 6.5 6.3 6.9 9.1 10.3 10.4 10.5 11.4 13.7 19.8% 0.4%<br />
Qatar 0.8 0.9 1.0 1.1 1.1 1.2 1.1 1.2 1.4 2.0 1.7 –14.1%<br />
◆<br />
Saudi Arabia 52.1 53.5 51.4 53.7 55.3 58.8 60.9 62.4 62.7 63.4 67.0 5.6% 1.8%<br />
United Arab Emirates 17.2 18.2 18.0 18.0 17.8 14.4 13.5 12.2 13.8 14.4 15.0 4.2% 0.4%<br />
Other Middle East 52.6 54.9 58.1 58.6 61.0 62.6 63.6 65.8 67.2 68.6 63.4 –7.6% 1.7%<br />
Total Middle East 178.7 187.2 193.4 198.2 201.3 202.1 206.8 208.1 209.7 213.1 214.9 0.8% 5.9%<br />
Algeria 9.1 8.7 8.4 8.1 8.0 8.2 8.1 8.5 8.8 9.7 10.0 2.7% 0.3%<br />
Egypt 21.6 21.5 23.3 24.6 26.0 27.3 27.8 27.2 26.1 25.2 25.9 2.7% 0.7%<br />
South Africa 18.0 18.8 20.1 20.7 21.0 21.3 21.8 22.5 23.0 23.6 24.2 2.5% 0.7%<br />
Other Africa 49.3 51.6 51.9 52.8 54.0 55.6 57.4 57.5 58.5 59.3 60.3 1.8% 1.7%<br />
Total Africa 98.0 100.5 103.7 106.1 108.9 112.4 115.1 115.7 116.3 117.9 120.5 2.2% 3.3%<br />
Australia 32.7 34.0 35.3 35.9 37.0 37.0 38.0 37.7 38.1 38.0 38.1 0.3% 1.0%<br />
Bangladesh 2.1 2.2 2.9 2.9 3.3 3.7 3.3 3.2 3.8 4.0 4.2 5.0% 0.1%<br />
China 140.5 149.5 160.7 174.4 185.6 190.3 207.2 230.1 232.2 246.9 275.2 11.5% 7.6%<br />
China Hong Kong SAR 8.3 8.9 9.5 9.3 9.2 8.8 9.3 9.7 11.7 12.9 13.1 1.4% 0.4%<br />
India 62.7 67.4 75.2 81.1 86.5 92.5 100.3 106.1 107.0 111.3 113.3 1.9% 3.1%<br />
Indonesia 37.6 37.0 39.1 42.4 45.9 43.5 46.8 50.2 51.9 53.1 53.9 1.5% 1.5%<br />
Japan 251.9 267.4 267.6 268.8 265.0 253.6 257.3 255.5 247.5 243.6 248.7 2.1% 6.8%<br />
Malaysia 15.6 17.4 17.9 19.0 20.2 19.0 20.3 20.4 20.6 22.5 23.9 6.4% 0.7%<br />
New Zealand 5.2 5.6 5.8 5.9 6.1 6.1 6.3 6.3 6.5 6.6 6.9 5.0% 0.2%<br />
Pakistan 13.5 14.5 15.8 16.6 17.0 17.6 18.2 18.8 18.3 18.0 17.0 –5.1% 0.5%<br />
Philippines 14.1 14.9 16.8 17.5 18.8 19.1 18.0 16.6 16.5 15.6 15.6 –0.1% 0.4%<br />
Singapore 26.7 30.6 32.0 30.3 32.4 33.3 31.6 33.5 36.4 35.5 34.1 –3.9% 0.9%<br />
South Korea 79.3 87.0 94.8 101.4 111.4 93.9 100.7 103.2 103.1 104.7 105.7 1.0% 2.9%<br />
Taiwan 30.2 32.3 34.7 34.8 36.0 37.2 39.9 39.8 39.2 40.0 41.7 4.2% 1.1%<br />
Thailand 26.8 29.8 34.7 37.5 37.8 35.4 35.4 34.8 33.1 36.4 38.7 6.2% 1.1%<br />
Other Asia Pacific 10.4 10.7 11.7 13.5 14.3 15.6 15.9 17.5 18.4 19.4 19.0 –2.5% 0.5%<br />
Total Asia Pacific 757.6 809.2 854.5 891.3 926.6 906.6 948.3 983.3 984.3 1008.3 1049.1 4.0% 28.8%<br />
TOTAL WORLD 3139.3 3198.5 3246.3 3322.7 3398.0 3416.9 3485.1 3526.1 3538.2 3562.6 3636.6 2.1% 100.0%<br />
of which: European Union 15 598.9 598.8 606.4 619.1 623.9 635.6 637.1 634.2 639.7 636.3 639.7 0.5% 17.6%<br />
OECD 1988.7 2043.1 2055.2 2114.4 2146.3 2152.5 2189.5 2200.5 2197.9 2191.6 2225.8 1.6% 61.2%<br />
Former Soviet Union 275.7 236.2 217.0 188.7 186.7 181.1 178.2 172.6 171.7 172.7 175.4 1.6% 4.8%<br />
Other EMEs 874.9 919.2 974.2 1019.7 1064.9 1083.2 1117.4 1153.0 1168.6 1198.4 1235.4 3.1% 34.0%<br />
*Inland demand plus international aviation and marine bunkers and refinery fuel and loss.<br />
◆ Less than 0.05%.<br />
Note: Differences between these world consumption figures and world production statistics on page 7 are accounted for by stock changes, consumption of non-petroleum<br />
additives and substitute fuels, and unavoidable disparities in the definition, measurement or conversion of oil supply and demand data.<br />
10 <strong>BP</strong> 2004 Statistical Review of World Energy
Consumption by area<br />
Million barrels daily<br />
80<br />
70<br />
60<br />
50<br />
40<br />
30<br />
20<br />
10<br />
0 78 79 80 81 82 83 84 85 86 87 88 89 90 91 92 93 94 95 96 97 98 99 00 01 02 03<br />
North America S. & Cent. America Europe & Eurasia Middle East Africa Asia Pacific<br />
World oil consumption growth was above trend in 2003 at almost 1.5 million barrels per day. Between them, North America and Asia Pacific have accounted for<br />
almost 90% of incremental oil consumption in the last 10 years.<br />
Consumption per capita<br />
Tonnes<br />
tonnes per capita<br />
0-0.75<br />
0.75-1.5<br />
1.5-2.25<br />
2.25-3.0<br />
> 3.0<br />
11
Oil<br />
Change 2003<br />
Regional consumption – by product group<br />
2003 over share<br />
Thousand barrels daily 1993 1994 1995 1996 1997 1998 1999 2000 2001 2002 2003 2002 of total<br />
North America<br />
Gasolines 8975 9100 9235 9389 9560 9849 9998 10106 10211 10523 10667 1.4% 44.3%<br />
Middle distillates 5600 5895 5935 6194 6398 6450 6628 6811 6812 6655 6855 3.0% 28.5%<br />
Fuel oil 1571 1571 1336 1348 1351 1506 1415 1518 1411 1209 1270 5.1% 5.3%<br />
Others 4441 4665 4645 4894 4967 4869 5246 5113 5135 5277 5291 0.3% 21.9%<br />
Total North America 20586 21232 21151 21824 22276 22675 23287 23549 23569 23663 24083 1.8% 100.0%<br />
of which: USA<br />
Gasolines 7792 7880 8025 8167 8324 8579 8716 8813 8890 9167 9273 1.1% 46.2%<br />
Middle distillates 4844 5084 5132 5342 5502 5545 5700 5852 5884 5735 5880 2.5% 29.3%<br />
Fuel oil 1062 1003 835 831 777 869 814 893 794 686 762 11.0% 3.8%<br />
Others 3539 3751 3733 3969 4017 3924 4290 4143 4082 4172 4156 –0.4% 20.7%<br />
Total USA 17236 17719 17725 18309 18621 18917 19519 19701 19649 19761 20071 1.6% 100.0%<br />
S. & Cent. America<br />
Gasolines 1025 1105 1149 1187 1257 1274 1387 1274 1256 1234 1197 –3.0% 25.9%<br />
Middle distillates 1312 1398 1476 1538 1625 1700 1684 1680 1720 1719 1703 –0.9% 36.8%<br />
Fuel oil 697 721 734 768 827 850 740 788 755 735 752 2.3% 16.3%<br />
Others 770 752 777 807 831 859 896 919 1009 1005 972 –3.2% 21.0%<br />
Total S. & Cent. America 3804 3977 4136 4300 4539 4683 4705 4661 4739 4692 4624 –1.5% 100.0%<br />
Europe<br />
Gasolines 4137 4123 4192 4223 4282 4315 4325 4213 4111 4045 3962 –2.1% 24.4%<br />
Middle distillates 5880 5890 6050 6371 6431 6630 6700 6746 6990 6947 7132 2.7% 44.0%<br />
Fuel oil 2353 2280 2283 2260 2206 2194 2093 1972 1982 1999 1975 –1.2% 12.2%<br />
Others 2639 2727 2765 2791 2934 2959 2958 3063 3078 3110 3157 1.5% 19.4%<br />
Total Europe 15009 15020 15290 15645 15853 16098 16076 15994 16160 16101 16226 0.8% 100.0%<br />
Middle East<br />
Gasolines 635 708 762 773 812 828 842 846 856 916 925 0.9% 20.6%<br />
Middle distillates 1235 1336 1435 1466 1463 1458 1485 1496 1547 1570 1568 –0.2% 35.0%<br />
Fuel oil 1142 1170 1187 1208 1233 1219 1265 1264 1259 1220 1228 0.7% 27.4%<br />
Others 691 678 645 664 681 702 712 710 710 740 759 2.5% 17.0%<br />
Total Middle East 3704 3891 4028 4112 4189 4207 4304 4317 4372 4446 4480 0.7% 100.0%<br />
Africa<br />
Gasolines 527 539 554 552 559 568 574 577 589 595 604 1.6% 23.5%<br />
Middle distillates 818 840 866 894 920 949 984 1007 1034 1059 1087 2.6% 42.2%<br />
Fuel oil 412 416 435 446 466 491 494 470 449 436 445 1.8% 17.3%<br />
Others 317 335 343 349 362 375 385 393 405 425 438 3.1% 17.0%<br />
Total Africa 2074 2130 2198 2240 2307 2383 2437 2447 2476 2515 2573 2.3% 100.0%<br />
Asia Pacific incl. China and Japan<br />
Gasolines 3699 3977 4294 4531 4991 5057 5331 5588 5650 5958 6190 3.9% 27.4%<br />
Middle distillates 5994 6237 6714 7167 7437 7224 7621 7815 7967 8070 8267 2.4% 36.6%<br />
Fuel oil 3611 3880 3856 3800 3832 3576 3551 3517 3352 3239 3430 5.9% 15.2%<br />
Others 2670 2990 3212 3344 3425 3463 3744 4136 4193 4476 4716 5.4% 20.8%<br />
Total Asia Pacific 15974 17083 18077 18842 19685 19320 20246 21056 21161 21743 22601 4.0% 100.0%<br />
China<br />
Gasolines 804 848 904 986 1111 1098 1164 1313 1252 1387 1527 10.1% 25.5%<br />
Middle distillates 898 878 997 1080 1202 1277 1455 1633 1709 1786 1948 9.1% 32.6%<br />
Fuel oil 725 665 669 719 750 725 694 725 728 705 826 17.2% 13.8%<br />
Others 486 755 819 888 871 946 1103 1314 1342 1500 1680 12.0% 28.1%<br />
Total China 2913 3145 3390 3672 3935 4047 4416 4985 5030 5379 5982 11.2% 100.0%<br />
Japan<br />
Gasolines 1355 1442 1548 1576 1646 1611 1702 1735 1720 1759 1777 1.0% 32.6%<br />
Middle distillates 1853 1905 1971 2027 1991 1949 1978 1958 1957 1930 1919 –0.6% 35.2%<br />
Fuel oil 1112 1292 1135 1067 977 879 861 804 690 649 762 17.5% 14.0%<br />
Others 1121 1106 1130 1142 1148 1086 1078 1079 1067 1021 993 –2.8% 18.2%<br />
Total Japan 5441 5746 5784 5813 5762 5525 5618 5577 5435 5359 5451 1.7% 100.0%<br />
World excl. Former Soviet Union<br />
Gasolines 18998 19553 20186 20656 21461 21892 22457 22605 22673 23271 23543 1.2% 31.6%<br />
Middle distillates 20838 21595 22475 23630 24274 24412 25101 25556 26069 26020 26612 2.3% 35.7%<br />
Fuel oil 9787 10039 9831 9829 9914 9837 9558 9530 9207 8838 9099 3.0% 12.2%<br />
Others 11528 12147 12386 12849 13201 13226 13941 14334 14528 15032 15333 2.0% 20.5%<br />
Total World excl. Former Soviet Union 61151 63334 64878 66964 68849 69367 71056 72024 72478 73161 74587 1.9% 100.0%<br />
European Union 15<br />
Gasolines 3562 3512 3550 3559 3590 3607 3622 3545 3462 3391 3311 –2.3% 24.5%<br />
Middle distillates 5033 5051 5179 5440 5514 5677 5761 5827 6041 5990 6146 2.6% 45.5%<br />
Fuel oil 1841 1797 1791 1755 1703 1736 1663 1558 1544 1597 1565 –2.0% 11.6%<br />
Others 2211 2294 2298 2297 2383 2409 2429 2446 2470 2457 2474 0.7% 18.4%<br />
Total European Union 15 12646 12654 12817 13051 13189 13429 13474 13376 13516 13434 13496 0.5% 100.0%<br />
OECD<br />
Gasolines 15124 15379 15721 15968 16415 16728 17028 17070 17066 17384 17482 0.6% 36.2%<br />
Middle distillates 13973 14414 14777 15468 15738 15751 16110 16279 16527 16308 16696 2.4% 34.5%<br />
Fuel oil 5324 5505 5115 5036 4904 4831 4671 4642 4408 4178 4316 3.3% 8.9%<br />
Others 8490 8802 8862 9175 9443 9293 9698 9702 9718 9837 9854 0.2% 20.4%<br />
Total OECD 42912 44099 44475 45647 46499 46603 47507 47693 47719 47707 48347 1.3% 100.0%<br />
Other EMEs<br />
Gasolines 3874 4174 4465 4688 5046 5163 5429 5535 5607 5886 6062 3.0% 23.1%<br />
Middle distillates 6866 7182 7698 8161 8536 8661 8992 9276 9542 9713 9916 2.1% 37.8%<br />
Fuel oil 4462 4534 4715 4793 5011 5006 4886 4888 4799 4660 4783 2.6% 18.2%<br />
Others 3038 3345 3525 3674 3758 3934 4243 4632 4810 5196 5479 5.5% 20.9%<br />
Total Other EMEs‡ 18239 19234 20403 21316 22350 22764 23549 24331 24759 25454 26240 3.1% 100.0%<br />
‡Excludes Former Soviet Union.<br />
Notes: For the purposes of this table, annual changes and shares of total are calculated using thousand barrels daily figures.<br />
‘Gasolines’ consists of aviation and motor gasolines and light distillate feedstock (LDF).<br />
‘Middle distillates' consists of jet and heating kerosines, and gas and diesel oils (including marine bunkers).<br />
‘Fuel oil’ includes marine bunkers and crude oil used directly as fuel.<br />
‘Others’ consists of refinery gas, LPGs, solvents, petroleum coke, lubricants, bitumen, wax and refinery fuel and loss.<br />
12 <strong>BP</strong> 2004 Statistical Review of World Energy
Product consumption – by region<br />
Gasolines (million barrels daily)<br />
30<br />
Middle distillates (million barrels daily)<br />
30<br />
25<br />
25<br />
20<br />
20<br />
15<br />
15<br />
10<br />
10<br />
5<br />
5<br />
0<br />
77 79 81 83 85 87 89 91 93 95 97 99 01 03<br />
North America Europe Asia Pacific Rest of World<br />
Rest of World excludes the Former Soviet Union.<br />
0 77 79 81 83 85 87 89 91 93 95 97 99 01 03<br />
Product consumption – by region<br />
Fuel oil (million barrels daily)<br />
30<br />
Others (million barrels daily)<br />
30<br />
25<br />
25<br />
20<br />
20<br />
15<br />
15<br />
10<br />
10<br />
5<br />
5<br />
0 77 79 81 83 85 87 89 91 93 95 97 99 01 03 0 77 79 81 83 85 87 89 91 93 95 97 99 01 03<br />
North America<br />
Europe<br />
Asia Pacific<br />
Rest of World<br />
Rest of World excludes the Former Soviet Union.<br />
Fuel oil was the fastest-growing product category in 2003 in the face of strong demand growth in North America, Japan and China. However, the long-term<br />
downward trend in fuel oil use remains intact.<br />
13
Oil<br />
Nigerian<br />
West Texas<br />
Spot crude prices<br />
Dubai Brent Forcados Intermediate<br />
US dollars per barrel $/bbl* $/bbl† $/bbl $/bbl‡<br />
1972 1.90 – – –<br />
1973 2.83 – – –<br />
1974 10.41 – – –<br />
1975 10.70 – – –<br />
1976 11.63 12.80 12.87 12.23<br />
1977 12.38 13.92 14.21 14.22<br />
1978 13.03 14.02 13.65 14.55<br />
1979 29.75 31.61 29.25 25.08<br />
1980 35.69 36.83 36.98 37.96<br />
1981 34.32 35.93 36.18 36.08<br />
1982 31.80 32.97 33.29 33.65<br />
1983 28.78 29.55 29.54 30.30<br />
1984 28.06 28.78 28.88 29.39<br />
1985 27.53 27.53 27.75 27.99<br />
1986 13.10 14.32 14.45 15.04<br />
1987 16.95 18.33 18.40 19.19<br />
1988 13.22 14.92 14.99 15.97<br />
1989 15.64 18.23 18.30 19.68<br />
1990 20.38 23.73 23.85 24.50<br />
1991 16.63 20.00 20.11 21.54<br />
1992 17.16 19.32 19.61 20.57<br />
1993 14.95 16.97 17.41 18.45<br />
1994 14.74 15.82 16.25 17.21<br />
1995 16.10 17.02 17.26 18.42<br />
1996 18.52 20.67 21.16 22.16<br />
1997 18.23 19.09 19.33 20.61<br />
1998 12.21 12.72 12.62 14.39<br />
1999 17.25 17.97 18.00 19.31<br />
2000 26.20 28.50 28.42 30.37<br />
2001 22.81 24.44 24.23 25.93<br />
2002 23.74 25.02 25.04 26.16<br />
2003 26.78 28.83 28.66 31.06<br />
*1972-1985 Arabian Light, 1986-2003 Dubai dated. Source: Platts.<br />
†1976-1983 Forties, 1984-2003 Brent dated.<br />
‡1976-1983 Posted WTI prices, 1984-2003 Spot WTI (Cushing) prices.<br />
Crude oil prices since 1861<br />
US dollars per barrel<br />
World events<br />
Pennsylvanian<br />
oil boom<br />
100<br />
Russian<br />
oil exports<br />
begin<br />
Sumatra<br />
production<br />
begins<br />
Discovery of<br />
Spindletop,<br />
Texas<br />
Growth of Venezuelan production<br />
Fears of<br />
shortage<br />
in USA<br />
East Texas<br />
field<br />
discovered<br />
Loss of Iranian supplies<br />
Post-war<br />
reconstruction<br />
Suez<br />
crisis<br />
Netback pricing introduced<br />
Iranian revolution<br />
Yom Kippur war<br />
Asian financial<br />
crisis<br />
Iraq<br />
invaded<br />
Kuwait<br />
Invasion<br />
of Iraq<br />
90<br />
80<br />
70<br />
60<br />
50<br />
40<br />
30<br />
20<br />
10<br />
0<br />
1861-69 1870-79 1880-89 1890-99 1900-09 1910-19 1920-29 1930-39 1940-49 1950-59 1960-69 1970-79 1980-89 1990-99<br />
2000-03<br />
$ money of the day $ 2003<br />
1861-1944 US average.<br />
1945-1983 Arabian Light posted at Ras Tanura.<br />
1984-2003 Brent dated.<br />
14 <strong>BP</strong> 2004 Statistical Review of World Energy
Rotterdam product prices<br />
US dollars per tonne<br />
400<br />
350<br />
300<br />
250<br />
200<br />
150<br />
100<br />
50<br />
0<br />
86 87 88 89 90 91 92 93 94 95 96 97 98 99 00 01 02 03<br />
Gasoline Gas oil Heavy fuel oil Source: Platts.<br />
1986 to 1st quarter 1992: leaded gasoline.<br />
From 2nd quarter 1992: unleaded gasoline.<br />
OECD total commercial oil stocks<br />
Million barrels<br />
2900<br />
2800<br />
2700<br />
2600<br />
2500<br />
2400<br />
2300<br />
J F M A M J J A S O N D J F M A M J J A S O N D<br />
2002 2003<br />
Jan 2002-Dec 2003 1998-2002 range<br />
Source: © OECD/IEA, 2004.<br />
15
Oil<br />
Change 2003<br />
Refinery capacities<br />
2003 over share<br />
Thousand barrels daily* 1993 1994 1995 1996 1997 1998 1999 2000 2001 2002 2003 2002 of total<br />
USA 15030 15434 15333 15452 15711 16261 16512 16595 16785 16757 16894 0.8% 20.2%<br />
Canada 1824 1832 1792 1807 1811 1844 1861 1861 1917 1923 1928 0.3% 2.3%<br />
Mexico 1444 1444 1444 1444 1449 1449 1449 1481 1481 1463 1463 – 1.7%<br />
Total North America 18298 18710 18569 18703 18971 19554 19822 19937 20183 20143 20285 0.7% 24.2%<br />
Argentina 688 663 648 651 653 650 650 657 657 657 657 – 0.8%<br />
Brazil 1429 1473 1481 1481 1739 1750 1845 1863 1823 1868 1913 2.4% 2.3%<br />
Netherlands Antilles & Aruba 467 485 505 520 520 520 535 535 590 590 625 5.9% 0.7%<br />
Venezuela 1181 1181 1181 1183 1183 1183 1183 1183 1183 1199 1199 – 1.4%<br />
Other S. & Cent. America 2249 2209 2262 2256 2281 2189 2219 2225 2213 2287 2237 –2.2% 2.7%<br />
Total S. &. Cent. America 6014 6011 6077 6091 6376 6292 6432 6463 6466 6601 6631 0.5% 7.9%<br />
Belgium 692 692 692 690 698 732 736 770 785 803 805 0.2% 1.0%<br />
France 1687 1697 1728 1749 1872 1918 1933 1984 1961 1987 1967 –1.0% 2.4%<br />
Germany 2248 2272 2104 2098 2170 2206 2240 2262 2274 2286 2304 0.8% 2.8%<br />
Greece 295 385 403 403 403 403 403 403 412 412 412 – 0.5%<br />
Italy 2360 2272 2272 2256 2241 2269 2292 2292 2292 2292 2292 – 2.7%<br />
Netherlands 1197 1197 1197 1169 1196 1196 1212 1212 1233 1233 1233 – 1.5%<br />
Norway 288 288 298 308 308 310 323 318 307 310 310 – 0.4%<br />
Russian Federation 6521 6581 6183 6194 6029 5673 5539 5451 5404 5472 5512 0.7% 6.6%<br />
Spain 1245 1205 1215 1232 1265 1247 1247 1247 1247 1333 1333 – 1.6%<br />
Sweden 422 422 422 421 422 422 422 422 422 422 422 – 0.5%<br />
Turkey 673 673 673 671 673 643 643 643 643 643 643 – 0.8%<br />
United Kingdom 1844 1866 1844 1873 1823 1848 1777 1778 1769 1785 1785 – 2.1%<br />
Other Europe and Eurasia 7094 6972 6833 6692 6559 6456 6144 6045 6084 6169 6239 1.1% 7.5%<br />
Total Europe and Eurasia 26566 26522 25864 25756 25659 25323 24911 24827 24833 25147 25257 0.4% 30.2%<br />
Iran 1062 1162 1192 1192 1272 1392 1484 1484 1484 1484 1494 0.7% 1.8%<br />
Iraq 634 634 634 634 634 634 634 639 644 644 644 – 0.8%<br />
Kuwait 455 720 795 825 880 895 895 690 745 770 905 17.5% 1.1%<br />
Saudi Arabia 1670 1683 1692 1699 1704 1762 1838 1846 1861 1861 1911 2.7% 2.3%<br />
United Arab Emirates 215 220 220 250 298 235 290 440 674 711 645 –9.3% 0.8%<br />
Other Middle East 1137 1151 1153 1172 1164 1169 1175 1173 1164 1254 1255 0.1% 1.5%<br />
Total Middle East 5173 5570 5686 5772 5952 6087 6316 6272 6572 6724 6854 1.9% 8.2%<br />
Total Africa 2902 2834 2914 2991 2932 2885 2987 3033 3197 3284 3317 1.0% 4.0%<br />
Australasia 791 796 818 848 890 916 919 937 931 945 873 –7.6% 1.0%<br />
China 3334 3567 4014 4226 4559 4592 5401 5407 5643 5479 5487 0.1% 6.6%<br />
India 1069 1072 1133 1210 1236 1356 2190 2219 2261 2289 2333 1.9% 2.8%<br />
Indonesia 865 930 990 990 990 1025 1048 1056 1056 1056 1056 – 1.3%<br />
Japan 4802 4862 5006 5006 5056 5088 5109 5029 4811 4721 4683 –0.8% 5.6%<br />
Singapore 1160 1158 1273 1245 1246 1246 1246 1255 1255 1255 1255 – 1.5%<br />
South Korea 1591 1615 1727 1917 2316 2316 2316 2316 2316 2316 2316 – 2.8%<br />
Taiwan 570 570 732 732 732 732 732 732 874 1159 1159 – 1.4%<br />
Thailand 420 445 529 777 824 863 872 872 846 848 860 1.4% 1.0%<br />
Other Asia Pacific 845 928 1070 1089 1090 1154 1233 1292 1386 1351 1292 –4.4% 1.5%<br />
Total Asia Pacific 15447 15943 17292 18040 18939 19288 21066 21115 21379 21419 21314 –0.5% 25.5%<br />
TOTAL WORLD 74400 75590 76402 77353 78829 79429 81534 81647 82630 83318 83658 0.4% 100.0%<br />
of which: European Union 15 12924 12982 12887 12921 13069 13237 13265 13382 13421 13592 13592 – 16.2%<br />
OECD 40412 40977 40999 41359 42289 43104 43443 43614 43666 43834 43866 0.1% 52.4%<br />
Former Soviet Union 10106 10166 9635 9549 9280 8823 8473 8358 8280 8350 8390 0.5% 10.0%<br />
Other EMEs 23882 24447 25768 26445 27260 27502 29618 29675 30684 31134 31402 0.9% 37.5%<br />
*Atmospheric distillation capacity on a calendar-day basis.<br />
Note: For the purposes of this table, annual changes and shares of total are calculated using thousand barrels daily figures.<br />
Source: Includes data from Parpinelli Tecnon.<br />
Change 2003<br />
Refinery throughputs<br />
2003 over share<br />
Thousand barrels daily 1993 1994 1995 1996 1997 1998 1999 2000 2001 2002 2003 2002 of total<br />
USA 13613 13866 13973 14195 14662 14889 14804 15067 15128 14947 15303 2.4% 21.5%<br />
Canada 1539 1580 1569 1644 1694 1709 1714 1765 1812 1862 1885 1.2% 2.7%<br />
Mexico 1540 1459 1488 1491 1438 1451 1389 1364 1398 1387 1436 3.5% 2.0%<br />
S. & Cent. America 4552 4617 4823 4848 4920 5120 5188 5366 5361 4933 4933 – 6.9%<br />
Europe & Eurasia 19964 19290 19150 19164 19402 19645 19088 19340 19618 19647 20071 2.2% 28.2%<br />
Middle East 4501 4776 5130 5477 5488 5659 5698 5488 5807 6107 5973 –2.2% 8.4%<br />
Africa 2262 2299 2375 2393 2343 2412 2343 2234 2411 2451 2406 –1.8% 3.4%<br />
Australasia 787 786 807 842 872 866 880 851 847 855 815 –4.7% 1.1%<br />
China 2570 2548 2711 2850 3084 3060 3686 4218 4215 4395 4871 10.8% 6.9%<br />
Japan 3982 4167 4169 4168 4319 4212 4149 4145 4107 3986 4118 3.3% 5.8%<br />
Other Asia Pacific 6051 6314 6822 7544 8183 8010 8309 8914 9054 8827 9280 5.1% 13.1%<br />
TOTAL WORLD 61361 61702 63017 64616 66405 67033 67248 68752 69758 69397 71091 2.4% 100.0%<br />
of which: European Union 15 11884 11950 11910 12184 12351 12828 12410 12505 12479 12313 12553 1.9% 17.7%<br />
OECD 36384 36926 37292 38183 39455 39937 39455 39802 39823 39144 39944 2.0% 56.2%<br />
Former Soviet Union 5977 5157 4950 4713 4761 4519 4471 4583 4883 5163 5295 2.6% 7.4%<br />
Other EMEs 19001 19618 20776 21720 22189 22576 23322 24366 25052 25090 25852 3.0% 36.4%<br />
Note: For the purposes of this table, annual changes and shares of total are calculated using thousand barrels daily figures.<br />
Source: Includes data from ESAI.<br />
16 <strong>BP</strong> 2004 Statistical Review of World Energy
Refinery utilization<br />
Percentage<br />
100<br />
90<br />
80<br />
70<br />
80 81 82 83 84 85 86 87 88 89 90 91 92 93 94 95 96 97 98 99 00 01 02 03<br />
North America S. & Cent. America Europe Middle East Africa Asia Pacific<br />
Refinery capacity utilization increased in the key consuming regions of North America, Europe and Asia Pacific in 2003, as oil demand growth picked up.<br />
While Asia Pacific utilization reached a new peak, North America and Europe remained below the highs of the late 1990s.<br />
Regional refining margins<br />
US dollars per barrel<br />
10<br />
Note: The refining margins presented are benchmark margins for three major global refining centres, US Gulf Coast<br />
(USGC), North West Europe (NWE) (Rotterdam) and Singapore. In each case they are based on a single crude<br />
appropriate for that region and have optimized product yields based on a generic refinery configuration (cracking,<br />
hydrocracking or coking), again appropriate for that region. The margins are on a semi-variable basis, i.e. the margin<br />
after all variable costs and fixed energy costs.<br />
8<br />
6<br />
4<br />
2<br />
0 93 94 95 96 97 98 99 00 01 02 03<br />
USGC West Texas Sour Coking NWE Brent Cracking Singapore Dubai Hydrocracking<br />
17
Oil<br />
Change 2003<br />
Trade movements<br />
2003 over share<br />
Thousand barrels daily 1993 1994 1995 1996 1997 1998 1999 2000 2001 2002 2003 2002 of total<br />
Imports<br />
USA 8620 8929 8831 9400 9907 10382 10550 11092 11618 11357 12254 7.9% 26.8%<br />
Europe 11083 10740 10436 10472 10421 11017 10670 11070 11531 11895 11993 0.8% 26.2%<br />
Japan 5307 5612 5581 5685 5735 5259 5346 5329 5202 5070 5314 4.8% 11.6%<br />
Rest of World* 9753 10464 11562 12764 13721 13432 14157 14911 15401 15306 16238 6.1% 35.5%<br />
TOTAL WORLD 34763 35745 36410 38321 39784 40090 40723 42402 43752 43628 45799 5.0% 100.0%<br />
Exports<br />
USA 959 943 949 978 976 1011 956 890 910 904 921 1.9% 2.0%<br />
Canada 1215 1323 1402 1484 1492 1603 1520 1703 1804 1959 2096 7.0% 4.6%<br />
Mexico 1434 1421 1422 1656 1767 1770 1739 1814 1882 1966 2115 7.6% 4.6%<br />
S. & Cent. America 2391 2695 2797 3011 3219 3240 3145 3079 3143 2965 2942 –0.8% 6.4%<br />
Europe 1358 1634 1472 1540 1463 1344 1851 1967 1947 2234 2066 –7.5% 4.5%<br />
Former Soviet Union 2436 2531 2731 3239 3413 3569 4019 4273 4679 5370 6003 11.8% 13.1%<br />
Middle East 16456 16513 16651 17170 18184 18702 18341 18944 19098 18062 18943 4.9% 41.4%<br />
North Africa 2685 2652 2696 2756 2743 2712 2726 2732 2724 2620 2715 3.6% 5.9%<br />
West Africa 2676 2675 2723 2916 3102 3094 2985 3293 3182 3134 3612 15.3% 7.9%<br />
Asia Pacific† 2420 2517 2576 2790 2735 2490 2650 2767 2879 2863 3025 5.6% 6.6%<br />
Rest of World* 733 840 991 780 690 556 791 940 1506 1551 1361 –12.2% 3.0%<br />
TOTAL WORLD 34763 35744 36410 38320 39784 40091 40723 42402 43754 43628 45799 5.0% 100.0%<br />
*Includes unidentified trade.<br />
†Excludes Japan.<br />
Note: For the purposes of this table, annual changes and shares of total are calculated using thousand barrels daily figures.<br />
Inter-area movements 2003<br />
To<br />
Million tonnes S. & C. Austral-<br />
Other<br />
Asia Rest of<br />
From USA Canada Mexico America Europe Africa asia China Japan Pacific World Total<br />
USA – 6.1 6.7 12.1 9.7 0.3 0.8 0.4 3.4 3.9 0.7 44.1<br />
Canada 102.0 – – 0.2 0.4 – – – 0.6 0.1 – 103.3<br />
Mexico 81.5 1.2 – 9.9 8.8 0.2 – – 0.3 2.7 0.5 105.1<br />
S. & Cent. America 120.9 3.4 0.9 – 10.1 0.6 – 2.3 0.1 6.2 – 144.5<br />
Europe 50.1 25.1 0.3 2.7 – 10.4 0.4 1.3 1.1 3.3 6.2 100.9<br />
Former Soviet Union 12.4 – – 2.6 244.2 1.0 – 11.9 2.2 11.2 10.7 296.2<br />
Middle East 126.1 6.3 0.6 13.3 154.3 35.3 7.1 51.8 208.4 333.7 2.0 938.9<br />
North Africa 19.7 7.1 1.0 3.8 90.6 3.8 – 0.4 0.2 6.6 0.6 133.8<br />
West Africa 70.8 1.8 – 9.5 36.4 4.6 0.1 15.7 4.8 36.0 – 179.7<br />
East & Southern Africa – – – – 1.3 – – 6.4 2.3 0.9 – 10.9<br />
Australasia 1.7 – – 0.1 0.3 – – 2.2 3.7 9.6 – 17.6<br />
China 1.3 – – 0.7 0.1 0.1 0.7 – 4.3 13.0 0.4 20.6<br />
Japan 0.4 – – – 0.1 – 0.3 1.6 – 1.4 – 3.8<br />
Other Asia Pacific 7.8 0.2 – 0.1 4.0 0.3 21.4 34.0 28.8 11.8 0.9 109.3<br />
Unidentified* 10.4 4.7 – – 32.6 – 1.2 0.3 2.4 – 0.2 51.8<br />
TOTAL IMPORTS 605.1 55.9 9.5 55.0 592.9 56.6 32.0 128.3 262.6 440.4 22.2 2260.5<br />
Thousand barrels daily<br />
From<br />
USA – 127 140 253 203 6 17 8 71 82 15 921<br />
Canada 2069 – – 4 8 – – – 13 2 – 2096<br />
Mexico 1639 24 – 201 177 4 – – 6 54 10 2115<br />
S. & Cent. America 2458 70 19 – 206 12 – 47 2 127 – 2942<br />
Europe 1026 506 6 55 – 217 8 26 23 69 130 2066<br />
Former Soviet Union 253 – – 52 4941 20 – 243 45 231 216 6003<br />
Middle East 2536 127 13 267 3105 715 143 1045 4204 6749 42 18943<br />
North Africa 407 143 21 76 1832 77 – 8 4 134 12 2715<br />
West Africa 1424 36 – 191 732 92 2 315 96 723 – 3612<br />
East & Southern Africa – – – – 26 – – 129 46 18 – 219<br />
Australasia 34 – – 2 6 – – 45 76 194 – 357<br />
China 27 – – 15 2 2 14 – 87 269 8 424<br />
Japan 8 – – – 2 – 6 33 – 29 – 79<br />
Other Asia Pacific 160 4 – 2 83 6 433 701 592 242 19 2243<br />
Unidentified* 214 95 – – 668 – 25 6 50 – 4 1062<br />
TOTAL IMPORTS 12254 1131 199 1119 11993 1153 649 2607 5314 8924 455 45799<br />
*Includes changes in the quantity of oil in transit, movements not otherwise shown, unidentified military use etc.<br />
18 <strong>BP</strong> 2004 Statistical Review of World Energy
Major trade movements<br />
Trade flows worldwide (million tonnes)<br />
126.1<br />
244.2<br />
25.1<br />
50.1<br />
208.4<br />
102.0<br />
70.8 36.4<br />
154.3<br />
51.8<br />
19.7<br />
90.6<br />
81.5<br />
333.7<br />
34.0 28.8<br />
120.9<br />
35.3<br />
21.4<br />
USA<br />
Canada<br />
Mexico<br />
S. & Cent. America<br />
Europe & Eurasia<br />
Middle East<br />
Africa<br />
Asia Pacific<br />
36.0<br />
Imports and exports 2003<br />
Million tonnes<br />
Thousand barrels daily<br />
Crude Product Crude Product Crude Product Crude Product<br />
imports imports exports exports imports imports exports exports<br />
USA 480.3 124.8 1.1 43.0 9645 2609 22 899<br />
Canada 45.1 10.8 77.2 26.1 906 226 1550 546<br />
Mexico – 9.5 99.7 5.4 – 199 2002 113<br />
S. & Cent. America 37.7 17.3 96.1 48.4 757 362 1930 1012<br />
Europe 488.5 104.4 52.2 48.7 9810 2182 1048 1018<br />
Former Soviet Union – 5.3 229.9 66.3 – 111 4617 1386<br />
Middle East 10.5 6.4 831.8 107.1 211 134 16704 2239<br />
North Africa 8.5 6.5 99.6 34.2 171 136 2000 715<br />
West Africa 2.7 8.5 175.6 4.1 54 178 3526 86<br />
East & Southern Africa 25.0 5.4 10.3 0.6 502 113 207 13<br />
Australasia 24.2 7.8 12.9 4.7 486 163 259 98<br />
China 91.1 37.2 7.8 12.8 1829 778 157 268<br />
Japan 213.2 49.4 – 3.8 4282 1033 – 79<br />
Other Asia Pacific 343.2 97.2 50.8 58.5 6892 2032 1020 1223<br />
Unidentified* – – 25.0 26.8 – – 502 560<br />
TOTAL WORLD 1770.0 490.5 1770.0 490.5 35545 10253 35545 10253<br />
*Includes changes in the quantity of oil in transit, movements not otherwise shown, unidentified military use etc.<br />
Note: Bunkers are not included as exports. Intra-area movements (for example, between countries in Europe) are excluded.<br />
19
Natural gas<br />
At end 1983 At end 1993 At end 2002 At end 2003<br />
Proved reserves Trillion Trillion Trillion Trillion Trillion<br />
cubic cubic cubic cubic cubic Share R/P<br />
metres metres metres feet metres of total ratio<br />
USA 5.61 4.55 5.23 184.8 5.23 3.0% 9.5<br />
Canada 2.61 2.23 1.66 58.7 1.66 0.9% 9.2<br />
Mexico 2.18 1.97 0.42 14.7 0.42 0.2% 11.4<br />
Total North America 10.40 8.75 7.32 258.2 7.31 4.2% 9.5<br />
Argentina 0.68 0.52 0.66 23.4 0.66 0.4% 16.2<br />
Bolivia 0.13 0.12 0.81 28.7 0.81 0.5% *<br />
Brazil 0.10 0.19 0.24 8.7 0.25 0.1% 24.3<br />
Colombia 0.11 0.21 0.12 4.0 0.11 0.1% 18.6<br />
Peru 0.03 0.33 0.25 8.7 0.25 0.1% *<br />
Trinidad & Tobago 0.32 0.24 0.73 26.0 0.74 0.4% 29.7<br />
Venezuela 1.56 3.69 4.18 146.5 4.15 2.4% *<br />
Other S. & Cent. America 0.25 0.24 0.22 7.7 0.22 0.1% *<br />
Total S. & Cent. America 3.18 5.54 7.22 253.7 7.19 4.1% 60.6<br />
Azerbaijan n/a n/a 1.37 48.4 1.37 0.8% *<br />
Denmark 0.10 0.13 0.08 3.3 0.09 0.1% 11.8<br />
Germany 0.32 0.20 0.22 7.3 0.21 0.1% 11.7<br />
Italy 0.25 0.33 0.22 7.8 0.22 0.1% 16.0<br />
Kazakhstan n/a n/a 1.90 67.1 1.90 1.1% *<br />
Netherlands 1.94 1.88 1.57 58.8 1.67 0.9% 28.6<br />
Norway 0.47 1.76 2.12 86.9 2.46 1.4% 33.5<br />
Poland 0.09 0.16 0.12 4.1 0.12 0.1% 28.9<br />
Romania 0.23 0.45 0.31 11.0 0.31 0.2% 24.6<br />
Russian Federation n/a n/a 47.00 1659.1 47.00 26.7% 81.2<br />
Turkmenistan n/a n/a 2.90 102.4 2.90 1.6% 52.6<br />
Ukraine n/a n/a 1.11 39.2 1.11 0.6% 62.6<br />
United Kingdom 0.71 0.63 0.63 22.2 0.63 0.4% 6.1<br />
Uzbekistan n/a n/a 1.85 65.3 1.85 1.1% 34.5<br />
Other Europe & Eurasia 36.37 58.10 0.46 16.3 0.46 0.3% 43.4<br />
Total Europe & Eurasia 40.48 63.62 61.86 2199.0 62.30 35.4% 60.8<br />
Bahrain 0.22 0.16 0.09 3.0 0.09<br />
◆<br />
8.8<br />
Iran 14.05 20.70 26.69 942.2 26.69 15.2% *<br />
Iraq 0.82 3.10 3.11 109.7 3.11 1.8% *<br />
Kuwait 1.04 1.49 1.56 55.0 1.56 0.9% *<br />
Oman 0.17 0.20 0.95 33.4 0.95 0.5% 57.3<br />
Qatar 3.40 7.07 25.77 909.6 25.77 14.7% *<br />
Saudi Arabia 3.54 5.25 6.65 235.7 6.68 3.8% *<br />
Syria 0.10 0.23 0.30 10.6 0.30 0.2% 47.6<br />
United Arab Emirates 3.05 5.80 6.06 213.9 6.06 3.4% *<br />
Yemen – 0.43 0.48 16.9 0.48 0.3% *<br />
Other Middle East † † 0.05 1.8 0.05<br />
◆<br />
*<br />
Total Middle East 26.38 44.43 71.69 2531.8 71.72 40.8% *<br />
Algeria 3.53 3.70 4.52 159.7 4.52 2.6% 54.6<br />
Egypt 0.20 0.60 1.66 62.0 1.76 1.0% 70.4<br />
Libya 0.64 1.29 1.31 46.4 1.31 0.7% *<br />
Nigeria 1.37 3.68 5.00 176.4 5.00 2.8% *<br />
Other Africa 0.55 0.75 1.19 42.1 1.19 0.7% *<br />
Total Africa 6.29 10.01 13.68 486.5 13.78 7.8% 97.5<br />
Australia 0.50 0.56 2.55 90.0 2.55 1.4% 76.9<br />
Bangladesh 0.31 0.30 0.34 12.0 0.34 0.2% 27.8<br />
Brunei 0.22 0.40 0.35 12.4 0.35 0.2% 28.3<br />
China 0.75 1.03 1.75 64.4 1.82 1.0% 53.4<br />
India 0.46 0.72 0.75 30.1 0.85 0.5% 28.4<br />
Indonesia 1.19 1.82 2.56 90.3 2.56 1.5% 35.2<br />
Malaysia 1.40 1.83 2.48 84.9 2.41 1.4% 45.0<br />
Myanmar 0.25 0.27 0.36 12.8 0.36 0.2% 52.6<br />
Pakistan 0.51 0.64 0.76 26.5 0.75 0.4% 35.5<br />
Papua New Guinea – 0.55 0.43 15.1 0.43 0.2% *<br />
Thailand 0.10 0.17 0.44 15.4 0.44 0.2% 22.3<br />
Vietnam – 0.11 0.23 8.1 0.23 0.1% 76.7<br />
Other Asia Pacific 0.26 0.36 0.39 13.7 0.39 0.2% 32.9<br />
Total Asia Pacific 5.95 8.73 13.38 475.6 13.47 7.7% 43.4<br />
TOTAL WORLD 92.68 141.08 175.15 6204.9 175.78 100.0% 67.1<br />
of which: European Union 15 3.44 3.24 2.79 101.8 2.88 1.6% 14.1<br />
OECD 15.23 14.70 15.05 546.5 15.48 8.8% 14.2<br />
Former Soviet Union 36.00 57.80 56.40 1990.7 56.40 32.1% 78.0<br />
*Over 100 years.<br />
†Less than 0.05.<br />
◆ Less than 0.05%.<br />
n/a not available.<br />
Notes:<br />
Proved reserves of natural gas – Generally taken to be those quantities that geological and engineering information indicates with reasonable certainty can be recovered in the<br />
future from known reservoirs under existing economic and operating conditions.<br />
Reserves-to-production (R/P) ratio – If the reserves remaining at the end of the year are divided by the production in that year, the result is the length of time that those remaining<br />
reserves would last if production were to continue at that level.<br />
Source of data – The estimates in this table have been compiled using a combination of primary official sources and third-party data from Cedigaz, the OPEC Secretariat and<br />
Oil & Gas Journal. The reserves figures shown do not necessarily meet the United States Securities and Exchange Commission definitions and guidelines for determining proved<br />
reserves nor necessarily represent <strong>BP</strong>’s view of proved reserves by country.<br />
20 <strong>BP</strong> 2004 Statistical Review of World Energy
Proved reserves at end 2003<br />
Trillion cubic metres<br />
Middle East<br />
71.72<br />
Europe & Eurasia<br />
62.30<br />
S. & Cent. America<br />
7.19<br />
North America<br />
7.31<br />
Asia Pacific<br />
13.47<br />
Africa<br />
13.78<br />
Distribution of proved reserves 2003<br />
Percentage<br />
North America<br />
4.2%<br />
Asia Pacific<br />
7.7%<br />
S. & Cent.<br />
America<br />
4.1%<br />
Proved reserves<br />
Trillion cubic metres<br />
180<br />
160<br />
140<br />
Africa<br />
7.8%<br />
Middle East<br />
40.8%<br />
120<br />
100<br />
80<br />
Europe &<br />
Eurasia<br />
35.4%<br />
60<br />
40<br />
20<br />
0 83 93 03<br />
21
Natural gas<br />
Change 2003<br />
Production*<br />
2003 over share<br />
Billion cubic metres 1993 1994 1995 1996 1997 1998 1999 2000 2001 2002 2003 2002 of total<br />
USA 520.4 541.8 534.3 541.7 543.1 549.2 541.6 550.6 564.7 545.4 549.5 0.7% 21.0%<br />
Canada 139.0 149.1 158.7 163.6 165.8 171.3 177.4 183.2 186.8 187.8 180.5 –3.9% 6.9%<br />
Mexico 25.4 25.9 26.6 28.0 31.7 34.3 37.2 35.8 35.3 35.3 36.4 3.0% 1.4%<br />
Total North America 684.8 716.7 719.6 733.3 740.6 754.8 756.2 769.6 786.8 768.5 766.3 –0.3% 29.3%<br />
Argentina 21.5 22.3 25.0 28.9 27.4 29.6 34.6 37.4 37.1 36.1 41.0 13.7% 1.6%<br />
Bolivia 3.0 3.3 3.2 3.2 2.7 2.8 2.3 3.2 4.7 4.9 5.2 5.2% 0.2%<br />
Brazil 4.5 4.5 4.8 5.5 6.0 6.3 6.7 7.2 7.6 9.2 10.1 9.2% 0.4%<br />
Colombia 4.2 4.2 4.4 4.7 5.9 6.3 5.2 5.9 6.1 6.2 6.1 –1.5% 0.2%<br />
Trinidad & Tobago 5.9 6.2 6.1 7.1 7.4 8.6 11.7 14.1 15.2 17.3 24.8 43.4% 0.9%<br />
Venezuela 23.3 24.7 27.5 29.7 30.8 32.3 27.4 27.9 29.6 28.4 29.4 3.4% 1.1%<br />
Other S. & Cent. America 2.1 2.2 2.2 2.3 2.4 2.5 2.1 2.1 2.2 2.0 2.1 2.3% 0.1%<br />
Total S. & Cent. America 64.7 67.4 73.2 81.4 82.5 88.4 90.0 97.8 102.5 104.2 118.6 13.9% 4.5%<br />
Azerbaijan 6.3 6.0 6.2 5.9 5.6 5.2 5.6 5.3 5.2 4.8 4.8 –0.3% 0.2%<br />
Denmark 4.5 4.9 5.3 6.4 7.9 7.6 7.8 8.1 8.4 8.4 7.9 –5.3% 0.3%<br />
Germany 14.9 15.6 16.1 17.4 17.1 16.7 17.8 16.9 17.0 17.0 17.7 4.1% 0.7%<br />
Italy 19.5 20.6 20.4 20.0 19.3 19.0 17.5 16.2 15.2 14.6 13.7 –6.0% 0.5%<br />
Kazakhstan 6.2 4.2 5.5 6.1 7.6 7.4 9.3 10.8 10.8 10.6 12.9 22.7% 0.5%<br />
Netherlands 70.0 66.4 67.0 75.8 67.1 63.6 59.3 57.3 61.9 60.6 58.3 –3.8% 2.2%<br />
Norway 24.8 26.8 27.8 37.4 43.0 44.2 48.5 49.7 53.9 65.5 73.4 12.0% 2.8%<br />
Poland 3.6 3.4 3.5 3.6 3.6 3.6 3.4 3.7 3.9 4.0 4.0 1.2% 0.2%<br />
Romania 20.6 18.7 18.0 17.2 15.0 14.0 14.0 13.8 13.6 13.2 12.6 –4.4% 0.5%<br />
Russian Federation 576.5 566.4 555.4 561.1 532.6 551.3 551.0 545.0 542.4 555.4 578.6 4.2% 22.1%<br />
Turkmenistan 60.9 33.3 30.1 32.8 16.1 12.4 21.3 43.8 47.9 49.9 55.1 10.4% 2.1%<br />
Ukraine 17.9 17.0 17.0 17.2 17.4 16.8 16.9 16.7 17.1 17.4 17.7 1.8% 0.7%<br />
United Kingdom 60.5 64.6 70.8 84.2 85.9 90.2 99.1 108.4 105.8 103.6 102.7 –0.9% 3.9%<br />
Uzbekistan 42.0 44.0 45.3 45.7 47.8 51.1 51.9 52.6 53.5 53.8 53.6 –0.3% 2.0%<br />
Other Europe & Eurasia 16.2 15.6 15.6 14.0 13.3 12.3 11.4 11.2 11.2 11.2 10.6 –4.8% 0.4%<br />
Total Europe & Eurasia 944.5 907.5 904.0 944.8 899.0 915.4 934.8 959.4 967.8 990.0 1023.9 3.4% 39.1%<br />
Bahrain 6.9 7.1 7.2 7.4 8.0 8.4 8.7 8.8 9.1 9.5 9.6 2.0% 0.4%<br />
Iran 27.1 31.8 35.3 39.0 47.0 50.0 56.4 60.2 66.0 75.0 79.0 5.3% 3.0%<br />
Kuwait 5.4 6.0 9.3 9.3 9.3 9.5 8.6 9.6 8.5 8.0 8.3 3.8% 0.3%<br />
Oman 2.8 2.9 4.1 4.4 5.0 5.2 5.5 8.7 14.0 15.0 16.5 10.0% 0.6%<br />
Qatar 13.5 13.5 13.5 13.7 17.4 19.6 22.1 23.7 27.0 29.5 30.8 4.4% 1.2%<br />
Saudi Arabia 40.0 42.8 42.9 44.4 45.3 46.8 46.2 49.8 53.7 56.7 61.0 7.6% 2.3%<br />
Syria 1.4 1.5 1.9 2.5 3.8 4.3 4.5 4.2 4.1 5.0 6.3 25.0% 0.2%<br />
United Arab Emirates 23.0 25.8 31.3 33.8 36.3 37.1 38.5 38.4 39.4 43.4 44.4 2.3% 1.7%<br />
Other Middle East 2.8 3.4 3.4 3.5 3.3 3.2 3.4 3.4 3.0 2.6 1.8 –32.7% 0.1%<br />
Total Middle East 122.9 134.8 148.9 158.0 175.4 184.0 193.8 206.8 224.8 244.7 257.7 5.3% 9.8%<br />
Algeria 56.1 51.6 58.7 62.3 71.8 76.6 86.0 84.4 78.2 80.4 82.8 3.1% 3.2%<br />
Egypt 10.0 10.6 11.0 11.5 11.6 12.2 14.7 18.3 21.5 22.7 25.0 10.1% 1.0%<br />
Libya 5.8 5.8 5.8 5.8 6.0 5.8 4.7 5.4 5.6 5.6 6.4 12.7% 0.2%<br />
Nigeria 4.9 4.4 4.8 5.4 5.1 5.1 6.0 12.5 14.9 14.2 19.2 35.2% 0.7%<br />
Other Africa 2.7 2.9 3.0 3.8 4.9 5.0 5.4 5.9 6.6 8.0 8.1 1.0% 0.3%<br />
Total Africa 79.4 75.3 83.3 88.9 99.4 104.8 116.9 126.6 126.8 130.9 141.4 8.1% 5.4%<br />
Australia 24.5 28.1 29.8 29.8 29.8 30.4 30.8 31.2 32.5 32.6 33.2 1.7% 1.3%<br />
Bangladesh 6.1 6.6 7.4 7.6 7.6 7.8 8.3 10.0 10.7 11.4 12.2 6.9% 0.5%<br />
Brunei 10.3 10.4 11.8 11.7 11.7 10.8 11.2 11.3 11.4 11.5 12.4 7.8% 0.5%<br />
China 16.2 16.6 17.6 19.9 22.2 22.3 24.3 27.2 30.3 31.9 34.1 6.8% 1.3%<br />
India 15.9 16.6 19.6 20.7 23.0 24.7 25.9 26.9 27.2 28.7 30.1 4.8% 1.1%<br />
Indonesia 55.9 62.5 63.4 67.5 67.2 64.3 71.0 68.5 66.3 70.4 72.6 3.2% 2.8%<br />
Malaysia 24.9 26.1 28.9 33.6 38.6 38.5 40.8 45.3 46.9 48.5 53.4 10.1% 2.0%<br />
Myanmar 1.0 1.3 1.5 1.6 1.8 1.8 2.6 4.4 6.2 6.5 6.9 7.2% 0.3%<br />
New Zealand 4.9 4.4 4.1 4.9 5.1 4.5 5.2 5.5 5.8 5.5 5.4 –2.2% 0.2%<br />
Pakistan 12.2 13.3 14.6 15.4 15.6 16.0 17.3 18.9 19.9 20.6 21.1 2.5% 0.8%<br />
Thailand 8.4 9.5 10.4 12.2 15.2 16.3 17.7 18.6 18.0 18.9 19.6 3.7% 0.7%<br />
Other Asia Pacific 3.5 3.7 3.6 3.7 3.9 4.3 4.7 5.1 5.7 7.8 9.6 22.8% 0.4%<br />
Total Asia Pacific 183.9 199.3 212.5 228.5 241.7 241.4 259.8 272.7 280.9 294.2 310.5 5.5% 11.9%<br />
TOTAL WORLD 2080.0 2101.0 2141.5 2235.0 2238.8 2288.7 2351.4 2433.0 2489.7 2532.4 2618.5 3.4% 100.0%<br />
of which: European Union 15 177.0 179.8 187.0 210.4 203.3 202.3 206.4 211.7 213.3 209.0 204.6 –2.1% 7.8%<br />
OECD 926.8 966.4 978.9 1026.2 1032.0 1046.4 1056.6 1077.4 1102.0 1091.0 1093.0 0.2% 41.7%<br />
Former Soviet Union 710.3 671.2 659.8 669.0 627.4 644.6 656.3 674.5 677.3 692.2 723.2 4.5% 27.6%<br />
Other EMEs 443.0 463.3 502.8 539.7 579.4 597.8 638.5 681.0 710.4 749.3 802.3 7.1% 30.6%<br />
*Excluding gas flared or recycled.<br />
Notes: As far as possible, the data above represents standard cubic metres (measured at 15ºC and 1013 mbar); as it is derived directly from tonnes of oil equivalent using an<br />
average conversion factor, it does not necessarily equate with gas volumes expressed in specific national terms.<br />
Because of rounding some totals may not agree exactly with the sum of their component parts.<br />
Natural gas production data expressed in billion feet per day is available at www.bp.com/statisticalreview2004<br />
22 <strong>BP</strong> 2004 Statistical Review of World Energy
Change 2003<br />
Production*<br />
2003 over share<br />
Million tonnes oil equivalent 1993 1994 1995 1996 1997 1998 1999 2000 2001 2002 2003 2002 of total<br />
USA 468.3 487.6 480.9 487.5 488.8 494.3 487.4 495.5 508.2 490.8 494.5 0.7% 21.0%<br />
Canada 125.1 134.2 142.8 147.3 149.2 154.1 159.7 164.9 168.1 169.0 162.5 –3.9% 6.9%<br />
Mexico 22.9 23.3 23.9 25.2 28.5 30.9 33.5 32.2 31.8 31.8 32.7 3.0% 1.4%<br />
Total North America 616.3 645.1 647.7 660.0 666.5 679.3 680.6 692.6 708.1 691.6 689.7 –0.3% 29.3%<br />
Argentina 19.4 20.0 22.5 26.0 24.6 26.6 31.1 33.7 33.4 32.5 36.9 13.7% 1.6%<br />
Bolivia 2.7 3.0 2.8 2.9 2.4 2.5 2.0 2.9 4.2 4.4 4.6 5.2% 0.2%<br />
Brazil 4.0 4.1 4.3 5.0 5.4 5.6 6.1 6.5 6.8 8.3 9.1 9.2% 0.4%<br />
Colombia 3.8 3.7 4.0 4.2 5.3 5.6 4.7 5.3 5.5 5.5 5.5 –1.5% 0.2%<br />
Trinidad & Tobago 5.3 5.6 5.5 6.4 6.7 7.8 10.6 12.6 13.7 15.6 22.3 43.4% 0.9%<br />
Venezuela 21.0 22.2 24.8 26.8 27.7 29.1 24.7 25.1 26.6 25.6 26.4 3.4% 1.1%<br />
Other S. & Cent. America 1.9 2.0 2.0 2.0 2.1 2.3 1.9 1.9 2.0 1.8 1.9 2.3% 0.1%<br />
Total S. & Cent. America 58.2 60.6 65.9 73.2 74.3 79.6 81.0 88.0 92.3 93.7 106.7 13.9% 4.5%<br />
Azerbaijan 5.7 5.4 5.5 5.3 5.0 4.7 5.0 4.7 4.7 4.3 4.3 –0.3% 0.2%<br />
Denmark 4.1 4.4 4.8 5.8 7.1 6.8 7.0 7.3 7.5 7.5 7.1 –5.3% 0.3%<br />
Germany 13.4 14.0 14.5 15.7 15.4 15.0 16.1 15.2 15.3 15.3 15.9 4.1% 0.7%<br />
Italy 17.5 18.6 18.3 18.0 17.3 17.1 15.7 14.6 13.7 13.2 12.4 –6.0% 0.5%<br />
Kazakhstan 5.6 3.8 5.0 5.5 6.8 6.7 8.4 9.7 9.7 9.5 11.7 22.7% 0.5%<br />
Netherlands 63.0 59.7 60.3 68.2 60.4 57.2 53.3 51.6 55.7 54.6 52.5 –3.8% 2.2%<br />
Norway 22.3 24.2 25.0 33.7 38.7 39.8 43.6 44.8 48.5 59.0 66.0 12.0% 2.8%<br />
Poland 3.3 3.1 3.1 3.2 3.2 3.2 3.1 3.3 3.5 3.6 3.6 1.2% 0.2%<br />
Romania 18.5 16.8 16.2 15.5 13.5 12.6 12.6 12.4 12.2 11.9 11.4 –4.4% 0.5%<br />
Russian Federation 518.8 509.8 499.9 505.0 479.3 496.2 495.9 490.5 488.2 499.9 520.8 4.2% 22.1%<br />
Turkmenistan 54.8 30.0 27.1 29.6 14.5 11.2 19.1 39.5 43.1 44.9 49.6 10.4% 2.1%<br />
Ukraine 16.1 15.3 15.3 15.4 15.7 15.1 15.2 15.0 15.4 15.7 16.0 1.8% 0.7%<br />
United Kingdom 54.5 58.2 63.7 75.8 77.3 81.2 89.2 97.6 95.3 93.3 92.5 –0.9% 3.9%<br />
Uzbekistan 37.8 39.6 40.8 41.1 43.0 46.0 46.7 47.4 48.2 48.4 48.3 –0.3% 2.0%<br />
Other Europe & Eurasia 14.6 14.0 14.1 12.6 12.0 11.1 10.3 10.1 10.1 10.0 9.6 –4.8% 0.4%<br />
Total Europe & Eurasia 850.0 816.7 813.6 850.3 809.1 823.9 841.3 863.5 871.0 891.0 921.5 3.4% 39.1%<br />
Bahrain 6.2 6.4 6.5 6.7 7.2 7.5 7.8 7.9 8.2 8.5 8.7 2.0% 0.4%<br />
Iran 24.4 28.6 31.8 35.1 42.3 45.0 50.7 54.2 59.4 67.5 71.1 5.3% 3.0%<br />
Kuwait 4.9 5.4 8.4 8.4 8.3 8.5 7.8 8.6 7.7 7.2 7.5 3.8% 0.3%<br />
Oman 2.5 2.6 3.6 3.9 4.5 4.7 4.9 7.8 12.6 13.5 14.9 10.0% 0.6%<br />
Qatar 12.2 12.2 12.2 12.3 15.7 17.6 19.8 21.3 24.3 26.6 27.7 4.4% 1.2%<br />
Saudi Arabia 36.0 38.5 38.6 40.0 40.8 42.1 41.6 44.8 48.3 51.0 54.9 7.6% 2.3%<br />
Syria 1.3 1.3 1.7 2.2 3.5 3.8 4.0 3.8 3.7 4.5 5.7 25.0% 0.2%<br />
United Arab Emirates 20.7 23.2 28.2 30.4 32.7 33.4 34.6 34.5 35.4 39.1 40.0 2.3% 1.7%<br />
Other Middle East 2.5 3.1 3.1 3.1 3.0 2.9 3.1 3.1 2.7 2.4 1.6 –32.7% 0.1%<br />
Total Middle East 110.6 121.3 134.0 142.2 157.9 165.6 174.4 186.1 202.3 220.2 231.9 5.3% 9.8%<br />
Algeria 50.5 46.5 52.8 56.1 64.6 68.9 77.4 76.0 70.4 72.3 74.5 3.1% 3.2%<br />
Egypt 9.0 9.5 9.9 10.4 10.5 11.0 13.2 16.5 19.3 20.4 22.5 10.1% 1.0%<br />
Libya 5.2 5.2 5.2 5.2 5.4 5.2 4.2 4.9 5.0 5.1 5.7 12.7% 0.2%<br />
Nigeria 4.4 4.0 4.4 4.9 4.6 4.6 5.4 11.3 13.4 12.8 17.3 35.2% 0.7%<br />
Other Africa 2.4 2.6 2.7 3.4 4.4 4.5 4.9 5.3 6.0 7.2 7.3 1.0% 0.3%<br />
Total Africa 71.4 67.8 75.0 80.0 89.5 94.3 105.2 114.0 114.2 117.8 127.3 8.1% 5.4%<br />
Australia 22.1 25.3 26.8 26.8 26.8 27.3 27.7 28.0 29.2 29.3 29.8 1.7% 1.3%<br />
Bangladesh 5.5 6.0 6.6 6.8 6.8 7.0 7.5 9.0 9.7 10.3 11.0 6.9% 0.5%<br />
Brunei 9.3 9.4 10.6 10.5 10.5 9.7 10.1 10.2 10.3 10.3 11.1 7.8% 0.5%<br />
China 14.6 14.9 15.8 17.9 20.0 20.1 21.9 24.5 27.3 28.7 30.7 6.8% 1.3%<br />
India 14.3 14.9 17.6 18.7 20.7 22.2 23.3 24.2 24.5 25.8 27.1 4.8% 1.1%<br />
Indonesia 50.3 56.2 57.0 60.7 60.4 57.8 63.9 61.7 59.7 63.3 65.3 3.2% 2.8%<br />
Malaysia 22.4 23.5 26.0 30.3 34.8 34.6 36.8 40.7 42.2 43.7 48.1 10.1% 2.0%<br />
Myanmar 0.9 1.2 1.3 1.5 1.6 1.6 2.4 3.9 5.6 5.8 6.2 7.2% 0.3%<br />
New Zealand 4.4 4.0 3.7 4.4 4.6 4.0 4.7 4.9 5.2 4.9 4.8 –2.2% 0.2%<br />
Pakistan 10.9 12.0 13.1 13.8 14.0 14.4 15.6 17.0 17.9 18.5 19.0 2.5% 0.8%<br />
Thailand 7.6 8.6 9.4 10.9 13.7 14.7 16.0 16.8 16.2 17.0 17.6 3.7% 0.7%<br />
Other Asia Pacific 3.2 3.3 3.2 3.4 3.6 3.9 4.2 4.6 5.1 7.0 8.6 22.8% 0.4%<br />
Total Asia Pacific 165.5 179.3 191.3 205.7 217.6 217.3 233.8 245.5 252.8 264.8 279.5 5.5% 11.9%<br />
TOTAL WORLD 1872.0 1890.9 1927.4 2011.5 2014.9 2059.9 2116.3 2189.7 2240.7 2279.2 2356.6 3.4% 100.0%<br />
of which: European Union 15 159.3 161.8 168.3 189.3 183.0 182.1 185.7 190.6 192.0 188.1 184.1 –2.1% 7.8%<br />
OECD 834.1 869.8 881.0 923.6 928.8 941.7 951.0 969.7 991.8 981.9 983.7 0.2% 41.7%<br />
Former Soviet Union 639.3 604.1 593.9 602.1 564.7 580.1 590.6 607.1 609.6 623.0 650.8 4.5% 27.6%<br />
Other EMEs 398.7 417.0 452.5 485.7 521.4 538.0 574.7 612.9 639.4 674.4 722.1 7.1% 30.6%<br />
*Excluding gas flared or recycled.<br />
Note: Because of rounding some totals may not agree exactly with the sum of their component parts.<br />
23
Natural gas<br />
Production by area<br />
Billion cubic metres<br />
3000<br />
2500<br />
2000<br />
1500<br />
1000<br />
500<br />
0 78 79 80 81 82 83 84 85 86 87 88 89 90 91 92 93 94 95 96 97 98 99 00 01 02 03<br />
North America Europe & Eurasia Asia Pacific Rest of World<br />
Gas production increased during 2003 in all regions apart from North America, where it declined for the second consecutive year. The fastest growth was in<br />
South & Central America, reflecting big increases in Trinidad & Tobago and Argentina.<br />
Reserves-to-production (R/P) ratios<br />
World<br />
70<br />
2003 by area<br />
300<br />
60<br />
250<br />
50<br />
200<br />
40<br />
150<br />
30<br />
100<br />
20<br />
10<br />
50<br />
0 81 83 85 87 89 91 93 95 97 99 01 03<br />
0<br />
World<br />
North America<br />
The world’s gas reserves-to-production ratio has risen over the last 20 years despite a 75% increase in gas production since 1983; it was over 67 years at the end<br />
of 2003.<br />
24 <strong>BP</strong> 2004 Statistical Review of World Energy<br />
S. & Cent. America Europe & Eurasia Middle East Africa Asia Pacific
Change 2003<br />
Consumption<br />
2003 over share<br />
Billion cubic metres 1993 1994 1995 1996 1997 1998 1999 2000 2001 2002 2003 2002 of total<br />
USA 597.9 611.6 638.0 649.6 653.2 642.2 644.3 669.7 640.1 661.9 629.8 –4.9% 24.3%<br />
Canada 76.8 78.8 80.2 85.3 83.8 85.0 83.1 83.0 82.8 85.6 87.4 2.2% 3.4%<br />
Mexico 26.5 27.0 28.1 28.6 32.3 35.4 37.4 38.5 39.0 42.7 45.4 6.3% 1.8%<br />
Total North America 701.2 717.4 746.3 763.4 769.3 762.6 764.8 791.2 762.0 790.2 762.6 –3.5% 29.4%<br />
Argentina 23.6 24.3 27.0 31.0 28.5 30.5 32.4 33.2 31.2 30.3 34.6 14.2% 1.3%<br />
Brazil 4.5 4.5 4.8 5.5 6.0 6.3 7.1 9.3 11.7 14.4 15.9 10.4% 0.6%<br />
Chile 1.6 1.7 1.6 1.7 2.8 3.3 4.6 5.2 6.3 6.5 7.0 7.4% 0.3%<br />
Colombia 4.2 4.2 4.4 4.7 5.9 6.2 5.2 5.9 6.1 6.1 6.0 –2.0% 0.2%<br />
Ecuador 0.1 0.1 0.1 0.1 0.1 0.1 0.1 0.1 0.2 0.1 0.1 –<br />
◆<br />
Peru 0.4 0.4 0.4 0.4 0.2 0.4 0.4 0.3 0.4 0.4 0.5 18.3%<br />
◆<br />
Venezuela 23.3 24.7 27.5 29.7 30.8 32.3 27.4 27.9 29.6 28.4 29.4 3.4% 1.1%<br />
Other S. & Cent. America 6.8 7.3 7.3 8.2 8.5 10.0 11.3 11.9 13.6 14.4 16.0 10.7% 0.6%<br />
Total S. & Cent. America 64.5 67.1 73.1 81.4 82.9 89.1 88.5 94.0 99.1 100.8 109.5 8.7% 4.2%<br />
Austria 6.4 6.5 6.8 7.3 7.7 7.6 7.7 7.3 7.8 7.7 8.6 11.3% 0.3%<br />
Azerbaijan 8.7 8.1 8.0 5.9 5.6 5.2 5.6 5.4 7.8 7.8 8.0 2.5% 0.3%<br />
Belarus 15.6 13.6 12.3 13.0 14.8 15.0 15.3 16.2 16.1 15.9 16.4 3.1% 0.6%<br />
Belgium & Luxembourg 11.0 10.8 11.8 13.1 12.5 13.8 14.7 14.9 14.6 14.8 16.0 8.0% 0.6%<br />
Bulgaria 4.1 4.1 5.0 5.2 4.1 3.5 3.0 3.3 3.0 2.9 2.9 – 0.1%<br />
Czech Republic 5.9 6.3 7.3 8.4 8.5 8.5 8.6 8.3 8.9 8.6 9.0 4.3% 0.3%<br />
Denmark 2.8 3.0 3.5 4.1 4.4 4.8 5.0 4.9 5.1 5.1 5.2 1.1% 0.2%<br />
Finland 2.8 3.1 3.2 3.3 3.2 3.7 3.7 3.7 4.1 4.0 4.5 11.2% 0.2%<br />
France 32.3 30.9 32.9 36.1 34.6 37.0 37.7 39.7 41.7 41.7 43.8 5.1% 1.7%<br />
Germany 66.4 67.9 74.4 83.6 79.2 79.7 80.2 79.5 82.9 82.6 85.5 3.6% 3.3%<br />
Greece 0.1 † † † 0.2 0.8 1.4 1.9 1.9 2.0 2.3 13.6% 0.1%<br />
Hungary 9.0 9.4 10.2 11.4 10.8 10.9 11.0 10.7 11.9 11.9 13.0 8.7% 0.5%<br />
Iceland – – – – – – – – – – – – –<br />
Republic of Ireland 2.4 2.4 2.6 3.0 3.1 3.1 3.3 3.8 4.0 4.1 4.1 –0.1% 0.2%<br />
Italy 46.8 45.3 49.9 51.5 53.2 57.2 62.2 64.9 65.0 65.6 71.7 9.3% 2.8%<br />
Kazakhstan 13.0 10.3 10.8 9.0 7.1 7.3 7.9 9.7 10.1 11.1 12.6 13.3% 0.5%<br />
Lithuania 1.7 2.0 2.3 2.5 2.6 2.3 2.4 2.7 2.8 2.9 3.1 8.2% 0.1%<br />
Netherlands 37.9 36.9 37.8 41.7 39.1 38.7 37.9 39.2 39.1 40.0 39.3 –1.9% 1.5%<br />
Norway 2.7 2.9 2.9 3.2 3.7 3.8 3.6 4.0 3.8 4.0 4.3 8.5% 0.2%<br />
Poland 9.0 9.2 9.9 10.6 10.5 10.6 10.3 11.1 11.5 11.2 12.5 11.3% 0.5%<br />
Portugal – – – – 0.1 0.8 2.3 2.4 2.6 2.8 3.0 7.8% 0.1%<br />
Romania 25.2 24.2 24.0 24.2 20.0 18.7 17.2 17.1 16.6 17.2 18.4 7.3% 0.7%<br />
Russian Federation 416.0 390.9 377.8 379.9 350.4 364.7 363.6 377.2 372.7 388.9 405.8 4.3% 15.7%<br />
Slovakia 5.2 5.0 5.7 6.2 6.3 6.4 6.4 6.5 6.9 7.2 7.1 –1.9% 0.3%<br />
Spain 6.5 7.2 8.3 9.3 12.3 13.1 15.0 16.9 18.2 20.8 23.8 14.4% 0.9%<br />
Sweden 0.8 0.8 0.8 0.9 0.8 0.9 0.8 0.7 0.7 0.8 0.8 –0.3%<br />
◆<br />
Switzerland 2.2 2.2 2.4 2.6 2.5 2.6 2.7 2.7 2.8 2.8 2.9 5.9% 0.1%<br />
Turkey 5.0 6.5 6.8 9.0 9.4 9.9 12.0 14.1 16.0 17.4 21.0 20.8% 0.8%<br />
Turkmenistan 9.3 10.2 8.0 10.0 10.1 10.3 11.3 12.6 12.9 13.2 14.6 10.6% 0.6%<br />
Ukraine 92.9 81.3 76.2 82.5 74.3 68.8 73.0 73.1 70.9 70.1 67.5 –3.6% 2.6%<br />
United Kingdom 64.2 66.1 70.5 82.1 84.5 87.9 92.5 96.8 96.3 95.1 95.3 0.2% 3.7%<br />
Uzbekistan 40.7 41.3 42.4 43.3 45.4 47.0 49.3 47.1 51.1 52.4 47.2 –10.0% 1.8%<br />
Other Europe & Eurasia 16.1 13.9 13.8 13.5 14.7 14.6 12.9 13.1 14.8 13.4 13.8 2.8% 0.5%<br />
Total Europe & Eurasia 962.7 922.2 928.3 976.4 935.6 959.1 980.5 1011.8 1024.5 1046.1 1084.1 3.6% 41.8%<br />
Iran 26.6 31.8 35.2 38.9 47.1 51.8 58.4 62.9 70.2 79.2 80.4 1.5% 3.1%<br />
Kuwait 5.4 6.0 9.3 9.3 9.3 9.5 8.6 9.6 9.5 8.0 8.3 3.8% 0.3%<br />
Qatar 13.5 13.5 13.5 13.7 14.5 14.8 14.0 9.7 11.0 11.1 11.6 4.5% 0.4%<br />
Saudi Arabia 40.0 42.8 42.9 44.4 45.3 46.8 46.2 49.8 53.7 56.7 61.0 7.6% 2.4%<br />
United Arab Emirates 19.6 21.7 24.8 27.2 29.0 30.4 31.4 31.4 32.3 36.4 37.5 2.9% 1.4%<br />
Other Middle East 13.9 14.9 16.1 17.3 19.6 20.5 21.5 22.1 23.0 22.6 23.9 5.5% 0.9%<br />
Total Middle East 119.0 130.6 141.8 150.7 164.9 173.7 180.1 185.4 199.6 214.1 222.7 4.0% 8.6%<br />
Algeria 18.6 19.6 21.0 21.6 20.2 20.9 21.3 19.8 20.5 20.2 21.4 5.9% 0.8%<br />
Egypt 9.7 10.4 11.0 11.3 11.6 12.0 14.3 18.3 21.5 22.7 24.6 8.5% 0.9%<br />
South Africa – – – – – – – – – – – – –<br />
Other Africa 11.6 11.9 12.8 14.3 14.4 14.9 15.3 17.0 17.1 18.8 20.7 10.5% 0.8%<br />
Total Africa 39.9 41.9 44.8 47.2 46.1 47.7 50.9 55.2 59.1 61.7 66.8 8.3% 2.6%<br />
Australia 18.5 19.6 20.4 20.7 21.4 22.4 23.2 23.6 24.0 25.2 26.3 4.5% 1.0%<br />
Bangladesh 6.1 6.6 7.4 7.6 7.6 7.8 8.3 10.0 10.7 11.4 12.2 6.9% 0.5%<br />
China 16.2 16.6 17.7 17.7 19.3 19.3 21.4 24.5 27.8 29.6 32.8 10.6% 1.3%<br />
China Hong Kong SAR – – † 1.7 2.6 2.5 2.7 2.5 2.5 2.4 1.5 –35.7% 0.1%<br />
India 15.9 16.6 19.6 20.7 23.0 24.7 25.9 26.9 27.2 28.7 30.1 4.8% 1.2%<br />
Indonesia 24.1 27.3 30.1 32.2 31.9 27.8 31.8 32.3 33.5 34.5 35.6 3.2% 1.4%<br />
Japan 56.3 60.3 61.2 66.1 65.1 69.5 74.6 76.2 79.0 71.9 76.5 6.5% 3.0%<br />
Malaysia 13.0 13.6 13.7 17.8 16.7 17.4 16.1 24.3 25.8 26.8 28.4 6.1% 1.1%<br />
New Zealand 4.7 4.4 4.2 4.7 5.1 4.5 5.2 5.5 5.7 5.5 4.6 –16.2% 0.2%<br />
Pakistan 12.2 13.3 14.6 15.4 15.6 16.0 17.3 18.9 19.9 20.6 21.1 2.5% 0.8%<br />
Philippines – † † † † † † † 0.1 1.8 2.7 52.4% 0.1%<br />
Singapore 1.5 1.5 1.5 1.5 1.5 1.5 1.5 1.7 4.5 4.9 5.3 8.6% 0.2%<br />
South Korea 6.4 8.5 10.2 13.5 16.4 15.4 18.7 21.0 23.1 25.7 26.9 4.7% 1.0%<br />
Taiwan 3.1 4.0 4.3 4.5 5.1 6.4 6.2 6.9 7.4 8.5 8.7 2.1% 0.3%<br />
Thailand 8.4 9.5 10.0 11.8 14.6 15.9 17.4 20.5 22.5 24.4 26.6 9.1% 1.0%<br />
Other Asia Pacific 3.1 3.3 3.4 3.7 4.2 4.5 4.8 4.9 5.0 5.2 6.1 17.6% 0.2%<br />
Total Asia Pacific 189.3 205.2 218.2 239.7 250.1 255.4 275.1 299.6 318.9 327.0 345.5 5.7% 13.3%<br />
TOTAL WORLD 2076.6 2084.3 2152.6 2258.8 2248.9 2287.7 2339.8 2437.2 2463.1 2539.8 2591.0 2.0% 100.0%<br />
of which: European Union 15 280.3 280.9 302.4 336.1 334.8 349.2 364.3 376.6 383.9 387.2 403.9 4.3% 15.6%<br />
OECD 1106.5 1132.6 1190.0 1256.0 1263.9 1276.1 1305.5 1351.7 1339.6 1368.7 1370.6 0.1% 52.9%<br />
Former Soviet Union 609.0 567.0 547.0 553.9 519.1 529.4 536.2 551.9 553.1 569.9 582.7 2.3% 22.5%<br />
Other EMEs 361.2 384.7 415.6 448.9 466.0 482.1 498.2 533.7 570.5 601.2 637.8 6.1% 24.6%<br />
†Less than 0.05.<br />
◆ Less than 0.05%.<br />
Notes: The difference between these world consumption figures and the world production statistics on page 22 is due to variations in stocks at storage facilities and liquefaction<br />
plants, together with unavoidable disparities in the definition, measurement or conversion of gas supply and demand data.<br />
As far as possible, the data above represents standard cubic metres (measured at 15ºC and 1013 mbar); as it is derived directly from tonnes of oil equivalent using an average<br />
conversion factor, it does not necessarily equate with gas volumes expressed in specific national terms.<br />
Natural gas consumption data expressed in billion cubic feet per day is available at www.bp.com/statisticalreview2004<br />
25
Natural gas<br />
Change 2003<br />
Consumption<br />
2003 over share<br />
Million tonnes oil equivalent 1993 1994 1995 1996 1997 1998 1999 2000 2001 2002 2003 2002 of total<br />
USA 538.1 550.5 574.2 584.6 587.9 578.0 579.9 602.7 576.1 595.7 566.8 –4.9% 24.3%<br />
Canada 69.1 70.9 72.2 76.7 75.4 76.5 74.8 74.7 74.5 77.0 78.7 2.2% 3.4%<br />
Mexico 23.9 24.3 25.3 25.7 29.1 31.9 33.6 34.6 35.1 38.4 40.8 6.3% 1.8%<br />
Total North America 631.1 645.6 671.7 687.1 692.4 686.4 688.3 712.1 685.8 711.2 686.3 –3.5% 29.4%<br />
Argentina 21.2 21.8 24.3 27.9 25.7 27.5 29.1 29.9 28.1 27.2 31.1 14.2% 1.3%<br />
Brazil 4.0 4.1 4.3 5.0 5.4 5.6 6.4 8.4 10.5 13.0 14.3 10.4% 0.6%<br />
Chile 1.4 1.5 1.5 1.5 2.5 2.9 4.1 4.7 5.7 5.9 6.3 7.4% 0.3%<br />
Colombia 3.8 3.7 4.0 4.2 5.3 5.6 4.7 5.3 5.5 5.5 5.4 –2.0% 0.2%<br />
Ecuador 0.1 0.1 0.1 0.1 0.1 0.1 0.1 0.1 0.1 0.1 0.1 –<br />
◆<br />
Peru 0.4 0.4 0.4 0.4 0.2 0.4 0.4 0.3 0.3 0.4 0.5 18.3%<br />
◆<br />
Venezuela 21.0 22.2 24.8 26.8 27.7 29.1 24.7 25.1 26.6 25.6 26.4 3.4% 1.1%<br />
Other S. & Cent. America 6.1 6.5 6.5 7.4 7.7 9.0 10.2 10.7 12.2 13.0 14.4 10.7% 0.6%<br />
Total S. & Cent. America 58.1 60.4 65.8 73.2 74.6 80.2 79.6 84.6 89.2 90.7 98.6 8.7% 4.2%<br />
Austria 5.7 5.8 6.1 6.6 6.9 6.8 6.9 6.6 7.0 7.0 7.7 11.3% 0.3%<br />
Azerbaijan 7.8 7.3 7.2 5.3 5.0 4.7 5.0 4.9 7.0 7.0 7.2 2.5% 0.3%<br />
Belarus 14.0 12.3 11.1 11.7 13.3 13.5 13.8 14.6 14.5 14.3 14.8 3.1% 0.6%<br />
Belgium & Luxembourg 9.9 9.7 10.6 11.8 11.3 12.4 13.3 13.4 13.2 13.4 14.4 8.0% 0.6%<br />
Bulgaria 3.7 3.7 4.5 4.6 3.7 3.1 2.7 2.9 2.7 2.6 2.6 – 0.1%<br />
Czech Republic 5.3 5.7 6.5 7.6 7.7 7.7 7.7 7.5 8.0 7.8 8.1 4.3% 0.3%<br />
Denmark 2.5 2.7 3.1 3.7 3.9 4.3 4.5 4.4 4.6 4.6 4.7 1.1% 0.2%<br />
Finland 2.6 2.8 2.9 3.0 2.9 3.3 3.3 3.4 3.7 3.6 4.0 11.2% 0.2%<br />
France 29.0 27.8 29.6 32.5 31.2 33.3 33.9 35.7 37.5 37.5 39.4 5.1% 1.7%<br />
Germany 59.8 61.1 67.0 75.2 71.3 71.7 72.1 71.5 74.6 74.3 77.0 3.6% 3.3%<br />
Greece 0.1 † † † 0.2 0.7 1.2 1.7 1.7 1.8 2.1 13.6% 0.1%<br />
Hungary 8.1 8.4 9.2 10.2 9.7 9.8 9.9 9.7 10.7 10.7 11.7 8.7% 0.5%<br />
Iceland – – – – – – – – – – – – –<br />
Republic of Ireland 2.2 2.2 2.3 2.7 2.8 2.8 3.0 3.4 3.6 3.7 3.7 –0.1% 0.2%<br />
Italy 42.1 40.8 44.9 46.4 47.9 51.5 56.0 58.4 58.5 59.0 64.5 9.3% 2.8%<br />
Kazakhstan 11.7 9.2 9.7 8.1 6.4 6.5 7.1 8.7 9.1 10.0 11.3 13.3% 0.5%<br />
Lithuania 1.5 1.8 2.1 2.3 2.4 2.1 2.2 2.5 2.5 2.6 2.8 8.2% 0.1%<br />
Netherlands 34.1 33.2 34.0 37.5 35.2 34.9 34.1 35.3 35.2 36.0 35.4 –1.9% 1.5%<br />
Norway 2.4 2.6 2.7 2.9 3.3 3.4 3.2 3.6 3.4 3.6 3.9 8.5% 0.2%<br />
Poland 8.1 8.2 8.9 9.5 9.4 9.5 9.3 10.0 10.4 10.1 11.3 11.3% 0.5%<br />
Portugal – – – – 0.1 0.7 2.0 2.1 2.3 2.5 2.7 7.8% 0.1%<br />
Romania 22.7 21.8 21.6 21.8 18.0 16.8 15.5 15.4 14.9 15.5 16.6 7.3% 0.7%<br />
Russian Federation 374.4 351.8 340.0 341.9 315.3 328.3 327.3 339.5 335.4 350.0 365.2 4.3% 15.7%<br />
Slovakia 4.6 4.5 5.1 5.5 5.6 5.7 5.8 5.8 6.2 6.5 6.4 –1.9% 0.3%<br />
Spain 5.8 6.5 7.5 8.4 11.1 11.8 13.5 15.2 16.4 18.8 21.5 14.4% 0.9%<br />
Sweden 0.7 0.7 0.7 0.8 0.7 0.8 0.8 0.7 0.6 0.7 0.7 –0.3%<br />
◆<br />
Switzerland 2.0 2.0 2.2 2.4 2.3 2.4 2.4 2.4 2.5 2.5 2.6 5.9% 0.1%<br />
Turkey 4.5 5.9 6.2 8.1 8.5 8.9 10.8 12.7 14.4 15.6 18.9 20.8% 0.8%<br />
Turkmenistan 8.4 9.2 7.2 9.0 9.1 9.2 10.2 11.3 11.6 11.9 13.2 10.6% 0.6%<br />
Ukraine 83.6 73.2 68.6 74.2 66.8 61.9 65.7 65.8 63.8 63.1 60.8 –3.6% 2.6%<br />
United Kingdom 57.8 59.5 63.5 73.9 76.0 79.1 83.2 87.1 86.7 85.6 85.7 0.2% 3.7%<br />
Uzbekistan 36.6 37.2 38.1 39.0 40.9 42.3 44.3 42.4 46.0 47.2 42.5 –10.0% 1.8%<br />
Other Europe & Eurasia 14.5 12.5 12.4 12.2 13.2 13.1 11.6 11.8 13.3 12.0 12.4 2.8% 0.5%<br />
Total Europe & Eurasia 866.4 830.0 835.5 878.8 842.0 863.2 882.5 910.6 922.1 941.5 975.7 3.6% 41.8%<br />
Iran 23.9 28.6 31.7 35.0 42.4 46.6 52.5 56.6 63.2 71.3 72.4 1.5% 3.1%<br />
Kuwait 4.9 5.4 8.4 8.4 8.3 8.5 7.8 8.6 8.6 7.2 7.5 3.8% 0.3%<br />
Qatar 12.2 12.2 12.2 12.3 13.1 13.3 12.6 8.7 9.9 10.0 10.4 4.5% 0.4%<br />
Saudi Arabia 36.0 38.5 38.6 40.0 40.8 42.1 41.6 44.8 48.3 51.0 54.9 7.6% 2.4%<br />
United Arab Emirates 17.7 19.5 22.3 24.4 26.1 27.4 28.3 28.3 29.1 32.8 33.7 2.9% 1.4%<br />
Other Middle East 12.5 13.4 14.5 15.6 17.7 18.5 19.4 19.9 20.7 20.3 21.5 5.5% 0.9%<br />
Total Middle East 107.1 117.6 127.6 135.7 148.4 156.4 162.1 166.9 179.7 192.7 200.4 4.0% 8.6%<br />
Algeria 16.7 17.6 18.9 19.4 18.1 18.8 19.2 17.9 18.5 18.2 19.3 5.9% 0.8%<br />
Egypt 8.7 9.4 9.9 10.2 10.4 10.8 12.9 16.5 19.3 20.4 22.1 8.5% 0.9%<br />
South Africa – – – – – – – – – – – – –<br />
Other Africa 10.5 10.7 11.5 12.9 12.9 13.4 13.7 15.3 15.4 16.9 18.7 10.5% 0.8%<br />
Total Africa 35.9 37.7 40.3 42.5 41.5 42.9 45.8 49.7 53.2 55.5 60.1 8.3% 2.6%<br />
Australia 16.7 17.7 18.4 18.7 19.3 20.1 20.9 21.3 21.6 22.7 23.7 4.5% 1.0%<br />
Bangladesh 5.5 6.0 6.6 6.8 6.8 7.0 7.5 9.0 9.7 10.3 11.0 6.9% 0.5%<br />
China 14.6 14.9 15.9 15.9 17.4 17.4 19.3 22.1 25.0 26.7 29.5 10.6% 1.3%<br />
China Hong Kong SAR – – † 1.5 2.4 2.2 2.4 2.2 2.2 2.1 1.4 –35.7% 0.1%<br />
India 14.3 14.9 17.6 18.7 20.7 22.2 23.3 24.2 24.5 25.8 27.1 4.8% 1.2%<br />
Indonesia 21.7 24.6 27.0 29.0 28.7 25.0 28.7 29.1 30.1 31.1 32.0 3.2% 1.4%<br />
Japan 50.7 54.3 55.0 59.5 58.6 62.5 67.1 68.6 71.1 64.7 68.9 6.5% 3.0%<br />
Malaysia 11.7 12.3 12.4 16.0 15.0 15.7 14.5 21.9 23.2 24.1 25.6 6.1% 1.1%<br />
New Zealand 4.3 4.0 3.7 4.3 4.6 4.0 4.7 4.9 5.2 4.9 4.1 –16.2% 0.2%<br />
Pakistan 10.9 12.0 13.1 13.8 14.0 14.4 15.6 17.0 17.9 18.5 19.0 2.5% 0.8%<br />
Philippines – † † † † † † † 0.1 1.6 2.4 52.4% 0.1%<br />
Singapore 1.4 1.4 1.4 1.4 1.4 1.4 1.4 1.6 4.1 4.4 4.8 8.6% 0.2%<br />
South Korea 5.7 7.6 9.2 12.2 14.8 13.8 16.8 18.9 20.8 23.1 24.2 4.7% 1.0%<br />
Taiwan 2.7 3.6 3.9 4.0 4.6 5.7 5.6 6.2 6.7 7.7 7.8 2.1% 0.3%<br />
Thailand 7.6 8.6 9.0 10.7 13.1 14.3 15.6 18.4 20.3 21.9 23.9 9.1% 1.0%<br />
Other Asia Pacific 2.7 2.9 3.0 3.4 3.8 4.1 4.4 4.4 4.5 4.7 5.5 17.6% 0.2%<br />
Total Asia Pacific 170.4 184.7 196.4 215.7 225.1 229.9 247.6 269.7 287.0 294.3 310.9 5.7% 13.3%<br />
TOTAL WORLD 1869.0 1875.9 1937.3 2033.0 2024.0 2058.9 2105.9 2193.5 2216.8 2285.8 2331.9 2.0% 100.0%<br />
of which: European Union 15 252.3 252.8 272.2 302.5 301.4 314.3 327.9 339.0 345.5 348.5 363.5 4.3% 15.6%<br />
OECD 995.8 1019.3 1071.0 1130.4 1137.5 1148.5 1174.9 1216.5 1205.6 1231.8 1233.5 0.1% 52.9%<br />
Former Soviet Union 548.1 510.3 492.3 498.5 467.1 476.5 482.6 496.7 497.8 512.9 524.4 2.3% 22.5%<br />
Other EMEs 325.0 346.3 374.0 404.0 419.4 433.9 448.4 480.3 513.4 541.1 574.0 6.1% 24.6%<br />
†Less than 0.05.<br />
◆ Less than 0.05%.<br />
Note: The difference between these world consumption figures and the world production statistics on page 23 is due to variations in stocks at storage facilities and liquefaction<br />
plants, together with unavoidable disparities in the definition, measurement or conversion of gas supply and demand data.<br />
26 <strong>BP</strong> 2004 Statistical Review of World Energy
Consumption by area<br />
Billion cubic metres<br />
3000<br />
2500<br />
2000<br />
1500<br />
1000<br />
500<br />
0 78 79 80 81 82 83 84 85 86 87 88 89 90 91 92 93 94 95 96 97 98 99 00 01 02 03<br />
North America Europe & Eurasia Asia Pacific Rest of World<br />
Global gas consumption growth was slightly below trend in 2003 at 2%. Growth was robust outside North America, where consumption declined by a steep 3.5%.<br />
27
Natural gas<br />
Trade movements 2003 – by pipeline<br />
Billion cubic metres<br />
From<br />
Argen- Bel- Den- Ger- Nether- RussianTurkmen- Indo- Malay- Myan- Total<br />
To USA Canada tina Bolivia Austria gium mark France many lands Norway UK Fed. istan Iran Oman Algeria nesia sia mar imports<br />
North America<br />
USA – 98.60 – – – – – – – – – – – – – – – – – – 98.60<br />
Canada 7.82 – – – – – – – – – – – – – – – – – – – 7.82<br />
Mexico 9.00 – – – – – – – – – – – – – – – – – – – 9.00<br />
S. & Cent. America<br />
Brazil – – 0.68 4.90 – – – – – – – – – – – – – – – – 5.58<br />
Chile – – 5.75 – – – – – – – – – – – – – – – – – 5.75<br />
Uruguay – – 0.03 – – – – – – – – – – – – – – – – – 0.03<br />
Europe<br />
Austria – – – – – – – – 0.90 – 0.90 – 5.60 – – – – – – – 7.40<br />
Belgium – – – – – – – – 1.20 5.90 5.85 1.70 – – – – – – – – 14.65<br />
Bulgaria – – – – – – – – – – – – 2.80 – – – – – – – 2.80<br />
Croatia – – – – – – – – – – – – 1.14 – – – – – – – 1.14<br />
Czech Republic – – – – – – – – – – 2.62 – 7.11 – – – – – – – 9.73<br />
Finland – – – – – – – – – – – – 4.84 – – – – – – – 4.84<br />
France – – – – – 0.70 – – – 6.80 13.30 1.30 9.70 – – – – – – – 31.80<br />
Germany – – – – – – 2.51 – – 20.53 26.41 4.10 33.21 – – – – – – – 86.76<br />
Greece – – – – – – – – – – – – 1.50 – – – – – – – 1.50<br />
Hungary – – – – 0.40 – – 0.40 0.69 – – – 8.81 – – – – – – – 10.30<br />
Ireland – – – – – – – – – – – 3.70 – – – – – – – – 3.70<br />
Italy – – – – – 0.30 – – – 7.44 7.00 – 19.73 – – – 21.45 – – – 55.92<br />
Luxembourg – – – – – 0.60 – – 0.60 – – – – – – – – – – – 1.20<br />
Netherlands – – – – – – – – 4.23 – 2.90 4.40 1.40 – – – – – – – 12.93<br />
Poland – – – – – – – – 0.42 – 0.49 – 7.70 – – – – – – – 8.61<br />
Portugal – – – – – – – – – – – – – – – – 2.50 – – – 2.50<br />
Romania – – – – – – – – 0.50 – – – 5.30 – – – – – – – 5.80<br />
Slovakia – – – – – – – – – – – – 7.30 – – – – – – – 7.30<br />
Slovenia – – – – – – – – – – – – 0.66 – – – 0.44 – – – 1.10<br />
Spain – – – – – – – – – – 2.29 – – – – – 6.40 – – – 8.69<br />
Sweden – – – – – – 1.05 0.20 – – – – – – – – – – – 1.25<br />
Switzerland – – – – – – – 0.37 1.20 1.00 – – 0.35 – – – – – – – 2.92<br />
Turkey – – – – – – – – – – – – 12.67 – 3.52 – – – – – 16.19<br />
United Kingdom – – – – – – – – 0.40 0.50 6.61 – – – – – – – – – 7.51<br />
Others – – – – – – – – – – – – 1.95 – – – – – – – 1.95<br />
Middle East<br />
Iran – – – – – – – – – – – – – 4.92 – – – – – – 4.92<br />
United Arab Emirates – – – – – – – – – – – – – – – 0.20 – – – – 0.20<br />
Africa<br />
Morocco – – – – – – – – – – – – – – – – 0.60 – – – 0.60<br />
Tunisia – – – – – – – – – – – – – – – – 1.69 – – – 1.69<br />
Asia Pacific<br />
Singapore – – – – – – – – – – – – – – – – – 3.74 1.58 – 5.32<br />
Thailand – – – – – – – – – – – – – – – – – – – 6.87 6.87<br />
TOTAL EXPORTS 16.82 98.60 6.46 4.90 0.40 1.60 3.56 0.77 10.34 42.17 68.37 15.20 131.77 4.92 3.52 0.20 33.08 3.74 1.58 6.87 454.87<br />
Notes: Flows are on a contractual basis and may not correspond to physical gas flows in all cases.<br />
Data excludes trade within the Former Soviet Union.<br />
Source: Cedigaz (provisional).<br />
Trade movements 2003 – LNG*<br />
Billion cubic metres<br />
From<br />
Trinidad<br />
Total<br />
To USA & Tobago Oman Qatar UAE Algeria Libya Nigeria Australia Brunei Indonesia Malaysia imports<br />
North America<br />
USA – 10.71 0.24 0.39 – 1.51 – 1.42 – – – 0.08 14.35<br />
S. & Cent. America<br />
Dominican Republic – 0.30 – – – – – – – – – – 0.30<br />
Puerto Rico – 0.74 – – – – – – – – – – 0.74<br />
Europe<br />
Belgium – – – – – 3.15 – – – – – – 3.15<br />
France – – – – – 9.20 – 0.67 – – – – 9.87<br />
Greece – – – – – 0.55 – – – – – – 0.55<br />
Italy – – – – – 2.02 – 3.50 – – – – 5.52<br />
Portugal – – – – – – – 0.85 – – – – 0.85<br />
Spain – 0.08 0.32 1.87 0.24 7.48 0.75 4.22 0.08 – – – 15.04<br />
Turkey – – – – – 3.86 – 1.13 – – – – 4.99<br />
Asia Pacific<br />
Japan 1.64 0.08 2.16 9.05 6.87 – – – 10.27 8.93 24.05 16.72 79.77<br />
South Korea – – 6.49 7.88 – 0.23 – – 0.17 0.74 6.93 3.79 26.23<br />
Taiwan – – – – – – – – – – 4.68 2.80 7.48<br />
TOTAL EXPORTS 1.64 11.91 9.21 19.19 7.11 28.00 0.75 11.79 10.52 9.67 35.66 23.39 168.84<br />
*Liquefied natural gas.<br />
Note: Flows are on a contractual basis and may not correspond to physical gas flows in all cases.<br />
Source: Cedigaz (provisional).<br />
28 <strong>BP</strong> 2004 Statistical Review of World Energy
Major trade movements<br />
Trade flows worldwide (billion cubic metres)<br />
76.33<br />
40.82 12.67<br />
65.26<br />
7.82<br />
9.00<br />
98.60<br />
10.71<br />
15.20<br />
22.40<br />
6.40<br />
20.53<br />
21.45<br />
3.86<br />
4.92<br />
9.05<br />
7.88<br />
6.87<br />
6.49 16.72<br />
3.79<br />
6.87<br />
2.80<br />
8.93<br />
4.68<br />
6.93<br />
24.05<br />
10.27<br />
9.24<br />
4.90<br />
USA<br />
Canada<br />
Mexico<br />
S. & Cent. America<br />
Europe & Eurasia<br />
Middle East<br />
Africa<br />
Asia Pacific<br />
Natural gas<br />
LNG<br />
5.75<br />
LNG Natural gas Crude oil<br />
Prices<br />
Japan European UK USA Canada OECD<br />
US dollars per million Btu cif Union cif (Heren N<strong>BP</strong> index)† Henry Hub‡ (Alberta)‡ countries cif<br />
1984 – 3.76 – – – 5.00<br />
1985 5.23 3.83 – – – 4.75<br />
1986 4.10 3.65 – – – 2.57<br />
1987 3.35 2.59 – – – 3.09<br />
1988 3.34 2.36 – – – 2.56<br />
1989 3.28 2.09 – 1.70 – 3.01<br />
1990 3.64 2.82 – 1.64 1.05 3.82<br />
1991 3.99 3.18 – 1.49 0.89 3.33<br />
1992 3.62 2.76 – 1.77 0.98 3.19<br />
1993 3.52 2.53 – 2.12 1.69 2.82<br />
1994 3.18 2.24 – 1.92 1.45 2.70<br />
1995 3.46 2.37 – 1.69 0.89 2.96<br />
1996 3.66 2.43 1.85 2.76 1.12 3.54<br />
1997 3.91 2.65 2.03 2.53 1.36 3.29<br />
1998 3.05 2.26 1.92 2.08 1.42 2.16<br />
1999 3.14 1.80 1.64 2.27 2.00 2.98<br />
2000 4.72 3.25 2.68 4.23 3.75 4.83<br />
2001 4.64 4.15 3.22 4.07 3.61 4.08<br />
2002 4.27 3.46 2.58 3.33 2.57 4.17<br />
2003 4.77 4.40 3.26 5.63 4.83 4.89<br />
†Source: Heren Energy Ltd.<br />
‡Source: Natural Gas Week.<br />
Note: cif = cost+insurance+freight (average prices).<br />
29
Coal<br />
Anthracite Suband<br />
bituminous Share<br />
Proved reserves at end 2003<br />
Million tonnes bituminous and Lignite Total of total R/P ratio<br />
USA 115891 134103 249994 25.4% 258<br />
Canada 3471 3107 6578 0.7% 106<br />
Mexico 860 351 1211 0.1% 115<br />
Total North America 120222 137561 257783 26.2% 247<br />
Brazil – 11929 11929 1.2% *<br />
Colombia 6267 381 6648 0.7% 135<br />
Venezuela 479 – 479<br />
◆<br />
70<br />
Other S. & Cent. America 992 1704 2696 0.3% *<br />
Total S. & Cent. America 7738 14014 21752 2.2% 354<br />
Bulgaria 13 2698 2711 0.3% 99<br />
Czech Republic 2114 3564 5678 0.6% 89<br />
France 22 14 36<br />
◆<br />
16<br />
Germany 23000 43000 66000 6.7% 322<br />
Greece – 2874 2874 0.3% 38<br />
Hungary – 1097 1097 0.1% 83<br />
Kazakhstan 31000 3000 34000 3.5% 401<br />
Poland 20300 1860 22160 2.3% 136<br />
Romania 1 1456 1457 0.1% 44<br />
Russian Federation 49088 107922 157010 15.9% *<br />
Spain 200 460 660 0.1% 31<br />
Turkey 278 3411 3689 0.4% 75<br />
Ukraine 16274 17879 34153 3.5% 426<br />
United Kingdom 1000 500 1500 0.2% 53<br />
Other Europe & Eurasia 1584 20761 22345 2.3% 357<br />
Total Europe & Eurasia 144874 210496 355370 36.1% 300<br />
South Africa 49520 – 49520 5.0% 207<br />
Zimbabwe 502 – 502 0.1% 167<br />
Other Africa 5149 196 5345 0.5% *<br />
Middle East 1710 – 1710 0.2% *<br />
Total Africa & Middle East 56881 196 57077 5.8% 233<br />
Australia 42550 39540 82090 8.3% 236<br />
China 62200 52300 114500 11.6% 69<br />
India 82396 2000 84396 8.6% 230<br />
Indonesia 790 4580 5370 0.5% 47<br />
Japan 773 – 773 0.1% *<br />
New Zealand 33 539 572 0.1% 111<br />
North Korea 300 300 600 0.1% 19<br />
Pakistan – 2265 2265 0.2% *<br />
South Korea 78 – 78<br />
◆<br />
24<br />
Thailand – 1268 1268 0.1% 68<br />
Vietnam 150 – 150<br />
◆<br />
8<br />
Other Asia Pacific 77 332 409<br />
◆<br />
53<br />
Total Asia Pacific 189347 103124 292471 29.7% 113<br />
TOTAL WORLD 519062 465391 984453 100.0% 192<br />
of which: OECD 211084 234686 445770 45.3% 220<br />
Former Soviet Union 97362 132613 229975 23.4% *<br />
Other EMEs 210616 98092 308708 31.4% 117<br />
*More than 500 years.<br />
◆ Less than 0.05%.<br />
Notes:<br />
Proved reserves of coal – Generally taken to be those quantities that geological and engineering information indicates with reasonable certainty can be recovered in the future<br />
from known deposits under existing economic and operating conditions.<br />
Reserves-to-production (R/P) ratio – If the reserves remaining at the end of the year are divided by the production in that year, the result is the length of time that those remaining<br />
reserves would last if production were to continue at that level.<br />
Source of reserves data – World Energy Council.<br />
Marker Price Price of US coal receipts Japan coking Japan steam<br />
Prices<br />
(basis Northwest at steam-electric coal import coal import<br />
US dollars per tonne Europe)* utility plants cif price cif price<br />
1989 42.08 33.29 58.68 48.86<br />
1990 43.48 33.33 60.54 50.81<br />
1991 42.80 33.06 60.45 50.30<br />
1992 38.53 32.23 57.82 48.45<br />
1993 33.68 31.57 55.26 45.71<br />
1994 37.18 30.75 51.77 43.66<br />
1995 44.50 29.85 54.47 47.58<br />
1996 41.25 29.19 56.68 49.54<br />
1997 38.92 28.79 55.51 45.53<br />
1998 32.00 28.31 50.76 40.51<br />
1999 28.79 27.46 42.83 35.74<br />
2000 35.99 27.13 39.69 34.58<br />
2001 39.29 27.54 41.33 37.96<br />
2002 31.65 28.33 42.01 36.90<br />
2003 42.52 28.62 41.57 34.67<br />
*Source of Marker Price: McCloskey Coal Information Service.<br />
Note: cif = cost+insurance+freight (average prices).<br />
30 <strong>BP</strong> 2004 Statistical Review of World Energy
Proved reserves at end 2003<br />
Thousand million tonnes (share of anthracite and bituminous coal is shown in brackets)<br />
Europe & Eurasia<br />
355.4 (144.9)<br />
Asia Pacific<br />
292.5 (189.3)<br />
North America<br />
257.8 (120.2)<br />
Africa<br />
55.4 (55.2)<br />
Middle East<br />
1.7 (1.7)<br />
S. & Cent. America<br />
21.8 (7.7)<br />
Production<br />
Million tonnes oil equivalent<br />
1500<br />
1400<br />
1300<br />
1200<br />
1100<br />
1000<br />
900<br />
800<br />
700<br />
600<br />
500<br />
400<br />
300<br />
200<br />
100<br />
Consumption<br />
Million tonnes oil equivalent<br />
1500<br />
1400<br />
1300<br />
1200<br />
1100<br />
1000<br />
900<br />
800<br />
700<br />
600<br />
500<br />
400<br />
300<br />
200<br />
100<br />
0<br />
North<br />
America<br />
S. & Cent.<br />
America<br />
Europe &<br />
Eurasia<br />
Africa &<br />
Middle East<br />
Asia<br />
Pacific<br />
1993 production 2003 production<br />
1993 consumption 2003 consumption<br />
The strong gains of recent years mean that global coal consumption has risen by an average 1.7% per annum over the last 10 years. The fastest growth has been<br />
in Asia Pacific (3.7% p.a.). 2003 was the first year on record that North America consumed more coal than it produced.<br />
0<br />
North<br />
America<br />
S. & Cent.<br />
America<br />
Europe &<br />
Eurasia<br />
Africa &<br />
Middle East<br />
Asia<br />
Pacific<br />
31
Coal<br />
Change 2003<br />
Production*<br />
2003 over share<br />
Million tonnes oil equivalent 1993 1994 1995 1996 1997 1998 1999 2000 2001 2002 2003 2002 of total<br />
USA 506.2 552.8 550.7 567.1 580.3 598.4 579.7 565.6 576.3 564.1 551.3 –2.3% 21.9%<br />
Canada 37.5 39.4 40.8 41.6 43.0 40.8 39.2 37.1 37.6 35.6 33.3 –6.6% 1.3%<br />
Mexico 3.1 4.3 4.1 4.6 4.5 4.8 4.9 5.4 5.4 5.2 5.0 –4.4% 0.2%<br />
Total North America 546.9 596.5 595.7 613.2 627.8 644.0 623.8 608.1 619.4 604.9 589.6 –2.5% 23.4%<br />
Brazil 1.8 2.0 2.0 1.8 2.1 2.0 2.1 2.9 2.1 1.9 1.9 –4.7% 0.1%<br />
Colombia 14.1 14.7 16.7 19.5 21.0 21.9 21.3 24.8 28.5 25.7 32.1 24.9% 1.3%<br />
Venezuela 2.9 3.2 3.2 3.1 3.9 4.7 4.8 5.6 5.5 5.7 5.0 –13.4% 0.2%<br />
Other S. & Cent. America 1.2 1.3 1.2 1.2 1.1 0.4 0.5 0.5 0.5 0.3 0.3 3.2%<br />
◆<br />
Total S. & Cent. America 20.0 21.3 23.1 25.6 28.1 29.1 28.7 33.8 36.7 33.6 39.2 16.5% 1.6%<br />
Bulgaria 4.9 4.8 5.2 5.2 4.9 5.0 4.3 4.4 4.4 4.5 4.5 1.9% 0.2%<br />
Czech Republic 30.8 28.1 27.3 27.0 27.9 26.0 23.1 25.0 25.4 24.3 24.2 –0.4% 1.0%<br />
France 6.6 5.7 5.3 5.2 4.3 3.6 3.3 2.3 1.5 1.1 1.3 12.6% 0.1%<br />
Germany 83.7 77.8 74.6 70.0 66.9 61.3 59.4 56.5 54.1 55.0 54.1 –1.6% 2.1%<br />
Greece 7.2 7.4 7.5 7.2 7.7 8.1 8.0 8.2 8.6 9.2 9.7 4.7% 0.4%<br />
Hungary 2.8 2.9 2.6 3.2 3.3 3.0 3.1 2.9 2.9 2.7 2.8 1.1% 0.1%<br />
Kazakhstan 57.3 53.5 42.6 39.3 37.3 36.0 30.0 38.5 40.6 37.8 43.2 14.5% 1.7%<br />
Poland 89.2 89.3 91.1 94.5 92.1 79.6 77.0 71.3 71.7 71.3 70.8 –0.7% 2.8%<br />
Romania 8.9 9.1 9.3 9.6 7.4 5.7 5.1 6.4 7.3 6.7 7.1 6.1% 0.3%<br />
Russian Federation 135.1 121.2 118.5 114.4 109.3 103.9 112.0 115.8 121.5 114.8 124.9 8.8% 5.0%<br />
Spain 11.0 10.6 10.2 10.0 9.8 9.3 8.6 8.0 7.6 7.2 7.0 –3.0% 0.3%<br />
Turkey 11.7 12.1 12.1 12.3 13.1 13.9 13.3 13.9 14.2 11.5 10.5 –9.2% 0.4%<br />
Ukraine 59.4 48.5 44.2 39.1 39.8 39.9 42.8 42.2 43.8 43.0 41.6 –3.2% 1.7%<br />
United Kingdom 40.3 28.3 31.8 30.2 29.4 25.0 22.5 19.0 19.4 18.2 17.2 –5.9% 0.7%<br />
Other Europe & Eurasia 17.3 13.8 14.0 13.4 15.7 16.5 13.3 14.4 14.9 15.5 15.2 –2.4% 0.6%<br />
Total Europe & Eurasia 566.1 513.3 496.4 480.4 469.1 436.8 425.8 429.0 438.0 422.9 434.0 2.6% 17.2%<br />
Total Middle East 0.6 0.8 0.7 0.7 0.6 0.6 0.7 0.6 0.5 0.4 0.6 62.5%<br />
◆<br />
South Africa 103.5 111.1 116.9 116.9 124.6 127.1 125.6 126.6 126.0 124.1 134.6 8.4% 5.3%<br />
Zimbabwe 3.4 3.5 3.6 3.3 3.4 3.5 3.2 2.8 2.9 2.6 1.9 –24.4% 0.1%<br />
Other Africa 1.3 1.4 1.4 1.3 1.2 1.4 1.3 1.1 1.1 1.1 1.1 –2.3%<br />
◆<br />
Total Africa 108.3 116.0 121.9 121.5 129.2 132.0 130.0 130.6 130.0 127.7 137.5 7.7% 5.5%<br />
Australia 120.9 123.3 129.5 133.6 148.1 149.8 160.6 166.2 179.8 183.5 188.7 2.8% 7.5%<br />
China 580.7 619.4 650.9 691.5 665.5 619.7 523.9 501.8 546.9 732.0 842.6 15.1% 33.5%<br />
India 123.5 126.9 135.2 145.7 149.6 150.3 147.4 157.0 160.3 168.6 172.2 2.2% 6.8%<br />
Indonesia 17.0 20.2 25.7 31.0 33.7 38.3 45.3 47.4 56.9 63.6 70.5 10.9% 2.8%<br />
Japan 4.0 3.8 3.4 3.6 2.4 2.0 2.2 1.7 1.8 0.8 0.7 –2.2%<br />
◆<br />
New Zealand 1.8 1.8 2.1 2.2 2.0 2.0 2.2 2.2 2.4 2.7 3.2 15.2% 0.1%<br />
Pakistan 1.4 1.4 1.4 1.5 1.4 1.5 1.5 1.4 1.5 1.6 1.4 –7.2% 0.1%<br />
South Korea 4.2 3.3 2.6 2.2 2.0 2.0 1.9 1.9 1.7 1.5 1.5 –0.6% 0.1%<br />
Thailand 4.6 5.2 5.5 6.3 6.9 6.1 5.7 5.1 5.6 5.6 5.4 –4.6% 0.2%<br />
Vietnam 3.6 3.4 3.9 4.9 6.4 6.4 4.9 6.4 7.2 8.6 10.7 23.8% 0.4%<br />
Other Asia Pacific 23.2 21.6 20.2 18.0 17.2 15.7 18.0 19.3 19.8 20.3 20.9 2.7% 0.8%<br />
Total Asia Pacific 885.1 930.2 980.5 1040.5 1035.1 993.6 913.5 910.5 984.0 1188.7 1317.7 10.9% 52.3%<br />
TOTAL WORLD 2127.0 2178.1 2218.2 2281.9 2289.9 2236.2 2122.5 2112.5 2208.5 2378.4 2518.7 5.9% 100.0%<br />
of which: OECD 963.0 992.1 997.0 1015.4 1038.6 1031.2 1010.5 989.1 1013.1 996.9 984.3 –1.3% 39.1%<br />
Former Soviet Union 253.8 224.8 206.5 193.8 187.6 180.8 185.9 197.4 206.9 196.5 210.5 7.1% 8.4%<br />
Other EMEs 910.1 961.2 1014.7 1072.7 1063.7 1024.2 926.1 926.1 988.5 1184.9 1323.9 11.7% 52.6%<br />
*Commercial solid fuels only, i.e. bituminous coal and anthracite (hard coal), and lignite and brown (sub-bituminous) coal.<br />
◆ Less than 0.05%.<br />
Notes: Because of rounding some totals may not agree exactly with the sum of their component parts.<br />
Coal production data expressed in million tonnes is available at www.bp.com/statisticalreview2004<br />
32 <strong>BP</strong> 2004 Statistical Review of World Energy
Change 2003<br />
Consumption*<br />
2003 over share<br />
Million tonnes oil equivalent 1993 1994 1995 1996 1997 1998 1999 2000 2001 2002 2003 2002 of total<br />
USA 499.9 501.7 506.3 529.3 540.4 545.8 544.9 569.1 551.8 559.4 573.9 2.6% 22.3%<br />
Canada 23.7 24.5 25.2 25.7 26.8 28.1 27.8 29.4 30.3 30.7 31.0 0.8% 1.2%<br />
Mexico 3.8 4.5 5.0 5.7 5.7 5.9 6.0 6.2 6.8 7.6 7.8 3.3% 0.3%<br />
Total North America 527.4 530.7 536.5 560.7 573.0 579.7 578.7 604.6 588.9 597.7 612.7 2.5% 23.8%<br />
Argentina 0.7 1.0 0.9 0.9 0.8 0.8 0.9 0.8 0.6 0.5 0.6 2.2%<br />
◆<br />
Brazil 10.3 10.3 10.8 11.3 11.5 11.4 11.9 12.5 12.2 11.5 11.0 –3.9% 0.4%<br />
Chile 1.8 2.2 2.4 3.2 4.2 3.7 3.5 3.9 2.1 2.4 2.4 1.7% 0.1%<br />
Colombia 3.7 3.6 3.4 3.2 3.1 2.8 2.1 2.2 3.3 2.0 2.6 27.8% 0.1%<br />
Ecuador – – – – – – – – – – – – –<br />
Peru 0.4 0.4 0.4 0.3 0.4 0.4 0.5 0.5 0.4 0.4 0.4 1.9%<br />
◆<br />
Venezuela † 0.1 † † † † 0.1 † † 0.1 0.1 –<br />
◆<br />
Other S. & Cent. America 0.5 0.4 0.4 0.5 0.4 0.5 0.6 0.6 0.7 0.7 0.7 –0.4%<br />
◆<br />
Total S. & Cent. America 17.5 18.0 18.3 19.4 20.4 19.7 19.6 20.6 19.4 17.5 17.7 1.0% 0.7%<br />
Austria 2.4 2.5 2.4 2.7 3.1 3.0 3.2 3.2 2.9 3.0 3.0 –0.6% 0.1%<br />
Azerbaijan – – – – – – – – † † † 50.0%<br />
◆<br />
Belarus 0.6 0.2 0.3 0.5 0.6 0.4 0.3 0.3 0.3 0.3 0.3 –<br />
◆<br />
Belgium & Luxembourg 8.7 8.5 9.8 7.6 7.5 7.9 6.9 7.6 7.6 6.7 6.5 –4.0% 0.3%<br />
Bulgaria 8.2 7.6 7.8 8.4 7.8 8.2 6.6 6.3 6.9 7.2 8.1 12.5% 0.3%<br />
Czech Republic 23.7 23.2 23.5 23.6 22.8 20.5 19.0 21.0 21.2 20.4 20.5 0.3% 0.8%<br />
Denmark 7.2 7.8 6.6 9.0 6.7 5.6 4.7 4.0 4.2 4.2 5.7 35.0% 0.2%<br />
Finland 3.1 4.1 3.1 4.0 4.5 3.4 3.6 3.5 4.0 4.4 5.8 32.5% 0.2%<br />
France 14.7 13.7 14.5 15.4 13.4 16.1 14.3 13.9 11.6 12.2 12.4 1.9% 0.5%<br />
Germany 97.9 95.6 90.6 89.9 86.8 84.8 80.2 84.9 85.0 84.6 87.1 2.9% 3.4%<br />
Greece 7.9 8.4 8.2 7.8 7.6 8.8 9.1 9.2 9.3 9.8 10.3 4.1% 0.4%<br />
Hungary 4.0 3.6 3.6 3.7 3.7 3.4 3.4 3.2 3.4 3.1 3.3 6.1% 0.1%<br />
Iceland † 0.1 0.1 0.1 0.1 0.1 0.1 0.1 0.1 0.1 0.1 2.0%<br />
◆<br />
Republic of Ireland 1.9 1.9 1.9 1.9 2.0 1.9 1.6 1.9 1.9 1.7 1.6 –5.9% 0.1%<br />
Italy 10.0 10.7 12.5 11.2 11.0 11.6 11.6 13.0 13.7 14.2 15.3 7.7% 0.6%<br />
Kazakhstan 36.4 34.5 27.5 25.9 22.4 22.9 19.8 23.2 22.5 22.8 26.9 18.0% 1.0%<br />
Lithuania † 0.1 0.1 0.1 0.1 0.1 0.1 0.1 0.1 0.1 0.1 9.5%<br />
◆<br />
Netherlands 8.2 9.0 9.8 9.3 9.5 9.4 7.7 8.6 8.5 9.0 9.2 2.6% 0.4%<br />
Norway 0.5 0.6 0.7 0.6 0.6 0.7 0.7 0.7 0.6 0.5 0.5 –4.6%<br />
◆<br />
Poland 74.0 72.3 71.7 73.2 70.1 63.8 61.0 57.6 58.0 56.7 58.8 3.7% 2.3%<br />
Portugal 3.3 3.4 4.2 3.9 3.6 3.6 3.6 4.5 3.7 4.1 3.9 –5.2% 0.2%<br />
Romania 9.5 9.4 9.7 9.5 8.4 7.0 6.7 7.0 7.2 7.6 8.0 5.2% 0.3%<br />
Russian Federation 140.8 126.4 119.4 115.7 106.3 100.0 104.1 106.0 109.0 103.9 111.3 7.1% 4.3%<br />
Slovakia 5.6 5.0 5.1 5.0 4.7 4.5 4.3 4.0 4.1 4.0 4.1 2.1% 0.2%<br />
Spain 18.2 18.0 18.5 15.5 17.7 17.7 20.5 21.6 19.5 21.9 20.6 –5.8% 0.8%<br />
Sweden 2.1 2.1 2.1 2.4 2.1 2.0 2.0 1.9 2.0 2.2 2.2 1.6% 0.1%<br />
Switzerland 0.1 0.2 0.2 0.1 0.1 0.1 0.1 0.1 0.1 0.1 0.1 6.1%<br />
◆<br />
Turkey 18.7 17.6 17.5 20.7 22.3 22.5 20.8 22.3 20.4 17.1 15.5 –8.9% 0.6%<br />
Turkmenistan – † † † – – – – – – – – –<br />
Ukraine 56.3 46.3 42.1 33.2 38.0 36.9 38.5 38.8 39.4 38.3 39.0 1.7% 1.5%<br />
United Kingdom 53.3 49.7 47.5 44.4 39.6 39.7 35.6 36.9 40.0 36.7 39.1 6.8% 1.5%<br />
Uzbekistan 1.9 1.8 1.4 1.2 1.2 1.2 0.9 1.0 1.1 1.0 1.0 –2.9%<br />
◆<br />
Other Europe & Eurasia 16.7 13.0 14.0 14.4 16.7 17.2 13.3 14.2 14.6 15.2 15.7 3.3% 0.6%<br />
Total Europe & Eurasia 636.2 597.1 576.1 560.9 541.2 524.9 504.2 520.6 522.8 513.1 535.9 4.4% 20.8%<br />
Iran 1.3 1.3 1.4 1.2 0.9 1.0 1.0 1.1 0.8 0.8 0.7 –3.3%<br />
◆<br />
Kuwait – – – – – – – – – – – – –<br />
Qatar – – – – – – – – – – – – –<br />
Saudi Arabia – – – – – – – – – – – – –<br />
United Arab Emirates – – – – – – – – – – – – –<br />
Other Middle East 3.5 3.8 4.1 5.0 5.4 5.8 5.7 6.2 7.2 7.6 7.9 3.7% 0.3%<br />
Total Middle East 4.8 5.1 5.5 6.1 6.3 6.8 6.7 7.3 8.0 8.4 8.6 3.0% 0.3%<br />
Algeria 0.6 0.6 0.6 0.5 0.3 0.5 0.5 0.5 0.5 0.5 0.6 6.5%<br />
◆<br />
Egypt 0.9 1.0 0.7 0.9 0.8 0.8 0.6 0.7 0.7 0.7 0.7 –<br />
◆<br />
South Africa 69.8 73.6 77.4 81.7 84.3 83.4 82.3 81.9 80.6 83.5 88.9 6.4% 3.4%<br />
Other Africa 6.8 6.5 6.7 6.8 6.9 7.0 6.5 6.4 7.3 7.1 7.0 –1.6% 0.3%<br />
Total Africa 78.1 81.6 85.3 89.8 92.3 91.7 90.0 89.5 89.2 91.9 97.2 5.7% 3.8%<br />
Australia 38.7 39.6 41.1 42.8 45.1 47.3 47.9 48.3 49.6 51.9 50.2 –3.3% 1.9%<br />
Bangladesh † † 0.3 0.2 0.3 0.1 † 0.3 0.4 0.4 0.4 2.8%<br />
◆<br />
China 570.3 606.4 671.9 681.6 681.7 608.3 492.3 455.0 517.7 694.2 799.7 15.2% 31.0%<br />
China Hong Kong SAR 7.3 5.2 5.6 4.2 3.5 4.4 3.9 3.7 4.9 5.4 6.6 22.5% 0.3%<br />
India 128.0 133.9 142.8 154.4 160.2 159.8 158.9 169.1 172.1 181.0 185.3 2.4% 7.2%<br />
Indonesia 4.0 4.8 5.7 6.9 8.2 9.3 11.6 13.7 16.7 18.0 18.9 4.8% 0.7%<br />
Japan 79.2 82.0 86.2 88.3 89.8 88.4 91.5 98.9 103.0 106.6 112.2 5.2% 4.4%<br />
Malaysia 1.3 1.1 1.5 1.5 1.7 1.6 1.8 1.9 2.6 3.7 3.2 –13.5% 0.1%<br />
New Zealand 1.2 1.2 1.2 1.2 1.2 1.1 1.2 1.1 1.3 1.3 1.8 41.2% 0.1%<br />
Pakistan 2.2 2.2 2.2 2.2 2.1 2.1 2.1 2.0 2.1 2.4 2.7 14.4% 0.1%<br />
Philippines 1.3 1.3 1.4 2.0 2.4 2.7 2.9 4.3 4.5 4.7 5.6 18.8% 0.2%<br />
Singapore – – – – – – – – – – – – –<br />
South Korea 25.9 26.7 28.1 32.2 34.8 36.1 38.2 43.0 45.7 49.1 51.1 4.1% 2.0%<br />
Taiwan 15.6 16.6 17.1 19.4 21.9 23.8 24.9 28.9 30.8 32.7 35.0 6.9% 1.4%<br />
Thailand 5.4 6.1 7.1 8.7 8.7 7.3 7.9 7.8 8.8 9.2 9.7 6.1% 0.4%<br />
Other Asia Pacific 23.7 22.2 21.3 19.1 19.9 18.4 19.1 20.7 22.4 23.2 23.9 2.8% 0.9%<br />
Total Asia Pacific 904.2 949.4 1033.5 1064.7 1081.5 1010.7 904.3 898.7 982.8 1183.7 1306.2 10.3% 50.7%<br />
TOTAL WORLD 2168.1 2181.8 2255.1 2301.6 2314.7 2233.4 2103.4 2141.2 2211.0 2412.3 2578.4 6.9% 100.0%<br />
of which: European Union 15 239.0 235.3 231.7 225.0 215.2 215.5 204.6 214.8 213.8 214.7 222.7 3.7% 8.6%<br />
OECD 1038.2 1038.1 1047.0 1077.2 1083.5 1083.6 1071.4 1119.8 1110.5 1123.3 1153.7 2.7% 44.7%<br />
Former Soviet Union 238.7 211.5 192.4 178.6 171.2 163.2 164.5 170.1 172.9 167.1 179.3 7.3% 7.0%<br />
Other EMEs 891.3 932.3 1015.6 1045.8 1060.0 986.6 867.5 851.4 927.6 1121.9 1245.4 11.0% 48.3%<br />
*Commercial solid fuels only, i.e. bituminous coal and anthracite (hard coal), and lignite and brown (sub-bituminous) coal.<br />
†Less than 0.05.<br />
◆ Less than 0.05%.<br />
33
Nuclear energy<br />
Change 2003<br />
Consumption*<br />
2003 over share<br />
Million tonnes oil equivalent 1993 1994 1995 1996 1997 1998 1999 2000 2001 2002 2003 2002 of total<br />
USA 145.4 152.6 160.4 160.7 149.8 160.5 173.5 179.6 183.2 185.8 181.9 –2.1% 30.4%<br />
Canada 21.3 24.4 22.1 21.0 18.7 16.2 16.6 16.5 17.4 16.9 16.8 –0.7% 2.8%<br />
Mexico 1.1 1.0 1.9 1.8 2.4 2.1 2.3 1.9 2.0 2.2 2.4 7.2% 0.4%<br />
Total North America 167.8 177.9 184.5 183.5 170.8 178.8 192.4 197.9 202.5 204.9 201.1 –1.9% 33.6%<br />
Argentina 1.8 1.9 1.6 1.7 1.8 1.7 1.6 1.4 1.6 1.3 1.7 30.2% 0.3%<br />
Brazil 0.1 † 0.6 0.5 0.7 0.7 0.9 1.4 3.2 3.1 3.0 –3.2% 0.5%<br />
Chile – – – – – – – – – – – – –<br />
Colombia – – – – – – – – – – – – –<br />
Ecuador – – – – – – – – – – – – –<br />
Peru – – – – – – – – – – – – –<br />
Venezuela – – – – – – – – – – – – –<br />
Other S. & Cent. America – – – – – – – – – – – – –<br />
Total S. & Cent. America 1.9 1.9 2.2 2.2 2.5 2.4 2.5 2.8 4.8 4.4 4.7 6.7% 0.8%<br />
Austria – – – – – – – – – – – – –<br />
Azerbaijan – – – – – – – – – – – – –<br />
Belarus – – – – – – – – – – – – –<br />
Belgium & Luxembourg 9.5 9.2 9.4 9.8 10.7 10.5 11.1 10.9 10.5 10.7 10.8 0.5% 1.8%<br />
Bulgaria 3.2 3.5 3.9 4.1 4.0 3.8 3.6 4.1 4.4 4.6 3.9 –14.6% 0.7%<br />
Czech Republic 2.9 2.9 2.8 2.9 2.8 3.0 3.0 3.1 3.3 4.2 5.9 38.1% 1.0%<br />
Denmark – – – – – – – – – – – – –<br />
Finland 4.5 4.4 4.3 4.4 4.8 5.0 5.3 5.1 5.2 5.4 5.5 2.0% 0.9%<br />
France 83.3 81.5 85.4 89.9 89.5 87.8 89.2 94.0 95.3 98.8 99.8 1.0% 16.7%<br />
Germany 34.7 34.2 34.9 36.6 38.5 36.6 38.5 38.4 38.7 37.3 37.3 0.1% 6.2%<br />
Greece – – – – – – – – – – – – –<br />
Hungary 3.1 3.2 3.2 3.2 3.2 3.2 3.2 3.2 3.2 3.2 2.5 –21.1% 0.4%<br />
Iceland – – – – – – – – – – – – –<br />
Republic of Ireland – – – – – – – – – – – – –<br />
Italy – – – – – – – – – – – – –<br />
Kazakhstan 0.1 0.1 † † 0.1 † – – – – – – –<br />
Lithuania 2.8 1.7 2.7 3.2 2.7 3.1 2.2 1.9 2.6 3.2 3.5 9.5% 0.6%<br />
Netherlands 0.9 0.9 0.9 0.9 0.5 0.9 0.9 0.9 0.9 0.9 0.9 2.6% 0.2%<br />
Norway – – – – – – – – – – – – –<br />
Poland – – – – – – – – – – – – –<br />
Portugal – – – – – – – – – – – – –<br />
Romania – – – 0.3 1.2 1.2 1.2 1.2 1.2 1.2 1.1 –11.1% 0.2%<br />
Russian Federation 27.0 22.1 22.5 24.7 24.5 23.6 27.1 29.5 31.0 32.1 34.0 6.2% 5.7%<br />
Slovakia 2.7 2.7 2.6 2.6 2.4 2.6 3.0 3.7 3.9 4.1 4.1<br />
◆<br />
0.7%<br />
Spain 12.7 12.5 12.5 12.7 12.5 13.4 13.3 14.1 14.4 14.3 14.0 –1.9% 2.3%<br />
Sweden 13.9 16.6 15.8 16.6 15.8 15.9 16.6 13.0 16.3 15.4 15.5 0.8% 2.6%<br />
Switzerland 5.3 5.5 5.6 5.7 5.8 5.8 5.6 6.0 6.1 6.2 6.2 0.9% 1.0%<br />
Turkey – – – – – – – – – – – – –<br />
Turkmenistan – – – – – – – – – – – – –<br />
Ukraine 17.0 15.6 16.0 18.0 18.0 17.0 16.3 17.5 17.2 17.7 18.4 4.4% 3.1%<br />
United Kingdom 20.2 20.0 20.1 21.4 22.2 22.5 21.5 19.3 20.3 19.9 20.1 1.0% 3.4%<br />
Uzbekistan – – – – – – – – – – – – –<br />
Other Europe & Eurasia 0.9 1.0 1.1 1.6 1.5 1.5 1.5 1.5 1.6 1.8 1.6 –7.9% 0.3%<br />
Total Europe & Eurasia 244.6 237.6 243.7 258.6 260.8 257.3 263.2 267.4 276.2 280.9 285.3 1.6% 47.6%<br />
Iran – – – – – – – – – – – – –<br />
Kuwait – – – – – – – – – – – – –<br />
Qatar – – – – – – – – – – – – –<br />
Saudi Arabia – – – – – – – – – – – – –<br />
United Arab Emirates – – – – – – – – – – – – –<br />
Other Middle East – – – – – – – – – – – – –<br />
Total Middle East – – – – – – – – – – – – –<br />
Algeria – – – – – – – – – – – – –<br />
Egypt – – – – – – – – – – – – –<br />
South Africa 1.7 2.3 2.7 2.8 3.0 3.2 3.1 3.1 2.6 2.9 3.0 5.6% 0.5%<br />
Other Africa – – – – – – – – – – – – –<br />
Total Africa 1.7 2.3 2.7 2.8 3.0 3.2 3.1 3.1 2.6 2.9 3.0 5.6% 0.5%<br />
Australia – – – – – – – – – – – – –<br />
Bangladesh – – – – – – – – – – – – –<br />
China 0.4 3.1 2.9 3.2 3.3 3.4 3.4 3.8 4.0 5.7 9.8 72.6% 1.6%<br />
China Hong Kong SAR – – – – – – – – – – – – –<br />
India 1.4 1.1 1.7 1.9 2.3 2.6 2.9 3.6 4.3 4.4 4.1 –7.0% 0.7%<br />
Indonesia – – – – – – – – – – – – –<br />
Japan 56.3 58.7 65.1 67.3 72.8 74.0 71.9 72.3 72.7 71.3 52.2 –26.7% 8.7%<br />
Malaysia – – – – – – – – – – – – –<br />
New Zealand – – – – – – – – – – – – –<br />
Pakistan 0.1 0.1 0.1 0.1 0.1 0.1 † 0.2 0.5 0.4 0.4 0.5% 0.1%<br />
Philippines – – – – – – – – – – – – –<br />
Singapore – – – – – – – – – – – – –<br />
South Korea 13.2 13.3 15.2 16.7 17.4 20.3 23.3 24.7 25.4 27.0 29.3 8.9% 4.9%<br />
Taiwan 7.8 7.9 8.0 8.6 8.2 8.3 8.7 8.7 8.0 9.0 8.8 –1.7% 1.5%<br />
Thailand – – – – – – – – – – – – –<br />
Other Asia Pacific – – – – – – – – – – – – –<br />
Total Asia Pacific 79.1 84.3 93.0 97.8 104.1 108.8 110.2 113.3 114.8 117.7 104.7 –11.0% 17.5%<br />
TOTAL WORLD 495.0 504.0 526.1 545.0 541.3 550.5 571.3 584.5 600.9 610.8 598.8 –2.0% 100.0%<br />
of which: European Union 15 179.7 179.2 183.3 192.5 194.6 192.5 196.4 195.6 201.7 202.7 204.0 0.6% 34.1%<br />
OECD 430.9 443.5 462.3 474.4 469.9 480.2 498.8 506.5 518.7 523.5 505.3 –3.5% 84.4%<br />
Former Soviet Union 46.9 39.6 41.2 46.4 45.6 44.0 46.2 49.4 51.2 53.4 56.4 5.6% 9.4%<br />
Other EMEs 17.3 21.0 22.6 24.2 25.8 26.3 26.3 28.6 31.0 33.8 37.1 9.6% 6.2%<br />
*Converted on the basis of thermal equivalence assuming 38% conversion efficiency in a modern thermal power station.<br />
†Less than 0.05.<br />
◆ Less than 0.05%.<br />
Note: Nuclear energy data expressed in terawatt-hours is available at www.bp.com/statisticalreview2004<br />
34 <strong>BP</strong> 2004 Statistical Review of World Energy
Consumption by area<br />
Million tonnes oil equivalent<br />
700<br />
600<br />
500<br />
400<br />
300<br />
200<br />
100<br />
0 78 79 80 81 82 83 84 85 86 87 88 89 90 91 92 93 94 95 96 97 98 99 00 01 02 03<br />
North America Europe & Eurasia Asia Pacific Rest of World<br />
Global nuclear power generation contracted in 2003, for only the second time in its history, as output fell in the USA and Japan, the world’s largest and third largest<br />
generators respectively.<br />
Hydroelectricity<br />
Consumption by area<br />
Million tonnes oil equivalent<br />
700<br />
600<br />
500<br />
400<br />
300<br />
200<br />
100<br />
0 78 79 80 81 82 83 84 85 86 87 88 89 90 91 92 93 94 95 96 97 98 99 00 01 02 03<br />
North America S. & Cent. America Europe & Eurasia Middle East & Africa Asia Pacific<br />
Global hydroelectric output grew by only 0.4% in 2003 to a level still 3% below the peak reached in 2000.<br />
35
Hydroelectricity<br />
Change 2003<br />
Consumption*<br />
2003 over share<br />
Million tonnes oil equivalent 1993 1994 1995 1996 1997 1998 1999 2000 2001 2002 2003 2002 of total<br />
USA 63.2 58.7 70.4 78.7 80.6 72.9 71.7 61.7 47.6 58.4 60.9 4.2% 10.2%<br />
Canada 72.8 74.2 75.9 80.2 79.4 75.1 77.8 81.1 75.4 72.1 68.6 –5.0% 11.5%<br />
Mexico 6.0 4.6 6.2 7.1 6.0 5.6 7.4 7.5 6.4 5.6 4.5 –20.5% 0.8%<br />
Total North America 142.0 137.5 152.6 166.0 166.0 153.6 156.9 150.3 129.4 136.2 133.9 –1.7% 22.5%<br />
Argentina 5.5 6.2 6.1 5.2 6.4 6.0 4.9 6.5 8.4 8.3 7.8 –6.0% 1.3%<br />
Brazil 53.2 54.9 57.5 60.1 63.1 66.0 66.3 68.9 60.6 64.5 68.9 6.8% 11.6%<br />
Chile 3.9 3.9 4.2 3.8 4.3 3.6 3.1 4.3 4.9 5.2 5.1 –3.0% 0.9%<br />
Colombia 6.3 7.3 7.3 8.0 7.1 6.9 7.6 6.9 7.1 7.6 8.1 6.8% 1.4%<br />
Ecuador 1.3 1.5 1.2 1.4 1.5 1.5 1.6 1.7 1.6 1.7 1.7 –1.7% 0.3%<br />
Peru 2.6 2.9 2.9 3.0 3.0 3.1 3.3 3.7 4.0 4.1 4.2 2.5% 0.7%<br />
Venezuela 10.7 11.6 11.6 12.2 13.0 13.1 13.7 14.2 13.7 13.5 13.7 1.7% 2.3%<br />
Other S. & Cent. America 12.7 13.4 14.3 16.3 17.2 17.3 17.7 18.4 16.8 17.8 18.4 3.3% 3.1%<br />
Total S. & Cent. America 96.2 101.7 105.1 110.2 115.6 117.5 118.2 124.7 117.1 122.7 127.8 4.2% 21.5%<br />
Austria 8.6 8.4 8.7 8.1 8.4 8.8 9.4 9.8 9.8 8.6 6.9 –20.4% 1.2%<br />
Azerbaijan 0.5 0.4 0.4 0.3 0.4 0.4 0.3 0.3 0.3 0.5 0.6 20.8% 0.1%<br />
Belarus † † † † † † † † † † † –<br />
◆<br />
Belgium & Luxembourg 0.3 0.4 0.5 0.5 0.5 0.6 0.5 0.6 0.6 0.6 0.5 –8.1% 0.1%<br />
Bulgaria 0.4 0.3 0.5 0.7 0.7 0.8 0.7 0.6 0.4 0.5 0.5 – 0.1%<br />
Czech Republic 0.4 0.4 0.5 0.5 0.5 0.4 0.5 0.5 0.6 0.6 0.4 –37.0% 0.1%<br />
Denmark † † † † † † † † † † † –28.6%<br />
◆<br />
Finland 3.1 2.7 2.9 2.7 2.7 3.3 2.9 3.3 3.1 2.4 2.1 –12.4% 0.4%<br />
France 15.4 18.3 17.2 15.9 15.3 14.9 17.6 16.4 18.0 15.1 14.8 –2.2% 2.5%<br />
Germany 4.9 5.1 5.5 4.9 4.7 4.8 5.3 5.9 5.8 6.3 5.7 –10.3% 1.0%<br />
Greece 0.6 0.7 0.9 1.0 0.9 0.9 1.1 0.9 0.6 0.8 1.2 55.3% 0.2%<br />
Hungary † † † † 0.1 † † † † † † –18.2%<br />
◆<br />
Iceland 1.0 1.0 1.1 1.1 1.2 1.3 1.4 1.4 1.5 1.6 1.6 1.6% 0.3%<br />
Republic of Ireland 0.2 0.3 0.2 0.2 0.2 0.3 0.2 0.3 0.2 0.3 0.2 –24.5%<br />
◆<br />
Italy 10.1 10.8 9.5 10.7 10.6 10.7 11.7 11.5 12.2 10.7 10.0 –6.5% 1.7%<br />
Kazakhstan 1.7 2.1 1.9 1.7 1.5 1.4 1.4 1.7 1.8 1.9 1.9 – 0.3%<br />
Lithuania 0.1 0.2 0.2 0.2 0.2 0.2 0.2 0.1 0.2 0.2 0.2 27.1%<br />
◆<br />
Netherlands † † † † † † † † † † † 4.2%<br />
◆<br />
Norway 27.1 25.5 27.7 23.5 25.1 26.3 27.6 32.2 27.4 29.4 24.0 –18.2% 4.0%<br />
Poland 0.8 0.9 0.9 0.9 0.9 1.0 1.0 0.9 1.0 0.9 0.7 –15.5% 0.1%<br />
Portugal 2.0 2.4 1.9 3.4 3.0 3.0 1.7 2.7 3.3 1.8 3.6 >100% 0.6%<br />
Romania 2.9 3.0 3.8 3.6 4.0 4.3 4.1 3.3 3.4 3.6 3.1 –15.1% 0.5%<br />
Russian Federation 39.6 39.8 40.1 34.9 35.6 35.9 36.4 37.4 39.8 37.2 35.6 –4.3% 6.0%<br />
Slovakia 0.9 1.0 1.2 1.0 1.0 1.0 1.1 1.1 1.2 1.2 0.8 –36.2% 0.1%<br />
Spain 5.8 6.5 5.5 9.4 8.5 8.8 7.0 8.3 9.9 6.0 9.9 65.2% 1.7%<br />
Sweden 17.1 13.4 15.3 11.7 15.6 16.7 16.2 17.8 17.9 15.0 12.1 –19.4% 2.0%<br />
Switzerland 8.3 9.0 8.1 6.7 8.0 7.8 9.3 8.7 9.7 8.3 8.3 –0.2% 1.4%<br />
Turkey 7.7 6.9 8.0 9.2 8.8 9.6 7.8 7.0 5.4 7.6 8.0 4.7% 1.3%<br />
Turkmenistan – – – – – – – – – – – – –<br />
Ukraine 2.5 2.8 2.3 2.0 2.3 3.6 3.3 2.6 2.8 2.2 2.1 –4.8% 0.4%<br />
United Kingdom 1.3 1.5 1.4 1.1 1.3 1.5 1.9 1.8 1.5 1.7 1.3 –20.9% 0.2%<br />
Uzbekistan 1.7 1.6 1.4 1.5 1.3 1.3 1.3 1.3 1.4 1.6 1.7 4.7% 0.3%<br />
Other Europe & Eurasia 14.6 15.4 15.2 17.0 15.1 15.5 16.6 16.1 15.5 15.2 16.4 8.2% 2.8%<br />
Total Europe & Eurasia 179.6 180.9 182.8 174.2 178.1 185.1 188.6 194.7 195.0 181.9 174.3 –4.2% 29.3%<br />
Iran 2.2 1.8 1.9 1.8 1.3 1.7 1.2 0.9 0.9 1.8 2.0 12.9% 0.3%<br />
Kuwait – – – – – – – – – – – – –<br />
Qatar – – – – – – – – – – – – –<br />
Saudi Arabia – – – – – – – – – – – – –<br />
United Arab Emirates – – – – – – – – – – – – –<br />
Other Middle East 0.6 0.8 0.9 1.1 1.1 1.1 0.7 0.8 0.7 0.8 0.9 13.9% 0.2%<br />
Total Middle East 2.8 2.6 2.8 2.9 2.4 2.8 1.9 1.7 1.6 2.6 3.0 13.2% 0.5%<br />
Algeria 0.1 † † † † † † † † † 0.1 >100%<br />
◆<br />
Egypt 2.4 2.5 2.6 2.7 2.7 3.1 3.4 3.2 3.3 3.2 3.2 1.0% 0.5%<br />
South Africa 0.3 0.6 0.4 0.8 1.1 0.9 0.8 0.9 0.8 0.9 0.8 –14.3% 0.1%<br />
Other Africa 10.3 10.5 11.1 11.2 11.6 12.2 13.7 14.1 14.3 14.7 14.8 0.5% 2.5%<br />
Total Africa 13.2 13.6 14.2 14.7 15.5 16.2 17.9 18.2 18.4 18.8 18.8 0.1% 3.2%<br />
Australia 3.8 3.7 3.7 3.8 3.8 3.7 3.7 3.7 3.7 3.7 3.7 – 0.6%<br />
Bangladesh 0.1 0.2 0.1 0.2 0.2 0.2 0.2 0.2 0.2 0.2 0.2 –<br />
◆<br />
China 32.7 37.8 42.2 42.3 42.5 44.9 48.2 55.0 59.1 62.2 64.0 2.9% 10.8%<br />
China Hong Kong SAR – – – – – – – – – – – – –<br />
India 16.0 18.2 17.2 15.6 15.9 18.9 18.6 17.4 16.3 15.5 15.6 0.3% 2.6%<br />
Indonesia 1.8 1.6 1.7 1.8 1.2 2.2 2.1 2.1 2.4 2.3 2.3 – 0.4%<br />
Japan 23.8 17.4 19.9 19.7 21.2 23.6 21.0 20.7 20.4 20.5 22.8 10.9% 3.8%<br />
Malaysia 1.1 1.5 1.4 1.2 0.9 1.1 1.7 1.6 1.6 1.7 1.7 3.0% 0.3%<br />
New Zealand 5.3 5.8 6.2 5.8 5.3 5.5 5.3 5.5 5.1 5.4 5.5 2.0% 0.9%<br />
Pakistan 5.0 4.9 5.1 5.6 4.2 5.5 4.9 4.0 4.1 4.6 5.6 21.3% 0.9%<br />
Philippines 1.1 1.3 1.4 1.6 1.4 1.1 1.8 1.8 1.6 1.6 1.8 11.6% 0.3%<br />
Singapore – – – – – – – – – – – – –<br />
South Korea 1.4 0.9 1.2 1.2 1.2 1.4 1.4 1.3 0.9 1.2 1.6 29.7% 0.3%<br />
Taiwan 1.5 2.0 2.0 2.0 2.2 2.4 2.0 2.0 2.1 1.4 1.6 8.4% 0.3%<br />
Thailand 0.8 1.0 1.5 1.7 1.6 1.2 0.8 1.4 1.4 1.7 1.7 –0.5% 0.3%<br />
Other Asia Pacific 6.7 7.1 7.7 7.4 7.0 6.9 7.7 8.1 9.0 8.8 9.6 9.1% 1.6%<br />
Total Asia Pacific 101.0 103.3 111.3 109.9 108.4 118.5 119.2 124.5 127.9 130.8 137.5 5.1% 23.1%<br />
TOTAL WORLD 534.8 539.5 568.7 577.9 586.0 593.7 602.6 614.1 589.4 593.0 595.4 0.4% 100.0%<br />
of which: European Union 15 69.3 70.5 69.6 69.5 71.7 74.3 75.5 79.2 82.9 69.3 68.3 –1.4% 11.5%<br />
OECD 291.6 280.6 300.6 308.9 314.7 309.4 312.4 312.5 289.0 286.0 279.6 –2.2% 47.0%<br />
Former Soviet Union 55.4 56.0 54.6 48.9 49.3 51.1 51.5 52.1 54.3 51.9 51.4 –1.0% 8.6%<br />
Other EMEs 187.8 203.0 213.5 220.1 222.0 233.2 238.7 249.5 246.1 255.1 264.3 3.6% 44.4%<br />
*Converted on the basis of thermal equivalence assuming 38% conversion efficiency in a modern thermal power station.<br />
†Less than 0.05.<br />
◆ Less than 0.05%.<br />
Note: Hydroelectricity data expressed in terawatt-hours is available at www.bp.com/statisticalreview2004<br />
36 <strong>BP</strong> 2004 Statistical Review of World Energy
Primary energy<br />
Change 2003<br />
Consumption*<br />
2003 over share<br />
Million tonnes oil equivalent 1993 1994 1995 1996 1997 1998 1999 2000 2001 2002 2003 2002 of total<br />
USA 2035.9 2073.2 2119.1 2189.8 2206.7 2220.9 2258.9 2310.7 2254.8 2296.7 2297.8<br />
◆<br />
23.6%<br />
Canada 264.1 272.4 275.2 285.7 285.5 282.6 284.2 289.8 288.1 289.0 291.4 0.8% 3.0%<br />
Mexico 107.6 114.0 111.7 116.0 122.3 128.3 131.7 135.9 135.2 135.2 138.1 2.1% 1.4%<br />
Total North America 2407.6 2459.6 2506.0 2591.6 2614.5 2631.8 2674.7 2736.3 2678.1 2721.0 2727.3 0.2% 28.0%<br />
Argentina 48.8 50.3 52.4 56.0 55.9 58.1 57.5 58.9 57.7 54.5 58.7 7.7% 0.6%<br />
Brazil 130.5 135.1 142.4 151.1 160.6 166.9 171.2 176.9 174.1 177.6 181.4 2.1% 1.9%<br />
Chile 15.1 16.4 17.7 19.1 22.1 21.6 22.3 23.8 23.3 24.0 24.2 0.6% 0.2%<br />
Colombia 24.7 25.7 26.4 27.7 27.9 27.3 25.0 24.9 26.9 25.2 26.2 3.8% 0.3%<br />
Ecuador 6.2 6.8 6.4 7.2 8.1 8.2 7.7 7.7 7.7 7.7 7.8 1.6% 0.1%<br />
Peru 9.3 10.1 10.9 11.1 10.9 11.3 11.7 11.9 11.7 11.8 12.5 5.3% 0.1%<br />
Venezuela 51.1 53.4 56.4 58.0 61.1 63.8 59.8 61.9 65.2 66.1 64.1 –3.0% 0.7%<br />
Other S. & Cent. America 66.5 70.5 72.5 76.6 79.2 82.1 83.7 84.8 85.3 87.6 90.8 3.6% 0.9%<br />
Total S. & Cent. America 352.2 368.3 385.1 406.9 425.8 439.4 438.8 450.8 452.0 454.5 465.5 2.4% 4.8%<br />
Austria 28.2 27.9 28.5 29.1 30.3 30.9 31.6 31.5 32.5 31.7 31.9 0.7% 0.3%<br />
Azerbaijan 16.6 15.8 16.1 12.6 11.4 12.6 12.8 11.4 11.0 11.0 12.1 9.8% 0.1%<br />
Belarus 28.6 25.3 23.6 21.4 23.5 22.2 21.0 21.5 20.7 19.8 21.1 6.8% 0.2%<br />
Belgium & Luxembourg 54.8 54.7 56.7 59.1 60.3 63.0 64.1 66.4 64.0 64.9 66.9 3.2% 0.7%<br />
Bulgaria 21.7 20.8 22.3 23.3 20.7 20.7 18.0 17.8 18.4 19.1 19.4 1.9% 0.2%<br />
Czech Republic 39.1 39.3 41.3 43.0 41.7 39.9 38.5 40.0 41.5 41.2 43.4 5.2% 0.4%<br />
Denmark 19.2 20.7 20.2 24.1 21.7 20.6 19.9 18.8 18.6 18.4 19.6 6.6% 0.2%<br />
Finland 23.1 24.3 23.1 24.5 25.1 25.6 25.7 26.0 26.4 26.7 28.9 8.0% 0.3%<br />
France 233.5 229.5 235.7 244.7 241.0 247.2 251.5 254.9 257.8 256.5 260.6 1.6% 2.7%<br />
Germany 333.6 331.1 333.1 344.0 337.8 334.5 328.5 330.5 335.7 330.0 332.2 0.7% 3.4%<br />
Greece 25.2 25.9 26.7 27.0 27.2 28.6 30.1 31.8 31.6 32.5 34.4 5.8% 0.4%<br />
Hungary 22.9 23.4 23.6 24.2 23.8 23.8 23.7 23.0 24.1 23.4 23.7 1.3% 0.2%<br />
Iceland 1.8 1.8 1.9 1.9 2.1 2.2 2.3 2.4 2.5 2.6 2.6 0.7%<br />
◆<br />
Republic of Ireland 9.5 10.0 10.2 10.8 11.6 12.4 13.2 13.9 14.6 14.5 13.9 –3.6% 0.1%<br />
Italy 154.9 154.7 162.4 162.4 163.9 168.5 173.7 176.4 177.2 176.8 181.9 2.9% 1.9%<br />
Kazakhstan 65.6 58.2 51.2 45.9 40.7 39.4 35.4 41.0 42.3 44.6 49.6 11.1% 0.5%<br />
Lithuania 8.3 7.3 8.2 9.0 8.6 9.2 7.8 7.0 8.1 8.6 9.2 6.8% 0.1%<br />
Netherlands 79.6 79.5 82.7 85.2 84.7 84.5 83.2 86.5 88.5 89.7 90.0 0.3% 0.9%<br />
Norway 39.5 38.4 40.7 37.1 39.3 40.4 41.5 45.9 41.0 42.9 38.0 –11.5% 0.4%<br />
Poland 97.0 96.2 96.4 100.8 98.6 94.1 91.1 88.4 88.6 87.1 91.3 4.9% 0.9%<br />
Portugal 17.3 17.9 19.1 19.5 20.5 22.7 23.3 24.8 25.0 24.6 26.7 8.8% 0.3%<br />
Romania 47.3 45.4 48.6 48.2 45.2 41.3 36.9 37.0 37.3 38.6 39.8 3.0% 0.4%<br />
Russian Federation 770.4 702.8 668.1 647.2 610.9 611.4 621.1 636.0 637.5 646.6 670.8 3.7% 6.9%<br />
Slovakia 17.1 16.6 17.3 17.5 17.1 17.6 17.5 18.1 18.6 19.3 19.0 –1.7% 0.2%<br />
Spain 93.9 96.9 100.5 104.8 111.7 118.1 122.7 129.2 133.0 134.7 141.5 5.1% 1.5%<br />
Sweden 49.9 49.8 50.1 48.8 50.4 51.6 51.6 48.6 52.1 48.5 46.4 –4.4% 0.5%<br />
Switzerland 28.1 29.4 27.9 27.1 28.9 29.1 30.1 29.4 31.5 29.5 29.4 –0.5% 0.3%<br />
Turkey 57.8 56.2 60.1 67.7 69.6 70.6 68.9 73.7 70.8 71.6 74.3 3.8% 0.8%<br />
Turkmenistan 11.6 12.9 11.1 12.0 12.1 12.0 13.0 14.4 15.5 15.9 16.9 6.0% 0.2%<br />
Ukraine 184.3 157.7 147.8 141.6 138.9 133.7 136.5 136.7 135.9 133.6 133.3 –0.2% 1.4%<br />
United Kingdom 216.6 213.6 214.4 224.8 220.4 224.0 222.4 223.6 226.4 222.1 223.2 0.5% 2.3%<br />
Uzbekistan 48.3 47.8 47.6 49.0 50.1 51.8 53.7 51.6 55.4 56.7 51.7 –8.7% 0.5%<br />
Other Europe & Eurasia 68.7 60.9 61.4 65.1 68.3 69.1 64.5 64.7 66.9 66.8 69.7 4.4% 0.7%<br />
Total Europe & Eurasia 2913.8 2793.0 2778.4 2803.5 2758.3 2773.2 2775.8 2822.8 2851.0 2850.5 2913.4 2.2% 29.9%<br />
Iran 78.3 85.2 93.3 98.5 103.7 105.2 112.1 114.6 118.9 127.1 129.1 1.6% 1.3%<br />
Kuwait 9.9 11.6 14.8 14.6 15.3 17.7 18.1 19.0 19.1 18.6 21.2 13.6% 0.2%<br />
Qatar 13.0 13.0 13.1 13.4 14.2 14.5 13.7 9.8 11.2 12.0 12.2 1.4% 0.1%<br />
Saudi Arabia 88.1 92.0 90.1 93.7 96.1 101.0 102.5 107.2 111.0 114.4 121.9 6.5% 1.3%<br />
United Arab Emirates 34.9 37.7 40.3 42.4 43.9 41.8 41.8 40.5 42.9 47.2 48.8 3.3% 0.5%<br />
Other Middle East 69.3 72.9 77.6 80.3 85.2 88.0 89.4 92.7 95.8 97.4 93.7 –3.8% 1.0%<br />
Total Middle East 293.5 312.4 329.3 342.9 358.4 368.0 377.5 383.9 399.0 416.8 426.8 2.4% 4.4%<br />
Algeria 26.5 26.9 28.0 28.0 26.5 27.5 27.9 26.9 27.8 28.5 29.9 5.0% 0.3%<br />
Egypt 33.7 34.4 36.4 38.4 39.9 41.9 44.7 47.6 49.4 49.5 52.0 4.9% 0.5%<br />
South Africa 89.8 95.3 100.5 106.0 109.4 108.8 107.9 108.4 107.0 111.0 116.9 5.4% 1.2%<br />
Other Africa 76.9 79.2 81.2 83.7 85.5 88.2 91.3 93.3 95.5 98.0 100.8 2.9% 1.0%<br />
Total Africa 226.9 235.7 246.1 256.0 261.2 266.5 271.8 276.2 279.6 286.9 299.6 4.4% 3.1%<br />
Australia 91.9 95.1 98.4 101.2 105.2 108.1 110.5 111.0 112.9 116.2 115.6 –0.5% 1.2%<br />
Bangladesh 7.8 8.4 9.9 10.0 10.6 11.0 11.0 12.7 14.1 14.9 15.8 6.2% 0.2%<br />
China 758.4 811.8 893.6 917.4 930.4 864.3 770.3 766.0 837.9 1035.7 1178.3 13.8% 12.1%<br />
China Hong Kong SAR 15.6 14.1 15.1 15.0 15.1 15.4 15.6 15.6 18.9 20.4 21.0 3.1% 0.2%<br />
India 222.4 235.5 254.6 271.6 285.6 296.0 304.0 320.4 324.2 338.0 345.3 2.2% 3.5%<br />
Indonesia 65.1 67.9 73.5 80.1 84.0 80.0 89.1 95.0 101.1 104.4 107.0 2.5% 1.1%<br />
Japan 461.8 479.8 493.8 503.6 507.5 502.2 508.8 515.9 514.8 506.6 504.8 –0.4% 5.2%<br />
Malaysia 29.6 32.3 33.1 37.7 37.8 37.3 38.3 45.7 48.0 51.9 54.4 4.7% 0.6%<br />
New Zealand 16.0 16.5 16.9 17.2 17.3 16.8 17.4 17.9 18.0 18.2 18.4 1.0% 0.2%<br />
Pakistan 31.7 33.7 36.4 38.3 37.4 39.6 40.8 42.0 42.9 43.9 44.8 2.0% 0.5%<br />
Philippines 16.5 17.5 19.6 21.1 22.6 22.9 22.7 22.6 22.7 23.5 25.4 8.0% 0.3%<br />
Singapore 28.1 32.0 33.3 31.6 33.8 34.7 32.9 35.0 40.5 39.9 38.9 –2.5% 0.4%<br />
South Korea 125.4 135.5 148.6 163.8 179.6 165.5 180.5 191.1 195.9 205.0 212.0 3.4% 2.2%<br />
Taiwan 57.9 62.3 65.7 68.9 72.9 77.5 81.1 85.6 86.8 90.8 94.8 4.5% 1.0%<br />
Thailand 40.6 45.5 52.4 58.4 61.2 58.2 59.7 62.4 63.6 69.2 74.0 7.0% 0.8%<br />
Other Asia Pacific 43.6 42.9 43.7 43.4 44.9 44.9 47.0 50.6 54.3 56.2 58.0 3.2% 0.6%<br />
Total Asia Pacific 2012.3 2130.8 2288.7 2379.4 2445.8 2374.4 2329.6 2389.5 2496.7 2734.8 2908.4 6.3% 29.9%<br />
TOTAL WORLD 8206.2 8299.8 8533.5 8780.3 8864.0 8853.3 8868.2 9059.5 9156.3 9464.5 9741.1 2.9% 100.0%<br />
of which: European Union 15 1339.3 1336.7 1363.3 1408.6 1406.8 1432.2 1441.4 1462.8 1483.6 1471.5 1498.1 1.8% 15.4%<br />
OECD 4745.2 4824.6 4936.1 5105.3 5151.9 5174.1 5246.9 5355.9 5321.7 5356.2 5397.9 0.8% 55.4%<br />
Former Soviet Union 1164.8 1053.5 997.5 961.1 920.0 916.0 923.0 940.8 947.9 958.0 987.0 3.0% 10.1%<br />
Other EMEs 2296.3 2421.7 2600.0 2713.9 2792.1 2763.2 2698.3 2762.8 2886.7 3150.3 3356.2 6.5% 34.5%<br />
*In this Review, primary energy comprises commercially traded fuels only. Excluded, therefore, are fuels such as wood, peat and animal waste which, though important in many<br />
countries, are unreliably documented in terms of consumption statistics.<br />
◆ Less than 0.05%.<br />
37
Primary energy<br />
2002 2003<br />
Consumption by fuel*<br />
Natural Nuclear Hydro- Natural Nuclear Hydro-<br />
Million tonnes oil equivalent Oil gas Coal energy electricity Total Oil gas Coal energy electricity Total<br />
USA 897.4 595.7 559.4 185.8 58.4 2296.7 914.3 566.8 573.9 181.9 60.9 2297.8<br />
Canada 92.2 77.0 30.7 16.9 72.1 289.0 96.4 78.7 31.0 16.8 68.6 291.4<br />
Mexico 81.4 38.4 7.6 2.2 5.6 135.2 82.6 40.8 7.8 2.4 4.5 138.1<br />
Total North America 1071.0 711.2 597.7 204.9 136.2 2721.0 1093.2 686.3 612.7 201.1 133.9 2727.3<br />
Argentina 17.1 27.2 0.5 1.3 8.3 54.5 17.5 31.1 0.6 1.7 7.8 58.7<br />
Brazil 85.5 13.0 11.5 3.1 64.5 177.6 84.1 14.3 11.0 3.0 68.9 181.4<br />
Chile 10.6 5.9 2.4 – 5.2 24.0 10.4 6.3 2.4 – 5.1 24.2<br />
Colombia 10.0 5.5 2.0 – 7.6 25.2 10.0 5.4 2.6 – 8.1 26.2<br />
Ecuador 5.9 0.1 – – 1.7 7.7 6.1 0.1 – – 1.7 7.8<br />
Peru 6.9 0.4 0.4 – 4.1 11.8 7.4 0.5 0.4 – 4.2 12.5<br />
Venezuela 27.0 25.6 0.1 – 13.5 66.1 23.9 26.4 0.1 – 13.7 64.1<br />
Other S. & Cent. America 56.2 13.0 0.7 – 17.8 87.6 57.3 14.4 0.7 – 18.4 90.8<br />
Total S. & Cent. America 219.2 90.7 17.5 4.4 122.7 454.5 216.6 98.6 17.7 4.7 127.8 465.5<br />
Austria 13.0 7.0 3.0 – 8.6 31.7 14.3 7.7 3.0 – 6.9 31.9<br />
Azerbaijan 3.6 7.0 † – 0.5 11.0 4.4 7.2 † – 0.6 12.1<br />
Belarus 5.2 14.3 0.3 – † 19.8 6.1 14.8 0.3 – † 21.1<br />
Belgium & Luxembourg 33.5 13.4 6.7 10.7 0.6 64.9 34.8 14.4 6.5 10.8 0.5 66.9<br />
Bulgaria 4.2 2.6 7.2 4.6 0.5 19.1 4.3 2.6 8.1 3.9 0.5 19.4<br />
Czech Republic 8.2 7.8 20.4 4.2 0.6 41.2 8.6 8.1 20.5 5.9 0.4 43.4<br />
Denmark 9.6 4.6 4.2 – † 18.4 9.3 4.7 5.7 – † 19.6<br />
Finland 10.9 3.6 4.4 5.4 2.4 26.7 11.4 4.0 5.8 5.5 2.1 28.9<br />
France 92.9 37.5 12.2 98.8 15.1 256.5 94.2 39.4 12.4 99.8 14.8 260.6<br />
Germany 127.4 74.3 84.6 37.3 6.3 330.0 125.1 77.0 87.1 37.3 5.7 332.2<br />
Greece 20.1 1.8 9.8 – 0.8 32.5 20.9 2.1 10.3 – 1.2 34.4<br />
Hungary 6.4 10.7 3.1 3.2 † 23.4 6.2 11.7 3.3 2.5 † 23.7<br />
Iceland 0.9 – 0.1 – 1.6 2.6 0.9 – 0.1 – 1.6 2.6<br />
Republic of Ireland 8.8 3.7 1.7 – 0.3 14.5 8.4 3.7 1.6 – 0.2 13.9<br />
Italy 92.9 59.0 14.2 – 10.7 176.8 92.1 64.5 15.3 – 10.0 181.9<br />
Kazakhstan 10.0 10.0 22.8 – 1.9 44.6 9.5 11.3 26.9 – 1.9 49.6<br />
Lithuania 2.5 2.6 0.1 3.2 0.2 8.6 2.5 2.8 0.1 3.5 0.2 9.2<br />
Netherlands 43.8 36.0 9.0 0.9 † 89.7 44.5 35.4 9.2 0.9 † 90.0<br />
Norway 9.4 3.6 0.5 – 29.4 42.9 9.6 3.9 0.5 – 24.0 38.0<br />
Poland 19.4 10.1 56.7 – 0.9 87.1 20.5 11.3 58.8 – 0.7 91.3<br />
Portugal 16.2 2.5 4.1 – 1.8 24.6 16.6 2.7 3.9 – 3.6 26.7<br />
Romania 10.6 15.5 7.6 1.2 3.6 38.6 11.0 16.6 8.0 1.1 3.1 39.8<br />
Russian Federation 123.5 350.0 103.9 32.1 37.2 646.6 124.7 365.2 111.3 34.0 35.6 670.8<br />
Slovakia 3.5 6.5 4.0 4.1 1.2 19.3 3.7 6.4 4.1 4.1 0.8 19.0<br />
Spain 73.8 18.8 21.9 14.3 6.0 134.7 75.5 21.5 20.6 14.0 9.9 141.5<br />
Sweden 15.2 0.7 2.2 15.4 15.0 48.5 15.8 0.7 2.2 15.5 12.1 46.4<br />
Switzerland 12.4 2.5 0.1 6.2 8.3 29.5 12.1 2.6 0.1 6.2 8.3 29.4<br />
Turkey 31.3 15.6 17.1 – 7.6 71.6 31.9 18.9 15.5 – 8.0 74.3<br />
Turkmenistan 4.0 11.9 – – – 15.9 3.7 13.2 – – – 16.9<br />
Ukraine 12.4 63.1 38.3 17.7 2.2 133.6 13.1 60.8 39.0 18.4 2.1 133.3<br />
United Kingdom 78.3 85.6 36.7 19.9 1.7 222.1 76.8 85.7 39.1 20.1 1.3 223.2<br />
Uzbekistan 6.8 47.2 1.0 – 1.6 56.7 6.5 42.5 1.0 – 1.7 51.7<br />
Other Europe & Eurasia 22.6 12.0 15.2 1.8 15.2 66.8 23.5 12.4 15.7 1.6 16.4 69.7<br />
Total Europe & Eurasia 933.1 941.5 513.1 280.9 181.9 2850.5 942.3 975.7 535.9 285.3 174.3 2913.4<br />
Iran 53.2 71.3 0.8 – 1.8 127.1 54.0 72.4 0.7 – 2.0 129.1<br />
Kuwait 11.4 7.2 – – – 18.6 13.7 7.5 – – – 21.2<br />
Qatar 2.0 10.0 – – – 12.0 1.7 10.4 – – – 12.2<br />
Saudi Arabia 63.4 51.0 – – – 114.4 67.0 54.9 – – – 121.9<br />
United Arab Emirates 14.4 32.8 – – – 47.2 15.0 33.7 – – – 48.8<br />
Other Middle East 68.6 20.3 7.6 – 0.8 97.4 63.4 21.5 7.9 – 0.9 93.7<br />
Total Middle East 213.1 192.7 8.4 – 2.6 416.8 214.9 200.4 8.6 – 3.0 426.8<br />
Algeria 9.7 18.2 0.5 – † 28.5 10.0 19.3 0.6 – 0.1 29.9<br />
Egypt 25.2 20.4 0.7 – 3.2 49.5 25.9 22.1 0.7 – 3.2 52.0<br />
South Africa 23.6 – 83.5 2.9 0.9 111.0 24.2 – 88.9 3.0 0.8 116.9<br />
Other Africa 59.3 16.9 7.1 – 14.7 98.0 60.3 18.7 7.0 – 14.8 100.8<br />
Total Africa 117.9 55.5 91.9 2.9 18.8 286.9 120.5 60.1 97.2 3.0 18.8 299.6<br />
Australia 38.0 22.7 51.9 – 3.7 116.2 38.1 23.7 50.2 – 3.7 115.6<br />
Bangladesh 4.0 10.3 0.4 – 0.2 14.9 4.2 11.0 0.4 – 0.2 15.8<br />
China 246.9 26.7 694.2 5.7 62.2 1035.7 275.2 29.5 799.7 9.8 64.0 1178.3<br />
China Hong Kong SAR 12.9 2.1 5.4 – – 20.4 13.1 1.4 6.6 – – 21.0<br />
India 111.3 25.8 181.0 4.4 15.5 338.0 113.3 27.1 185.3 4.1 15.6 345.3<br />
Indonesia 53.1 31.1 18.0 – 2.3 104.4 53.9 32.0 18.9 – 2.3 107.0<br />
Japan 243.6 64.7 106.6 71.3 20.5 506.6 248.7 68.9 112.2 52.2 22.8 504.8<br />
Malaysia 22.5 24.1 3.7 – 1.7 51.9 23.9 25.6 3.2 – 1.7 54.4<br />
New Zealand 6.6 4.9 1.3 – 5.4 18.2 6.9 4.1 1.8 – 5.5 18.4<br />
Pakistan 18.0 18.5 2.4 0.4 4.6 43.9 17.0 19.0 2.7 0.4 5.6 44.8<br />
Philippines 15.6 1.6 4.7 – 1.6 23.5 15.6 2.4 5.6 – 1.8 25.4<br />
Singapore 35.5 4.4 – – – 39.9 34.1 4.8 – – – 38.9<br />
South Korea 104.7 23.1 49.1 27.0 1.2 205.0 105.7 24.2 51.1 29.3 1.6 212.0<br />
Taiwan 40.0 7.7 32.7 9.0 1.4 90.8 41.7 7.8 35.0 8.8 1.6 94.8<br />
Thailand 36.4 21.9 9.2 – 1.7 69.2 38.7 23.9 9.7 – 1.7 74.0<br />
Other Asia Pacific 19.4 4.7 23.2 – 8.8 56.2 19.0 5.5 23.9 – 9.6 58.0<br />
Total Asia Pacific 1008.3 294.3 1183.7 117.7 130.8 2734.8 1049.1 310.9 1306.2 104.7 137.5 2908.4<br />
TOTAL WORLD 3562.6 2285.8 2412.3 610.8 593.0 9464.5 3636.6 2331.9 2578.4 598.8 595.4 9741.1<br />
of which: European Union 15 636.3 348.5 214.7 202.7 69.3 1471.5 639.7 363.5 222.7 204.0 68.3 1498.1<br />
OECD 2191.6 1231.8 1123.3 523.5 286.0 5356.2 2225.8 1233.5 1153.7 505.3 279.6 5397.9<br />
Former Soviet Union 172.7 512.9 167.1 53.4 51.9 958.0 175.4 524.4 179.3 56.4 51.4 987.0<br />
Other EMEs 1198.4 541.1 1121.9 33.8 255.1 3150.3 1235.4 574.0 1245.4 37.1 264.3 3356.2<br />
*In this Review, primary energy comprises commercially traded fuels only. Excluded, therefore, are fuels such as wood, peat and animal waste which, though important in many<br />
countries, are unreliably documented in terms of consumption statistics.<br />
†Less than 0.05.<br />
38 <strong>BP</strong> 2004 Statistical Review of World Energy
World consumption<br />
Million tonnes oil equivalent<br />
10000<br />
9000<br />
8000<br />
7000<br />
6000<br />
5000<br />
4000<br />
3000<br />
2000<br />
1000<br />
0 78 79 80 81 82 83 84 85 86 87 88 89 90 91 92 93 94 95 96 97 98 99 00 01 02 03<br />
Oil<br />
Natural gas Nuclear energy Hydroelectricity Coal<br />
World primary energy consumption grew by 2.9% in 2003, well above the 10-year trend growth rate of 1.7% per annum. As in 2002, the global figure was heavily<br />
influenced by China, where reported energy use increased by almost 14%.<br />
Regional consumption pattern 2003<br />
Percentage<br />
100<br />
90<br />
80<br />
70<br />
60<br />
50<br />
40<br />
30<br />
20<br />
10<br />
0<br />
North America S. & Cent. America Europe & Eurasia Middle East Africa Asia Pacific<br />
Oil<br />
Natural gas Nuclear energy Hydroelectricity Coal<br />
Oil remains the largest single source of energy in most parts of the world. The exceptions are the Former Soviet Union, where gas dominates and Asia Pacific where<br />
coal is the dominant fuel.<br />
39
Primary energy<br />
Fossil fuel reserves-to-production (R/P) ratios at end 2003<br />
Years<br />
600<br />
500<br />
400<br />
300<br />
200<br />
100<br />
0 OECD Former Soviet Union<br />
EMEs excl. Former Soviet Union<br />
World<br />
Oil<br />
Natural gas<br />
Coal<br />
The world’s reserves-to-production ratio for coal is around five times that for oil and more than three times that for natural gas. Coal’s dominance in reserves-toproduction<br />
ratio terms is particularly pronounced in the OECD and the Former Soviet Union.<br />
Consumption per capita<br />
Tonnes oil equivalent<br />
toe per capita<br />
0-1.5<br />
1.5-3<br />
3-4.5<br />
4.5-6<br />
> 6<br />
40 <strong>BP</strong> 2004 Statistical Review of World Energy
Appendices<br />
Approximate conversion factors<br />
To<br />
tonnes US tonnes/<br />
Crude oil* (metric) kilolitres barrels gallons year<br />
From<br />
Multiply by<br />
Tonnes (metric) 1 1.165 7.33 307.86 –<br />
Kilolitres 0.8581 1 6.2898 264.17 –<br />
Barrels 0.1364 0.159 1 42 –<br />
US gallons 0.00325 0.0038 0.0238 1 –<br />
Barrels/day – – – – 49.8<br />
*Based on worldwide average gravity.<br />
To convert<br />
Products<br />
barrels tonnes kilolitres tonnes<br />
to tonnes to barrels to tonnes to kilolitres<br />
Multiply by<br />
LPG 0.086 11.6 0.542 1.844<br />
Gasoline 0.118 8.5 0.740 1.351<br />
Kerosene 0.128 7.8 0.806 1.240<br />
Gas oil/diesel 0.133 7.5 0.839 1.192<br />
Fuel oil 0.149 6.7 0.939 1.065<br />
To<br />
billion cubic billion cubic million tonnes million tonnes trillion British million barrels<br />
Natural gas and LNG metres NG feet NG oil equivalent LNG thermal units oil equivalent<br />
From<br />
Multiply by<br />
1 billion cubic metres NG 1 35.3 0.90 0.73 36 6.29<br />
1 billion cubic feet NG 0.028 1 0.026 0.021 1.03 0.18<br />
1 million tonnes oil equivalent 1.111 39.2 1 0.805 40.4 7.33<br />
1 million tonnes LNG 1.38 48.7 1.23 1 52.0 8.68<br />
1 trillion British thermal units 0.028 0.98 0.025 0.02 1 0.17<br />
1 million barrels oil equivalent 0.16 5.61 0.14 0.12 5.8 1<br />
Units<br />
1 metric tonne = 2204.62 lb.<br />
= 1.1023 short tons<br />
1 kilolitre = 6.2898 barrels<br />
1 kilolitre = 1 cubic metre<br />
1 kilocalorie (kcal) = 4.187 kJ = 3.968 Btu<br />
1 kilojoule (kJ) = 0.239 kcal = 0.948 Btu<br />
1 British thermal unit (Btu) = 0.252 kcal<br />
= 1.055 kJ<br />
1 kilowatt-hour (kWh) = 860 kcal<br />
= 3600 kJ = 3412 Btu<br />
Calorific equivalents<br />
One tonne of oil equivalent equals<br />
approximately:<br />
Heat units 10 million kilocalories<br />
42 gigajoules<br />
40 million Btu<br />
Solid fuels 1.5 tonnes of hard coal<br />
3 tonnes of lignite<br />
Gaseous fuels See natural gas and<br />
LNG table<br />
Electricity 12 megawatt-hours<br />
One million tonnes of oil produces about<br />
4500 gigawatt-hours (= 4.5 terawatthours)<br />
of electricity in a modern power<br />
station.<br />
Definitions<br />
Statistics published in this Review are taken from government sources and<br />
published data. No use is made of confidential information obtained by <strong>BP</strong><br />
in the course of its business.<br />
North America<br />
USA (excluding Puerto Rico), Canada and Mexico.<br />
South and Central America<br />
Caribbean (including Puerto Rico), Central and South America.<br />
Europe<br />
European members of the OECD plus Albania, Bosnia-Herzegovina, Bulgaria,<br />
Croatia, Cyprus, Former Yugoslav Republic of Macedonia, Gibraltar, Malta,<br />
Romania, Slovenia, Yugoslavia.<br />
Former Soviet Union<br />
Armenia, Azerbaijan, Belarus, Estonia, Georgia, Kazakhstan, Krgyzstan,<br />
Latvia, Lithuania, Moldova, Russian Federation, Tajikistan, Turkmenistan,<br />
Ukraine, Uzbekistan.<br />
Europe & Eurasia<br />
This includes all countries listed above under the headings Europe and the<br />
Former Soviet Union.<br />
Middle East<br />
Arabian Peninsula, Iran, Iraq, Israel, Jordan, Lebanon, Syria.<br />
North Africa<br />
Territories on the north coast of Africa from Egypt to Western Sahara.<br />
West Africa<br />
Territories on the west coast of Africa from Mauritania to Angola, including<br />
Cape Verde, Chad.<br />
East and Southern Africa<br />
Territories on the east coast of Africa from Sudan to Republic of South Africa.<br />
Also Botswana, Madagascar, Malawi, Namibia, Uganda, Zambia, Zimbabwe.<br />
Asia Pacific<br />
Brunei, Cambodia, China, China Hong Kong SAR*, Indonesia, Japan, Laos,<br />
Malaysia, Mongolia, North Korea, Philippines, Singapore, South Asia (Afghanistan,<br />
Bangladesh, India, Myanmar, Nepal, Pakistan and Sri Lanka), South Korea, Taiwan,<br />
Thailand, Vietnam, Australia, New Zealand, Papua New Guinea and Oceania.<br />
*Special Administrative Region.<br />
Australasia<br />
Australia, New Zealand.<br />
Country groupings are made purely for statistical purposes and are not<br />
intended to imply any judgement about political or economic standings.<br />
OECD members<br />
Europe: Austria, Belgium, Czech Republic, Denmark, Finland, France, Germany,<br />
Greece, Hungary, Iceland, Republic of Ireland, Italy, Luxembourg, Netherlands,<br />
Norway, Poland, Portugal, Slovakia, Spain, Sweden, Switzerland, Turkey,<br />
United Kingdom.<br />
Other member countries: Australia, Canada, Japan, Mexico, New Zealand,<br />
South Korea, USA.<br />
OPEC members<br />
Middle East: Iran, Iraq, Kuwait, Qatar, Saudi Arabia, United Arab Emirates<br />
(Abu Dhabi, Dubai, Ras-al-Khaimah and Sharjah). North Africa: Algeria, Libya.<br />
West Africa: Nigeria. Asia Pacific: Indonesia. South America: Venezuela.<br />
(Since Ecuador and Gabon have withdrawn from OPEC, they are excluded<br />
from all OPEC totals.)<br />
European Union members (15)<br />
Austria, Belgium, Denmark, Finland, France, Germany, Greece, Republic<br />
of Ireland, Italy, Luxembourg, Netherlands, Portugal, Spain, Sweden, UK.<br />
Other EMEs (Emerging Market Economies)<br />
South and Central America, Africa, Middle East, Non-OECD Asia and<br />
Non-OECD Europe.<br />
Other terms<br />
Tonnes: Metric tons.<br />
Percentages: Calculated before rounding of actuals. All annual changes and<br />
shares of totals are on a weight basis except on pages 4, 12, 16, 18 and 20.<br />
Rounding differences: Because of rounding, some totals – including the 2003<br />
share of total – may not agree exactly with the sum of their component parts.<br />
www.bp.com/statisticalreview2004
Further information<br />
Questions on data<br />
<strong>BP</strong> regrets it is unable to deal with enquiries about the data in the<br />
Statistical Review of World Energy.<br />
Ordering copies<br />
Readers in North and South America should address requests for copies<br />
of the publication to:<br />
JPMorgan Chase Bank<br />
PO Box 43013, Providence, RI 02940-3013<br />
Telephone: +1 781 575 3346<br />
Toll-free in US and Canada: +1 877 638 5672<br />
Readers outside North and South America should address requests for copies<br />
of the publication to:<br />
<strong>BP</strong> Distribution Services<br />
c/o Air Action International Limited<br />
International Distribution Centre<br />
Crabtree Road, Thorpe<br />
Egham, Surrey TW20 8RS, UK<br />
Telephone: +44 (0)870 241 3269<br />
Fax: +44 (0)870 240 5753<br />
bpdistributionservices@bp.com<br />
Internet<br />
The data in the publication is also available at www.bp.com/statisticalreview2004<br />
In addition to viewing, data can be downloaded and charted using the<br />
charting tool.<br />
Quoting from the Review<br />
Publishers are welcome to quote from this document provided that they<br />
attribute the source (for example, in a caption) to the <strong>BP</strong> Statistical Review<br />
of World Energy 2004. However, where extensive reproduction of tables<br />
and/or diagrams is planned, permission must first be obtained from:<br />
The Editor, <strong>BP</strong> Statistical Review of World Energy<br />
<strong>BP</strong> p.l.c.<br />
1 St James’s Square<br />
London SW1Y 4PD<br />
sr@bp.com<br />
The redistribution and reproduction of data whose source is Platts is strictly<br />
prohibited without prior authorization from Platts.<br />
Acknowledgements<br />
Paper<br />
This document is printed on FSC © certified Mohawk Options, 100% PC White.<br />
This paper contains 100% post-consumer recycled fibre and is manufactured<br />
entirely with wind energy. It is manufactured in accordance with a Forest<br />
Stewardship Council (FSC) pilot programme that certifies products made with<br />
high percentages of post-consumer reclaimed materials.<br />
Design and production<br />
Designed and produced by Pauffley Ltd, London<br />
Printed in England by the colourhouse<br />
© <strong>BP</strong> p.l.c. 2004