Air traffic update and forecast for Latin America - ACI
Air traffic update and forecast for Latin America - ACI
Air traffic update and forecast for Latin America - ACI

You also want an ePaper? Increase the reach of your titles
YUMPU automatically turns print PDFs into web optimized ePapers that Google loves.
XVIII <strong>ACI</strong>-LAC Regional Annual General<br />
Assembly, Conference & Exhibition<br />
<strong>Air</strong> <strong>traffic</strong> <strong>update</strong> <strong>and</strong> <strong><strong>for</strong>ecast</strong><br />
<strong>for</strong> <strong>Latin</strong> <strong>America</strong><br />
Gustavo Garcia MIr<strong>and</strong>a, head of <strong>Air</strong>line Consulting,<br />
Advanced Logistics Group<br />
Salvador de Bahia, November 18th, 2009<br />
A D V A N C E D L O G I S T I C S G R O U P<br />
Madrid · Barcelona · Caracas · Lima · México DF · Santiago de Chile<br />
Buenos <strong>Air</strong>es · Sao Paulo · Londres · París · Lisboa · Milán · Dubai 0
Summary<br />
• <strong>Latin</strong> <strong>America</strong>n aviation in context<br />
• Markets<br />
• Actors<br />
• Current crisis<br />
• Short- <strong>and</strong> Mid-term <strong><strong>for</strong>ecast</strong>s<br />
1
<strong>Latin</strong> <strong>America</strong>n aviation in the world context<br />
• Some 2.750 millions passengers traveled by air in the world during 2008, which represents some 0,4 trips<br />
per inhabitant. The revenue generated by airlines was around 535 billion US$<br />
• <strong>Latin</strong> airlines represent only around 5% of world aviation. However, there is a traditional deficit of<br />
international capacity among <strong>Latin</strong> airlines, which is covered mainly by US or European ones.<br />
• Adding all the <strong>traffic</strong> generated from/to the region, the 5% figure grows to some 8%<br />
LatAm airlines<br />
10%<br />
8%<br />
LatAm as a region<br />
7,7%<br />
8,0%<br />
8,7%<br />
2008 US$<br />
Revenue<br />
LatAm<br />
airlines<br />
28 b<br />
World<br />
airlines<br />
536 b<br />
6%<br />
4%<br />
5,9%<br />
4,1%<br />
5,2%<br />
Operating P/L<br />
Net P/L<br />
1050 m<br />
-1250 m<br />
1500 m<br />
-10400 m<br />
2%<br />
0%<br />
Pax RPKs Revenue<br />
2008 cumulated data <strong>for</strong> some 60 airlines or Groups in <strong>Latin</strong> <strong>America</strong>. Other sources: IATA, ICAO.<br />
2
Travel propensity in <strong>Latin</strong> <strong>America</strong> - general<br />
• Although with big variations<br />
among countries, there is a<br />
true correlation between<br />
the air trips per capita <strong>and</strong><br />
the average income.<br />
• <strong>Latin</strong> <strong>America</strong>n countries<br />
are situated in the region of<br />
the table where discreet<br />
increases in income per<br />
capita (or descends in the<br />
average fare) drive to big<br />
increases in trips per<br />
capita.<br />
10,0<br />
1,0<br />
China<br />
0,1<br />
Jamaica<br />
C.Rica Turkey<br />
Ecuador<br />
Portugal<br />
Trinidad&T<br />
Chile<br />
Russia<br />
México<br />
Brasil<br />
Guatemala<br />
Pax/hab vs GNI/pc, 2008<br />
Korea<br />
Spain<br />
Italy<br />
Canada<br />
France<br />
Japan<br />
Icel<strong>and</strong><br />
<strong>Latin</strong> <strong>America</strong><br />
Europe<br />
World<br />
GNI/capita (US$)<br />
0 10.000 20.000 30.000 40.000 50.000 60.000 70.000<br />
USA<br />
Switzerl<strong>and</strong><br />
Per capita air trips vs GNI per capita, 2008<br />
Sources: World Bank, CEPAL, <strong>ACI</strong>, Civil Aviation authorities, ALG<br />
3
Travel propensity in <strong>Latin</strong> <strong>America</strong> – more in detail<br />
• The Caribbean countries show a<br />
much higher ratio of trips per<br />
capita because of the incoming<br />
tourism.<br />
• In Central <strong>and</strong> South <strong>America</strong><br />
the effect of tourism is also<br />
important <strong>for</strong> Costa Rica <strong>and</strong><br />
Ecuador. Panamá is also above<br />
average, due to the strong<br />
influence of its local airline in<br />
attracting international<br />
passengers.<br />
• Brazil, Chile, Mexico, Bolivia<br />
show the highest ratios of trips<br />
per capita <strong>for</strong> domestic flights.<br />
Certainly the big distances <strong>and</strong><br />
difficult ground transportation<br />
have a strong influence on it.<br />
10,00<br />
1,00<br />
0,10<br />
0,01<br />
Jamaica<br />
Pax/hab vs GNI/pc, 2008<br />
Rep.Dom. Costa Rica<br />
Chile<br />
Cuba<br />
EcuadorPanamá<br />
Bolivia<br />
Perú<br />
Guatemala<br />
Brazil<br />
Argentina<br />
México<br />
Trinidad&T<br />
Bahamas<br />
Sud&C.Am, Total<br />
Caribbean, Total<br />
Domestic<br />
GNI/capita (US$)<br />
0 5.000 10.000 15.000 20.000<br />
Per capita air trips vs GNI per capita, 2008<br />
Sources: World Bank, CEPAL, <strong>ACI</strong>, Civil Aviation authorities, ALG<br />
4
Big numbers of <strong>Latin</strong> <strong>America</strong>n aviation<br />
• In a few words, <strong>Latin</strong> <strong>America</strong>n aviation includes:<br />
46 countries <strong>and</strong><br />
territories. Nearly 550<br />
million inhabitants<br />
More than 80 airlines<br />
220 million pax in<br />
2008<br />
70 airports with more<br />
than 1 million pax in<br />
2008<br />
Some 50 billion US$<br />
in revenue (pax.ops)<br />
13 in South <strong>America</strong><br />
8 in Central <strong>America</strong> (including Mexico)<br />
25 in the Caribbean<br />
21 in the 9 big Groups (one billion US$ revenue or more)<br />
20 with revenues between 75 <strong>and</strong> 350 m$ per year<br />
30+ with revenues between 10 <strong>and</strong> 75 m$<br />
12 freighter airlines with more than 12 m$ in revenue<br />
120 million carried by the big 9 Groups<br />
44 carried by other <strong>Latin</strong> airlines<br />
57 carried by US <strong>and</strong> European airlines (charter included)<br />
33 in South <strong>America</strong><br />
19 in Mexico <strong>and</strong> Central <strong>America</strong><br />
18 in the Caribbean<br />
23,3 b$ the big 9 Groups<br />
4,5 b$ other <strong>Latin</strong> airlines<br />
22,3 b$ US <strong>and</strong> European airlines (charter included)<br />
5
Main <strong>Latin</strong> markets<br />
70<br />
60<br />
50<br />
40<br />
30<br />
20<br />
10<br />
0<br />
69,6<br />
54,2 28,2<br />
12,8<br />
2,6<br />
56,4<br />
8,4<br />
19,8<br />
39,1<br />
4,0<br />
18,0<br />
17,1<br />
Million pax by country, 2008<br />
15,3<br />
2,4<br />
5,4<br />
7,4<br />
Doméstico<br />
Resto Intl<br />
Intl o/d USA<br />
15,2<br />
13,3<br />
9,8 9,7 8,7<br />
9,9 5,8<br />
5,9<br />
5,6 4,8 4,2<br />
3,5 6,4<br />
3,0 4,2 3,3<br />
3,1<br />
1,8 1,2 1,2 0,7 1,2 1,9 0,8<br />
Brasil Caribbean Colombia Venezuela<br />
Mexico CentralAm Argentina Chile<br />
Perú<br />
Ecuador<br />
• Brazil <strong>and</strong> Mexico cumulate half<br />
of the passengers carried by air<br />
in the region.<br />
• Brazilian domestic market is the<br />
fifth biggest in the world, <strong>and</strong><br />
Mexican is around the 10th.<br />
Mexico <strong>and</strong> Caribbean are the<br />
2nd <strong>and</strong> 4th international<br />
destinations <strong>for</strong> US citizens.<br />
• The Caribbean as a whole is the<br />
third biggest market. However,<br />
more than 80% of the <strong>traffic</strong> is<br />
carried by US <strong>and</strong> European<br />
airlines.<br />
• Central <strong>America</strong> <strong>and</strong> Colombia<br />
follow, with big ethnic <strong>and</strong><br />
domestic <strong>traffic</strong> respectively.<br />
Then Argentina, Venezuela,<br />
Chile, Perú…<br />
Sources: Civil Aviation authorities, CLAC, ALG estimates<br />
6
So, where is the money in LatAm…?<br />
• We have divided the <strong>Latin</strong><br />
<strong>America</strong>n market into<br />
more than 30 submarkets.<br />
• Of them, the 11 biggest<br />
account <strong>for</strong> 92% of the<br />
RPKs <strong>and</strong> 90% of the<br />
revenue (freight excluded)<br />
• South <strong>America</strong> – Europe is<br />
the biggest submarket by<br />
<strong>traffic</strong>, followed by<br />
Caribbean–Europe, South<br />
<strong>America</strong>–USA <strong>and</strong><br />
Domestic Brazil.<br />
3<br />
5<br />
28<br />
4<br />
8<br />
48<br />
64<br />
31<br />
99<br />
• Domestic Mexico is the<br />
seventh biggest<br />
submarket.<br />
Arrow width proportional to <strong>traffic</strong>.<br />
Figures: billion RPKs in 2008<br />
7
So, where is the money in LatAm…?<br />
• We have divided the <strong>Latin</strong><br />
<strong>America</strong>n market into<br />
more than 30 submarkets.<br />
• Of them, the 11 biggest<br />
account <strong>for</strong> 92% of the<br />
RPKs <strong>and</strong> 90% of the<br />
revenue (freight excluded)<br />
• South <strong>America</strong> – Europe is<br />
the biggest submarket.<br />
• Domestic Brazil is the fourth<br />
submarket by RPKs but the<br />
second in value (some 7<br />
billion US$ in 2008).<br />
• Traffic to/from Caribbean<br />
has lower value because<br />
of the big impact of<br />
charter operations.<br />
m.RPKs (2008)<br />
100.000<br />
80.000<br />
60.000<br />
40.000<br />
20.000<br />
0<br />
South Am. - W.Europe<br />
South <strong>America</strong> - US<br />
Caribbean - W.Europe<br />
Domestic Brazil<br />
Main regions in LatAm aviation<br />
Domestic Mexico<br />
Mexico - US<br />
Central Am. - W.Europe<br />
RPKs<br />
Revenue<br />
Intra South <strong>America</strong><br />
Caribbean - US<br />
Domestic South <strong>America</strong><br />
Central <strong>America</strong> - US<br />
m.US$ (2008)<br />
10.000<br />
Other<br />
8.000<br />
6.000<br />
4.000<br />
2.000<br />
0<br />
Sources: <strong>Air</strong>bus, ICAO, IATA, ALG elaboration<br />
8
… <strong>and</strong> which airlines get it?<br />
US$ m<br />
6000<br />
Biggest airlines operating in LatAm - revenues 2008<br />
5000<br />
4000<br />
3000<br />
2000<br />
5841<br />
4896<br />
4534<br />
3463<br />
<strong>Latin</strong><br />
US<br />
European<br />
1000<br />
0<br />
TAM<br />
AAL<br />
LAN<br />
2386 2170 21252100199618941641<br />
1289 1100 1000 878 850 703 694 607 535<br />
GLO<br />
AFKL<br />
IBE<br />
AMX<br />
MXA<br />
COA<br />
AVA<br />
DAL<br />
CMP<br />
TAI<br />
ARG<br />
USA<br />
FDX<br />
TAP<br />
DLH<br />
UAL<br />
BAW<br />
• 22% of the revenue generated in the region is catch by US <strong>and</strong> Canadian airlines, <strong>and</strong> another 22% by<br />
European ones. “Fair” share of external airlines should be 30%.<br />
• <strong>Latin</strong> services are in general the most profitable of international operations <strong>for</strong> US airlines.<br />
• Iberia (biggest European operator to LatAm) makes most of its profits out of its operations to the region.<br />
Sources: airline reports, US´ DOT, AEA, ALG elaboration<br />
9
The Big Nine <strong>Latin</strong> <strong>America</strong>n groups - revenues<br />
6000<br />
5000<br />
4000<br />
3000<br />
2000<br />
1000<br />
Revenue 2000-08, $m<br />
TAM<br />
LAN<br />
GOL+VRG<br />
MXA+CBE<br />
AMX+SLI<br />
AVA<br />
ARG+AUT<br />
COPA<br />
TACA<br />
VRG<br />
• TAM is the biggest airline by<br />
revenue in the region,<br />
followed by Grupo LAN <strong>and</strong><br />
GOL.<br />
• In spite of the collapse of<br />
Varig <strong>and</strong> the stagnation of<br />
Aerolineas Argentinas <strong>and</strong><br />
(to a lesser extent) the two<br />
big Mexicans, the growth in<br />
recent years has been<br />
spectacular.<br />
• Growth in revenue <strong>for</strong> the<br />
last three years:<br />
0<br />
2000 2001 2002 2003 2004 2005 2006 2007 2008<br />
- GOL x 3,1<br />
- TAM x 2,4<br />
- Avianca & COPA x 2,1<br />
- LAN x 1,8<br />
- TACA x 1,4<br />
- Aerolíneas ≈-10%<br />
10
The Big Nine <strong>Latin</strong> <strong>America</strong>n groups - profitability<br />
28,0%<br />
24,0%<br />
20,0%<br />
16,0%<br />
12,0%<br />
-4,0%<br />
-8,0%<br />
-12,0%<br />
Profitability is a different story:<br />
• COPA is one of the most profitable airlines in<br />
the world (2 nd in op. margin in 2006-2008).<br />
• GOL was one of the most profitable until the<br />
buying of Varig in 2007, now is recovering.<br />
• TAM always keeps good operating margin,<br />
but made net losses in 2008.<br />
8,0%<br />
4,0%<br />
0,0%<br />
Operating margin 2004-08, %<br />
2004 2005 2006 2007 2008<br />
900<br />
700<br />
500<br />
300<br />
100<br />
-100<br />
-300<br />
-500<br />
-700<br />
GOL<br />
COPA<br />
LAN<br />
TAM<br />
TACA<br />
AVA<br />
MXA<br />
AMX<br />
11<br />
885<br />
447<br />
Cumulated Profit/Loss 2006+07+08<br />
239<br />
161<br />
LAN CMP AVA TAI MXA TAM GOL AMX VRG<br />
-109 -114<br />
-431<br />
-472<br />
-606<br />
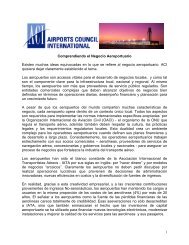
• LAN keeps good profits even in bad years.<br />
In cumulated terms is the best in the region.<br />
• AVA <strong>and</strong> TACA keep in general good<br />
records also.<br />
• Mexicans in general struggling to make<br />
profits; Mexicana slightly better than AMX.<br />
• Varig <strong>and</strong> Aerolineas, better no comment!
In the way towards consolidation<br />
• Although there are a few airlines born from time to<br />
time, the trend is <strong>for</strong> the big airlines getting bigger,<br />
as anywhere else in the world.<br />
• The four groups mentioned in the map carried 65<br />
million pax <strong>and</strong> generated 13 b$ in 2008 (40% <strong>and</strong><br />
47% of total <strong>Latin</strong> airlines).<br />
• Adding Aerolíneas, TAM <strong>and</strong> Mexicans, the Big-9<br />
generate 84% of the total revenue <strong>for</strong> the region.<br />
30<br />
25<br />
20<br />
15<br />
10<br />
5<br />
0<br />
15,9 15,1 14,4 14,4<br />
72%<br />
Revenues LatAm a/l, $b<br />
Top-9 Groups<br />
69%<br />
16,8<br />
20,8 21,4<br />
80%<br />
24,4<br />
81%<br />
27,9<br />
84%<br />
2000 2001 2002 2003 2004 2005 2006 2007 2008<br />
LAN Group in Chile, Ecuador, Perú,<br />
Argentina, plus Colombia <strong>and</strong> Brazil<br />
(freighters)<br />
GOL merged with new Varig<br />
Synergy in Colombia, Brazil & Ecuador;<br />
now with TACA Group, linked to Volaris<br />
in Mexico<br />
COPA with Aerorepública in Colombia<br />
Still independent: MXA, AMX, TAM, ARG<br />
12
Recent growth at some <strong>Latin</strong> markets – effect of economy<br />
• Although there are other important factors that<br />
affect air <strong>traffic</strong> growth in developing markets, in<br />
general it is closely linked both to economic<br />
growth <strong>and</strong> to evolution of yields (fares).<br />
10<br />
8<br />
GDP annual growth <strong>for</strong> main countries, % YoY<br />
Argentina Brasil Chile<br />
Colombia Perú Mexico<br />
6<br />
4<br />
Average air market growth 2006-2008<br />
2<br />
16%<br />
14%<br />
12%<br />
10%<br />
8%<br />
6%<br />
4%<br />
2%<br />
0%<br />
Domestic International<br />
14,5%<br />
13,9%<br />
12,9% 12,7%<br />
11,6%<br />
10,6%<br />
10,5%<br />
8,2%<br />
8,8%<br />
7,1%<br />
4,4%<br />
3,0%<br />
Argentina Brasil Chile Colombia Perú México<br />
0<br />
2003 2004 2005 2006 2007 2008<br />
• Economic growth in <strong>Latin</strong> <strong>America</strong> during<br />
last years has been very high, especially in<br />
Argentina, Perú, Colombia…. This effect,<br />
together with the surge of low-cost<br />
operations in some countries (a few years<br />
ago in Brazil, more recently in Mexico <strong>and</strong><br />
Chile, now in Colombia) is behind the big<br />
recent growth.<br />
Sources: DGACs, ICAO, World Bank, ALG elaboration<br />
13
Recent growth at some <strong>Latin</strong> markets – effect of reduced fares<br />
• No matter whether they are called Low-Cost, No-<br />
Frills or High-Efficiency airlines, when a new entrant<br />
airline in a certain market offers significantly<br />
reduced fares, the stimulating effect is immediate.<br />
• It was the case in 2001 with GOL in Brazil <strong>and</strong> in<br />
2006-07 in Mexico with Volaris, Interjet <strong>and</strong> others.<br />
The charts show the clear correlation between<br />
lower fares <strong>and</strong> market growth.<br />
• At the same time, traditional airlines (TAM, LAN,<br />
TACA, AMX, MXA) have made big ef<strong>for</strong>ts <strong>for</strong><br />
reducing their costs <strong>and</strong> fares, which at the end<br />
has a similar effect in the stimulation of the market.<br />
18<br />
16<br />
14<br />
12<br />
10<br />
8<br />
Domestic yield evolution, UScents/RPK<br />
GOL effect<br />
Brasil<br />
Mexico<br />
Interjet/Volaris/<br />
Avolar/Viva…<br />
effect<br />
1998 1999 2000 2001 2002 2003 2004 2005 2006 2007<br />
Domestic Pax, m<br />
50<br />
40<br />
Brasil<br />
Mexico<br />
30<br />
20<br />
10<br />
Sources: ANAC, SCT, ALG elaboration<br />
0<br />
1998 1999 2000 2001 2002 2003 2004 2005 2006 2007<br />
14
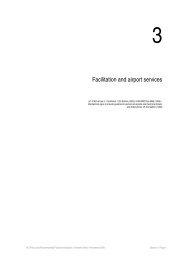
Current crisis - how is hitting <strong>Latin</strong> <strong>America</strong>n aviation (1/3)<br />
• Current crisis is certainly the worst in the recent history of commercial aviation, much worse than the<br />
post-9.11 one. The descent in number of passengers or RPKs comes together with a sharp decline in<br />
fares, especially in Premium classes. Freight operations are being hit even harder than passenger's.<br />
• However, <strong>Latin</strong> <strong>America</strong> as a region is suffering less than others. With the exception of Mexico, whose<br />
economy is narrowly linked to the USA, <strong>Latin</strong> markets <strong>and</strong> airlines keep either growing or with small<br />
descents in <strong>traffic</strong> in 2009. Since August/September, market is growing again at regional level (next<br />
page).<br />
Fares <strong>and</strong> RPKs flown on international markets<br />
Jan-Sep 2009<br />
vs 2008<br />
RPK<br />
growth<br />
LF, %<br />
FTK<br />
growth<br />
% change over year<br />
RPKs<br />
Economy fares<br />
Premium fares<br />
Africa<br />
Asia/Pacific<br />
Europe<br />
<strong>Latin</strong> <strong>America</strong><br />
Middle East<br />
North <strong>America</strong><br />
-8,9%<br />
-8,8%<br />
-5,9%<br />
-2,3%<br />
9,4%<br />
-6,7%<br />
69,6<br />
72,9<br />
76,3<br />
72,0<br />
72,9<br />
79,2<br />
-19,1%<br />
-17,0%<br />
-19,3%<br />
-12,7%<br />
-2,6%<br />
-17,9%<br />
World<br />
-5,3%<br />
75,0<br />
-16,4%<br />
Source: IATA<br />
Sources: Civil Aviation Authorities, ALG<br />
15
Current crisis - how is hitting <strong>Latin</strong> <strong>America</strong>n aviation (2/3)<br />
• Traffic recovery seems on course <strong>for</strong> most <strong>Latin</strong> countries<br />
except Mexico, especially in domestic markets.<br />
• September showed overall growth again <strong>for</strong> the whole<br />
region, after eight months of descent only interrupted in<br />
April.<br />
12%<br />
8%<br />
4%<br />
0%<br />
-4%<br />
-8%<br />
-12%<br />
-16%<br />
8,3%<br />
Brasil<br />
(Aug)<br />
-6,4%<br />
Average market growth in 2009<br />
4,3%<br />
Chile<br />
(Sep)<br />
-9,9%<br />
6,0%<br />
3,1%<br />
Colombia<br />
(Aug)<br />
Domestic<br />
2,0%<br />
Ecuador<br />
(Jun)<br />
-5,0%<br />
4,5%<br />
7,1%<br />
Perú (Aug)<br />
International<br />
Mexico<br />
(Sep)<br />
-12,3%<br />
-14,1%<br />
16<br />
% growth RPKs<br />
20<br />
15<br />
10<br />
5<br />
0<br />
-5<br />
-10<br />
5<br />
% growth FTKs<br />
0<br />
-5<br />
-10<br />
-15<br />
-4,9-4,2<br />
Africa<br />
-5,1<br />
Africa<br />
-6,9<br />
-1,6<br />
Passenger growth by region<br />
Aug-09<br />
sep-09<br />
2,1<br />
Asia<br />
Pacific<br />
Asia -3,1<br />
Pacific<br />
-9,0<br />
3,4<br />
-4,2<br />
-2,8 -2,3<br />
Europe <strong>Latin</strong><br />
<strong>America</strong><br />
10,8<br />
18,2<br />
Middle<br />
East<br />
Freight growth by region<br />
Europe<br />
-14,5<br />
-13<br />
3,9<br />
1,8<br />
3,0<br />
3,6<br />
<strong>Latin</strong> Middle<br />
<strong>America</strong> East<br />
-2,5-2,4<br />
North<br />
<strong>America</strong><br />
-1,1<br />
0,3<br />
World<br />
Aug-09<br />
sep-09<br />
North World<br />
<strong>America</strong> -5 -5,4<br />
-9,6<br />
-12,1<br />
Sources:<br />
IATA, ALTA
Current crisis - how is hitting <strong>Latin</strong> <strong>America</strong>n aviation (3/3)<br />
• From the economic side, <strong>Latin</strong> airlines are clearly<br />
again on the recovery path. The (few) airlines<br />
reporting periodic results show clear improvements<br />
in 2009, actually are the best-per<strong>for</strong>ming airlines in<br />
the world at regional level:<br />
• IATA predicts that in 2009 <strong>Latin</strong> <strong>America</strong> will be the<br />
only region where local airlines will not suffer<br />
Operating nor Net losses overall.<br />
Profit/Loss<br />
(US$ million)<br />
North <strong>America</strong><br />
Europe<br />
Asia-Pacific<br />
<strong>Latin</strong> <strong>America</strong><br />
Middle East<br />
Q2 2008<br />
Op.<br />
513<br />
1.327<br />
536<br />
-73<br />
0<br />
Net<br />
-419<br />
439<br />
-958<br />
5<br />
7<br />
Q2 2009<br />
Op. Net<br />
1.018 -134<br />
-788 -1101<br />
-723 -1290<br />
31 485<br />
-6 20<br />
Sources: airline reports<br />
Profit/Loss<br />
(US$ billion)<br />
2007<br />
Op. Net<br />
2008<br />
2009F<br />
Op. Net<br />
North <strong>America</strong><br />
9,3<br />
5,3<br />
-2,3<br />
-9,5<br />
-0,6<br />
-2,6<br />
Europe<br />
6,4<br />
5,4<br />
3,3<br />
0,2<br />
-0,8<br />
-3,8<br />
Asia-Pacific<br />
3,5<br />
2,1<br />
-5,5<br />
-5,5<br />
-1,9<br />
-3,6<br />
<strong>Latin</strong> <strong>America</strong><br />
0,4<br />
0,1<br />
0,5<br />
-0,7<br />
0,0<br />
0,0<br />
Middle East<br />
0,0<br />
-0,1<br />
0,0<br />
-1,0<br />
-0,4<br />
-0,5<br />
World<br />
19,7<br />
12,9<br />
-3,8<br />
-16,8<br />
-3,9<br />
-11,0<br />
Source: IATA<br />
17
Short-term <strong><strong>for</strong>ecast</strong>:<br />
First of all, aviation is a very resilient industry!<br />
-14%<br />
World annual <strong>traffic</strong><br />
(RPKs - trillions)<br />
4.5<br />
Oil Crisis<br />
Oil Crisis<br />
Gulf Crisis<br />
Asian<br />
Crisis<br />
WTC<br />
AttackSARS<br />
-17%<br />
IATA <strong><strong>for</strong>ecast</strong><br />
(March 2009)<br />
4.0<br />
3.5<br />
3.0<br />
2.5<br />
2.0<br />
1.5<br />
1.0<br />
0.5<br />
• World aviation always recovers<br />
from the periodical crisis. In the<br />
case of the last big one (post-<br />
Sept´11), world air <strong>traffic</strong> took<br />
some three years to recover the<br />
<strong>for</strong>mer growth path.<br />
• For the current crisis IATA<br />
predicts a maximum 17%<br />
descent in <strong>traffic</strong> in 2010 versus<br />
the previous trend, with very<br />
long recovery afterwards (but<br />
IATA <strong><strong>for</strong>ecast</strong>s use to be<br />
overpessimistic!)<br />
0.0<br />
1972 1977 1982 1987 1992 1997 2002 2007<br />
2012 2015<br />
Sources: ICAO, IATA,<br />
<strong>Air</strong>bus, ALG<br />
18
Short-term <strong><strong>for</strong>ecast</strong>s <strong>for</strong> <strong>Latin</strong> <strong>America</strong><br />
• The IATA <strong><strong>for</strong>ecast</strong> predicts <strong>for</strong> 2009 a small increase<br />
in pax <strong>and</strong> an important descent in freight, but P/L<br />
accounts will keep in break-even <strong>for</strong> LatAm airlines.<br />
• For 2010, a modest recovery of 3,7% in FTKs (same<br />
as world average), but modest net profits <strong>for</strong> LatAm<br />
airlines, vs still big losses at world level.<br />
b.RPKs<br />
500<br />
400<br />
300<br />
200<br />
100<br />
0<br />
Short-term <strong>traffic</strong> <strong><strong>for</strong>ecast</strong> <strong>for</strong> LatAm<br />
479,5<br />
-1,6%<br />
471,7<br />
5,0%<br />
6,0% 5,7%<br />
-2,4% 5,1%<br />
-3,2% 2,7%<br />
-0,7% 5,3%<br />
495,4<br />
2008 2009F 2010F<br />
Other<br />
Central <strong>America</strong> - US<br />
Intra South <strong>America</strong><br />
Domestic South <strong>America</strong><br />
Caribbean - US<br />
Domestic Mexico<br />
Central Am. - W.Europe<br />
Mexico - US<br />
Domestic Brazil<br />
South <strong>America</strong> - US<br />
Caribbean - W.Europe<br />
South Am. - W.Europe<br />
19<br />
2009F<br />
LatAm World<br />
Passengers (%) 0,8%* -4,0%<br />
Cargo, FTKs (%) -12,1%* -14,0%<br />
Traffic growth (FTKs) -4,4% -6,9%<br />
Revenue ($b)<br />
-15,0%<br />
Op. profits ($ b) 0,0 -3,9<br />
Net profit ($ b) 0,0 -11,0<br />
2010F<br />
LatAm World<br />
3,2%<br />
3,7%<br />
0,3<br />
0,1<br />
5,0%<br />
3,7%<br />
4,6%<br />
6,5<br />
-3,8<br />
(*) ALTA data<br />
• Combining several <strong><strong>for</strong>ecast</strong> sources<br />
with economic growth figures <strong>and</strong><br />
analysis of the different sources of<br />
<strong>traffic</strong> <strong>for</strong> every market, we obtain<br />
the growth rates shown in the chart.
Forecast – medium term<br />
6%<br />
4%<br />
Mid-term <strong>traffic</strong> <strong><strong>for</strong>ecast</strong>s <strong>for</strong> LatAm<br />
6,4%<br />
6,0%<br />
IATA<br />
4,5% 4,9% 5,0% 5,0% 4,9% 5,0%<br />
<strong>Air</strong>bus<br />
Boeing<br />
ALG<br />
• The most respected medium- <strong>and</strong> long-term<br />
<strong><strong>for</strong>ecast</strong>s concerning commercial aviation are the<br />
ones provided by <strong>Air</strong>bus <strong>and</strong> Boeing.<br />
2%<br />
ALG mid-term <strong>traffic</strong> <strong><strong>for</strong>ecast</strong> <strong>for</strong> LatAm<br />
0%<br />
-2%<br />
2009-08 2010-09 2018-08 2028-08<br />
-1,8% -1,9%<br />
-1,6%<br />
6%<br />
5,03%6,23% 5,99%6,02%5,85%5,68%<br />
5,60%5,50%5,46%<br />
4,95%<br />
4%<br />
• Based on similar methodology but using<br />
our deeper knowledge of the <strong>Latin</strong> market,<br />
at ALG we predict the following growth<br />
rates <strong>for</strong> the next ten years.<br />
2%<br />
0%<br />
-2%<br />
2009 2010 2011 2012 2013 2014 2015 2016 2017 2018 10Y<br />
avg<br />
-1,63%<br />
20
Addendum:<br />
An interesting potential between <strong>Latin</strong> <strong>America</strong> <strong>and</strong> Asia/Pacific<br />
• Because of the big distances, current direct air offer<br />
between LatAm <strong>and</strong> Asia/Pacific is scarce (27 frequencies<br />
/week in 2007, 34 today). Of course the connecting flights<br />
via the US or Europe are numerous.<br />
• However, Asia-Pacific is the world´s aviation engine <strong>for</strong><br />
several years, <strong>and</strong> LatAm a growing region scarcely<br />
affected by the current crisis.<br />
Estimated <strong>traffic</strong> volume in 2012 by subregion<br />
Australia/NZ/Pac.-S.Am<br />
Asia-Central <strong>America</strong><br />
China-Central <strong>America</strong><br />
Asia-South <strong>America</strong><br />
Japan-Central <strong>America</strong><br />
Other region-pairs<br />
2012F<br />
RPKs Frecs/w<br />
3.500 11<br />
4.100 10<br />
2.500 8<br />
2.500 6<br />
1.800 6<br />
11.600 9<br />
• the current development of both<br />
regions, the economic potential,<br />
the ethnic market <strong>and</strong> the huge<br />
tourism potential will fuel a high<br />
<strong>traffic</strong> growth rate between both<br />
regions.<br />
• We <strong><strong>for</strong>ecast</strong> the market to double<br />
by 2012 compared to 2007, with<br />
some 50 weekly frequencies using<br />
equivalent 250-seater aircraft.<br />
21
In summary…<br />
• <strong>Latin</strong> <strong>America</strong>n aviation in general has enjoyed a very good health in the<br />
last years, growing faster than the world average.<br />
• As a pending matter, it has to gain share in long range markets.<br />
• Growing consolidation among airlines. Very good results in general <strong>for</strong> the<br />
big-nine Groups of airlines.<br />
• At short term, 2009 will finish with a small back step in <strong>traffic</strong>, but with big<br />
variations among countries <strong>and</strong> markets. 2010 will see a recovery, likely to<br />
improve further in 2011.<br />
• At mid-term <strong>traffic</strong> will grow at 5-6% average per annum. By countries,<br />
Brasil, Perú, Chile, Colombia show brighter perspectives than Mexico,<br />
Argentina or Ecuador.<br />
22
That´s all. ¡¡¡Muito Obrigado!!!<br />
AVIATION<br />
CONSULTING<br />
SERVICES<br />
DELIVERING RESULTS<br />
TO<br />
AIRPORT AND AIRLINES<br />
EUROPA<br />
LATINOAMÉRICA<br />
ASIA<br />
MADRID<br />
María de Molina, 54, 5ª plta.<br />
28006 Madrid (España)<br />
Tel: (+34) 91 400 80 88<br />
Fax: ( +34) 91 409 44 87<br />
BARCELONA<br />
Comte d'Urgell, 240, 3º<br />
08036 Barcelona (España)<br />
Tel: (+34) 93 430 40 16<br />
Fax: (+34) 93 419 55 24<br />
BILBAO<br />
Ribera de Axpe, 11<br />
Edificio D1-D2<br />
41950 Er<strong>and</strong>io (Vizcaya)<br />
Tel: (+34) 94 402 43 00<br />
Fax: (+34) 94 402 43 54<br />
LISBOA<br />
Av. Duque D'Ávila, nº46<br />
1053-083 Lisboa (Portugal)<br />
Tel: (+35) 121 313 90 60<br />
Fax: (+35) 121 313 90 61<br />
LONDON<br />
Crossweys House<br />
28-30 High Street .Guild<strong>for</strong>d<br />
Surrey GU1 3EL. London<br />
Tel: +44 (0) 148 324 3343<br />
Fax + 44 (0) 148 324 3301<br />
MILANO<br />
Via Fatebenefratelli, 26<br />
20121 Milán (Italia)<br />
Tel: (+39) 02 30 57 55 1<br />
Fax: (+39) 02 30 57 50 02<br />
LIMA<br />
Calle Alcan<strong>for</strong>es 495<br />
Oficina 514<br />
Edificio Thunderbird<br />
Miraflores – Lima 18(Perú)<br />
Tel: (511) 242-7365<br />
CARACAS<br />
Av. Francisco de Mir<strong>and</strong>a, El<br />
Rosal. Edificio EASO Piso 7<br />
Oficina PH<br />
1050 Caracas (Venezuela)<br />
Tel: (+58) 23212 951 45 83<br />
MÉXICO D.F.<br />
Av. G. González Camarena, 1600<br />
01210 Santa Fe (México D.F.)<br />
Tel: (+52) 55 5243 6144<br />
SAO PAULO<br />
Rua James Joule, 92 - 6º <strong>and</strong>ar<br />
04576-080 Brooklin Novo<br />
São Paulo (Brasil)<br />
Tel: (+55) 11 21 27 04 00<br />
Fax: (+55) 11 21 27 04 05<br />
DUBAI<br />
Grosvenor House Commercial Tower<br />
Office M.07, Sheikh Zayed Road<br />
P.O. Box 3089, Dubai, UAE<br />
Tel: +971 (0) 4 329 63 88<br />
Fax. +971 (0) 4 329 64 11
Forecast – medium term<br />
• The different<br />
24
<strong>Latin</strong>oamérica es tierra de oportunidad en el negocio del transporte<br />
aéreo para los próximos años (1/2)<br />
• A pesar de la crisis actual, en su condición de economía<br />
emergente <strong>Latin</strong>oamérica mantiene la capacidad de<br />
crecer su consumo y su PIB a un ritmo cercano al 6%<br />
durante los próximos años.<br />
• En su pronóstico hasta el año 2016 <strong>Air</strong>bus afirma que el<br />
mercado intra-<strong>Latin</strong>oamericano crecerá a ritmo promedio<br />
del 6,2% anual. Por su parte Boeing en su pronóstico hasta<br />
el 2027 afirma que el mismo mercado crecerá un 6,7%.<br />
• Ambas compañías consideran que la creciente liberalización<br />
del mercado en LatAm es un factor contribuyente<br />
a dicho crecimiento.<br />
Fuente: <strong>Air</strong>bus´ Global Market Forecast<br />
25
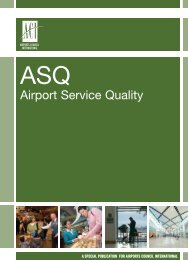
<strong>Latin</strong>oamérica es tierra de oportunidad en el negocio del transporte<br />
aéreo para los próximos años (2/2)<br />
• Si bien el mercado intra latinoamericano tendrá un gran<br />
crecimiento, el mercado entre <strong>Latin</strong>oamérica y Europa<br />
Occidental seguirá <strong>for</strong>m<strong>and</strong>o parte de los diez más<br />
importantes flujos mundiales y aumentará su relevancia.<br />
En 1995 ocupaba el puesto 10; para el 2026 se espera<br />
que ocupe el puesto 6.<br />
• Para Boeing, es el mercado intra-<strong>Latin</strong>oamericano el<br />
que experimentará el mayor crecimiento entre los de la<br />
región, con un 6.7% anual en promedio hasta el 2027<br />
(6.9% en particular para el intra-Suramérica):<br />
Crecimiento anual<br />
medio 2007-2027<br />
por regiones, RPKs<br />
(Boeing CMO)<br />
Puesto 6 en 2026<br />
3º en el mundo<br />
Fuente: <strong>Air</strong>bus´ Global Market Forecast<br />
26