Air traffic update and forecast for Latin America - ACI
Air traffic update and forecast for Latin America - ACI
Air traffic update and forecast for Latin America - ACI

You also want an ePaper? Increase the reach of your titles
YUMPU automatically turns print PDFs into web optimized ePapers that Google loves.
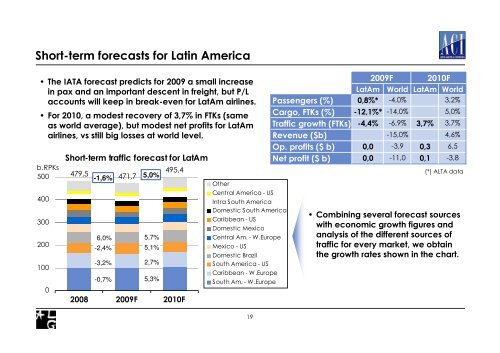
Short-term <strong><strong>for</strong>ecast</strong>s <strong>for</strong> <strong>Latin</strong> <strong>America</strong><br />
• The IATA <strong><strong>for</strong>ecast</strong> predicts <strong>for</strong> 2009 a small increase<br />
in pax <strong>and</strong> an important descent in freight, but P/L<br />
accounts will keep in break-even <strong>for</strong> LatAm airlines.<br />
• For 2010, a modest recovery of 3,7% in FTKs (same<br />
as world average), but modest net profits <strong>for</strong> LatAm<br />
airlines, vs still big losses at world level.<br />
b.RPKs<br />
500<br />
400<br />
300<br />
200<br />
100<br />
0<br />
Short-term <strong>traffic</strong> <strong><strong>for</strong>ecast</strong> <strong>for</strong> LatAm<br />
479,5<br />
-1,6%<br />
471,7<br />
5,0%<br />
6,0% 5,7%<br />
-2,4% 5,1%<br />
-3,2% 2,7%<br />
-0,7% 5,3%<br />
495,4<br />
2008 2009F 2010F<br />
Other<br />
Central <strong>America</strong> - US<br />
Intra South <strong>America</strong><br />
Domestic South <strong>America</strong><br />
Caribbean - US<br />
Domestic Mexico<br />
Central Am. - W.Europe<br />
Mexico - US<br />
Domestic Brazil<br />
South <strong>America</strong> - US<br />
Caribbean - W.Europe<br />
South Am. - W.Europe<br />
19<br />
2009F<br />
LatAm World<br />
Passengers (%) 0,8%* -4,0%<br />
Cargo, FTKs (%) -12,1%* -14,0%<br />
Traffic growth (FTKs) -4,4% -6,9%<br />
Revenue ($b)<br />
-15,0%<br />
Op. profits ($ b) 0,0 -3,9<br />
Net profit ($ b) 0,0 -11,0<br />
2010F<br />
LatAm World<br />
3,2%<br />
3,7%<br />
0,3<br />
0,1<br />
5,0%<br />
3,7%<br />
4,6%<br />
6,5<br />
-3,8<br />
(*) ALTA data<br />
• Combining several <strong><strong>for</strong>ecast</strong> sources<br />
with economic growth figures <strong>and</strong><br />
analysis of the different sources of<br />
<strong>traffic</strong> <strong>for</strong> every market, we obtain<br />
the growth rates shown in the chart.