I MEMORANDUM - School Information System
I MEMORANDUM - School Information System
I MEMORANDUM - School Information System

You also want an ePaper? Increase the reach of your titles
YUMPU automatically turns print PDFs into web optimized ePapers that Google loves.
-<br />
-<br />
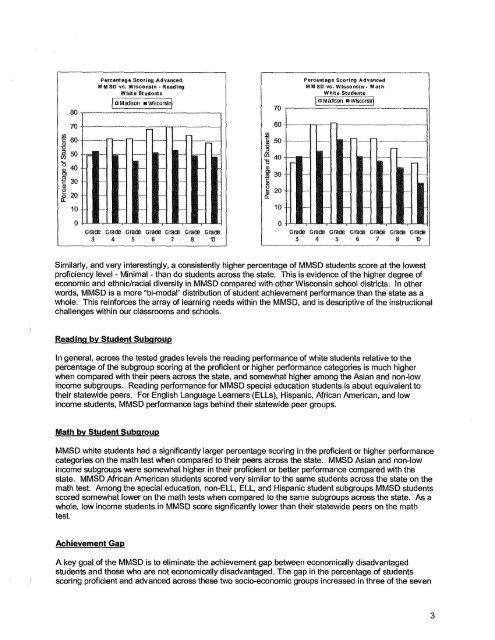
Percentage SCOring Advanced<br />
M M SO vs. Wisconsin - Reading<br />
White Students<br />
! 0 Ma::ilson a WISCOT'5ln!<br />
80 '-'<br />
70<br />
Percentage Scoring Advanced<br />
M M SO vs. Wisconsin - Math<br />
White Students<br />
10 Ma:llson II Wiscorsl~<br />
- ---<br />
70 --. .- 60 -- -------------<br />
.Ill<br />
11 60 -~-. ~ ..<br />
- I-- -- I--- Ii 50 -- I-- I~ --- -------<br />
"0<br />
"0<br />
"<br />
.~<br />
Vl 50 f--- e- I~ --<br />
Vl 40 1- - I- e- 1- --<br />
'0<br />
'0<br />
" 40 - '- - '- 1·- --- -<br />
"<br />
~<br />
'"<br />
30 ,- - ,-<br />
~ ~<br />
J§' 30 - - 1- '--<br />
1-- - -<br />
c<br />
"<br />
" <br />
20 -<br />
_.<br />
I~ I~ --- - -<br />
e- 1- - &<br />
:t. 20 - - -<br />
~<br />
10 '-- -<br />
1- I~ - ,- 10 - I~ -~ -<br />
0 c.,.<br />
~<br />
c.,. c.,. c.,.<br />
~ 0<br />
Grade Grade Grade Grade Grade Grade Grade<br />
Graoo Graoo Graoo G raoo G raoo G raoo G rare<br />
3 4 5 6 7 8 1) 3 4 5 6 7 8 1)<br />
Similarly, and very interestingly, a consistently higher percentage of MMSD students score at the lowest<br />
proficiency level - Minimal - than do students across the state. This is evidence of the higher degree of<br />
economic and ethnic/racial diversity in MMSD compared with other Wisconsin school districts. In other<br />
words, MMSD is a more "bi-modal" distribution of student achievement performance than the state as a<br />
whole. This reinforces the array of learning needs within the MMSD, and is descriptive of the instructional<br />
challenges within our classrooms and schools.<br />
Reading by Student Subgroup<br />
In general, across the tested grades levels the reading performance of white students relative to the<br />
percentage of the subgroup scoring at the proficient or higher performance categories is much higher<br />
when compared with their peers across the state, and somewhat higher among the Asian and non-low<br />
income subgroups. Reading performance for MMSD special education students is about equivalent to<br />
their statewide peers. For English Language Learners (ELLs), Hispanic, African American, and low<br />
income students, MMSD performance lags behind their statewide peer groups_<br />
Math by Student Subgroup<br />
MMSD white students had a significantly larger percentage scoring in the proficient or higher performance<br />
categories on the math test when compared to their peers across the state. MMSD Asian and non-low<br />
income subgroups were somewhat higher in their proficient or better performance compared with the<br />
state. MMSD African American students scored very similar to the same students across the state on the<br />
math test Among the special education, non-ELL, ELL, and Hispanic student subgroups MMSD students<br />
scored somewhat lower on the math tests when compared to the same subgroups across the state. As a<br />
whole, low income students in MMSD score significanUy lower than their statewide peers on the math<br />
test<br />
Achievement Gap<br />
A key goal of the MMSD is to eliminate the achievement gap between economically disadvantaged<br />
students and those who are not economically disadvantaged. The gap in the percentage of students<br />
scoring proficient and advanced across these two socio-economic groups increased in three of the seven<br />
3


![by Shaina Wright [PDF] Ralph Waldo Emerson Prize 2006 - School ...](https://img.yumpu.com/26083584/1/174x260/by-shaina-wright-pdf-ralph-waldo-emerson-prize-2006-school-.jpg?quality=85)