I MEMORANDUM - School Information System
I MEMORANDUM - School Information System
I MEMORANDUM - School Information System

You also want an ePaper? Increase the reach of your titles
YUMPU automatically turns print PDFs into web optimized ePapers that Google loves.
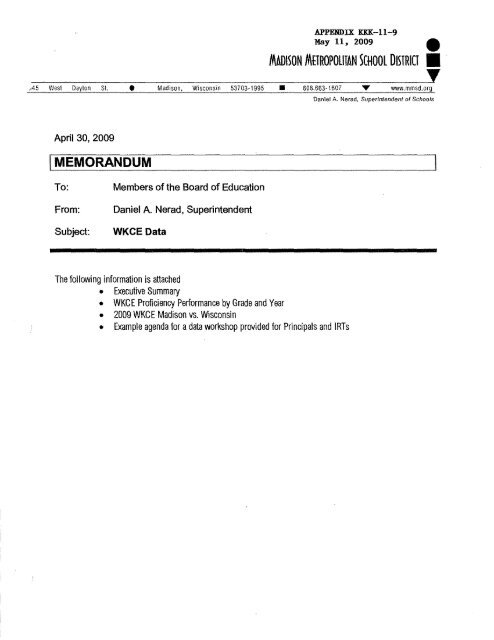
APPENDIX KKK-1l-9<br />
May ll. 2009<br />
MADISON MHROPOllTAN SCHOOL DISTRICT<br />
•<br />
Y<br />
045 West Dayton St.<br />
•<br />
Madison. Wisconsin 53703-1995 • 608.663-1607 www.mmsd,org<br />
•<br />
Danie! A. Nerad, Superintendent of <strong>School</strong>s<br />
April 30, 2009<br />
I <strong>MEMORANDUM</strong><br />
To:<br />
From:<br />
Subject:<br />
Members of the Board of Education<br />
Daniel A. Nerad, Superintendent<br />
WKCE Data<br />
The following information is attached<br />
• Executive Summary<br />
• WKCE Proficiency Performance by Grade and Year<br />
• 2009 WKCE Madison vs. Wisconsin<br />
• Example agenda for a data workshop provided for Principals and IRTs
Executive Summary<br />
Wisconsin Knowledge and Concepts (WKCE) Test<br />
Introduction<br />
The 2008-09 school year marked the fourth consecutive year in which testing in grades 3 through 8 and<br />
10 was conducted in fulfillment of the federal No Child left Behind law. The Wisconsin Knowledge and<br />
Concepts Exams (WKCE) is a criterion-referenced test (CRT) where a student's performance is<br />
compared to a specific set of learning standard outcomes. The WKCE-CRT includes testing in all seven<br />
grade levels reading and math and in grades 4, 8 and 10 additional testing in language arts, science and<br />
social studies. Just under 12,400 MMSD students participated in this year's WKCE-CRT.<br />
Under NClB, schools are required to test 95% of their full academic year (FAY) students in reading and<br />
math. Madison's test participation rates exceeded 95% in all grade levels. Grades 3 through 8 achieved<br />
99% test participation or higher while the District's 10th graders reached 98% in test participation.<br />
In general, performance was relatively unchanged in the two academic areas tested across the seven<br />
grade levels. In reading, across the seven grades tested four grade levels had an increase in the<br />
percentage of students scoring at the proficient or higher performance categories compared with the<br />
previous year while three grades showed a decline in the percentage. In math, three grades increased<br />
proficient or higher performance, three grades declined, and one remained the same.<br />
WKCE Reading and Math Performance b y Grade Level<br />
Percentage of Scoring Proficient or Higher - All Students Tested<br />
Subject<br />
Reading<br />
Year<br />
2006-07<br />
Math 2008-09<br />
KEY -> PM No Change<br />
I Improve<br />
The changing demographics of the district affect the overall aggregate achievement data. As the district<br />
has experienced a greater proportion of students from subgroups which are at a disadvantage in testing,<br />
e.g., non-native English speakers, or English language learners (Ells), the overall district averages have<br />
correspondingly declined. Other subgroups which traditionally perform well on student achievement<br />
tests, i.e., non-low income students and white students, continue to perform very high relative to<br />
statewide peer groups. Therefore, it is important disaggregate the data to interpret and understand the<br />
district results.<br />
Unlike the previous years when MMSD students had a higher percentage of students perform at the<br />
highest proficiency level - Advanced - when compared with their statewide peers, in 2008-09 this<br />
occurred in just over half of the grade levels tested in reading and math. In general, students scoring at<br />
1
the highest performance level are students who are not low income, who are Asian, or who are white. As<br />
these student subgroups become a smaller proportion of the total MMSD student population it is<br />
predictable that the overall percentage of students scoring in the Advanced category would decline.<br />
What is also clear from the data is that despite the change in the proportion of these subgroups within the<br />
total MMSD student population there has been no decrease in the percentage scoring at the Advanced<br />
level. This percentage point difference ranges from 8 to 15 points across all grade levels in reading when<br />
comparing non-low income students in the MMSD with their statewide peers, and between 7 and 13<br />
points in math. For Asian students this differential between MMSD students and their statewide peers is<br />
between 2 and 19 percentage points in reading, and between 2 and 20 percent in math across all grades<br />
tested. For the white subgroup MMSD averages over 14 percentage points more students scoring<br />
Advanced in reading performance compared to their statewide peers, and over 12 percentage points<br />
more students scoring Advanced in math across all tested grades.<br />
Percentage Scoring Advanced<br />
M M SO vs. Wisconsin w Reading<br />
Non Economically Disadvantaged Students<br />
I I<br />
DMadlson _Wlscol'6!n<br />
00 --<br />
70<br />
i<br />
OO c--- I--<br />
~<br />
~50 l- e- 0- f- - f-<br />
~40 l- e- f- r- - r-<br />
f~ l- f- f- - -<br />
8:20 - l- f- - -<br />
1) - l- I- - - -<br />
0 L,.. ~<br />
Gradl Gradl Gradl Gradl Gradl Gradl Gradl<br />
3 4 5 6 7 8 1)<br />
70<br />
0<br />
Percentage Seo ring Advanced<br />
M M SO vs. Wisconsin M Math<br />
Non Economically Disadvantaged Students<br />
! o MadIson IlIWISCOI'6!n!<br />
50<br />
2<br />
ID 50<br />
".il<br />
~ 40<br />
0<br />
Ql<br />
~ 30<br />
co<br />
Ql<br />
~ 20<br />
Ql<br />
---_.<br />
- - --<br />
Q.<br />
10 - -- I- - - c--<br />
- 1- - c--<br />
- 1- - ,-<br />
- 1- -- -""- -<br />
Gradl Grace GracE Gradl Gradl Gradl<br />
3 4 5 6 7 8<br />
-<br />
Gradl<br />
1)<br />
Percentage Scoring Advanced<br />
M M SD vs. Wisconsin M Reading<br />
Asian Students<br />
IOMad,on .WIS"'''I~<br />
60 ----------------<br />
50 - ------<br />
2<br />
co<br />
Ql<br />
" 40 -- -- -- -<br />
~<br />
'0 30 1- --- r-<br />
._- - 1- --<br />
Ql<br />
0><br />
J!l<br />
ID 20 - - r- I- - I-<br />
Q; "<br />
Q.<br />
10 - - I- I- l- I-<br />
0 ~ ~ L,.. L,.. L,.. L,..<br />
Gradl Gradl Gradl Gradl Gradl Gradl Gradl<br />
3 4 5 6 7 8 1)<br />
Percentage Scoring Advanced<br />
M M SO vs. Wisconsin - Math<br />
Asian Students<br />
! tl Madison II Wiscorsln I<br />
50.---=========-=------~<br />
10 - 1-<br />
1--<br />
-.<br />
o _c...- _'-
-<br />
-<br />
Percentage SCOring Advanced<br />
M M SO vs. Wisconsin - Reading<br />
White Students<br />
! 0 Ma::ilson a WISCOT'5ln!<br />
80 '-'<br />
70<br />
Percentage Scoring Advanced<br />
M M SO vs. Wisconsin - Math<br />
White Students<br />
10 Ma:llson II Wiscorsl~<br />
- ---<br />
70 --. .- 60 -- -------------<br />
.Ill<br />
11 60 -~-. ~ ..<br />
- I-- -- I--- Ii 50 -- I-- I~ --- -------<br />
"0<br />
"0<br />
"<br />
.~<br />
Vl 50 f--- e- I~ --<br />
Vl 40 1- - I- e- 1- --<br />
'0<br />
'0<br />
" 40 - '- - '- 1·- --- -<br />
"<br />
~<br />
'"<br />
30 ,- - ,-<br />
~ ~<br />
J§' 30 - - 1- '--<br />
1-- - -<br />
c<br />
"<br />
" <br />
20 -<br />
_.<br />
I~ I~ --- - -<br />
e- 1- - &<br />
:t. 20 - - -<br />
~<br />
10 '-- -<br />
1- I~ - ,- 10 - I~ -~ -<br />
0 c.,.<br />
~<br />
c.,. c.,. c.,.<br />
~ 0<br />
Grade Grade Grade Grade Grade Grade Grade<br />
Graoo Graoo Graoo G raoo G raoo G raoo G rare<br />
3 4 5 6 7 8 1) 3 4 5 6 7 8 1)<br />
Similarly, and very interestingly, a consistently higher percentage of MMSD students score at the lowest<br />
proficiency level - Minimal - than do students across the state. This is evidence of the higher degree of<br />
economic and ethnic/racial diversity in MMSD compared with other Wisconsin school districts. In other<br />
words, MMSD is a more "bi-modal" distribution of student achievement performance than the state as a<br />
whole. This reinforces the array of learning needs within the MMSD, and is descriptive of the instructional<br />
challenges within our classrooms and schools.<br />
Reading by Student Subgroup<br />
In general, across the tested grades levels the reading performance of white students relative to the<br />
percentage of the subgroup scoring at the proficient or higher performance categories is much higher<br />
when compared with their peers across the state, and somewhat higher among the Asian and non-low<br />
income subgroups. Reading performance for MMSD special education students is about equivalent to<br />
their statewide peers. For English Language Learners (ELLs), Hispanic, African American, and low<br />
income students, MMSD performance lags behind their statewide peer groups_<br />
Math by Student Subgroup<br />
MMSD white students had a significantly larger percentage scoring in the proficient or higher performance<br />
categories on the math test when compared to their peers across the state. MMSD Asian and non-low<br />
income subgroups were somewhat higher in their proficient or better performance compared with the<br />
state. MMSD African American students scored very similar to the same students across the state on the<br />
math test Among the special education, non-ELL, ELL, and Hispanic student subgroups MMSD students<br />
scored somewhat lower on the math tests when compared to the same subgroups across the state. As a<br />
whole, low income students in MMSD score significanUy lower than their statewide peers on the math<br />
test<br />
Achievement Gap<br />
A key goal of the MMSD is to eliminate the achievement gap between economically disadvantaged<br />
students and those who are not economically disadvantaged. The gap in the percentage of students<br />
scoring proficient and advanced across these two socio-economic groups increased in three of the seven<br />
3
grades tested in mathematics between 2007-08 and 2008-09, it decreased in two other grades, and<br />
remained the same in two grade levels. In reading this gap increased in five of the seven grades tested,<br />
and decreased in the other two grade levels.<br />
In general, the reading gap has remained unchanged over the past four years. Some progress has been<br />
made in reducing the gap in math during that time. Most improvements in closing the gap have been at<br />
grade 10. A particularly concerning increase in gaps occurred this year in Grade 3 reading. Much<br />
remains to be accomplished in terms of achieving this goal.<br />
Achievement Gap Between Low Income and Non-Low Income Students<br />
Difference in Percentage of Subgroups Scoring Proficient or Higher<br />
Subject<br />
Year<br />
Reading 1-;;;;;;:;-';;;;-<br />
Math<br />
1_<br />
2006-07<br />
KEY~> No<br />
Change<br />
Improve<br />
4
Wisconsin Knowledge and Concepts Exam (WKCE) Proficiency Performance<br />
Students in District Full Academic Year (FAY)<br />
Grade 3<br />
CURRENT AND PREVIOUS YEAR PERFORMANCE DETAIL KEY·> ~_I No Change Improve<br />
HISTORICAL TRENDS<br />
2005-06 2006..(17 2007.(18 2008-09<br />
90%<br />
85%<br />
80%<br />
75%<br />
70%<br />
65%<br />
60%<br />
55%<br />
50%<br />
45%<br />
40%<br />
GAP ANALYSIS<br />
Proficient + Advanced Performance<br />
INCOME Reading I Mathematics<br />
GAP ANALYSIS<br />
Proficient + Advanced Performance<br />
ELL Reading I Mathematics<br />
I ELL I Non-ELL I Gap I . Gap _Cha~~e I ELL I I I Gap Change<br />
2009 W,. _ Proficiency Summary Reports· District FAY Final
• Test conducted!n February of 2002. Calculatk1ns are different than subsequent years .<br />
. ,<br />
Wisconsin Knowledge and Concepts Exam (WKCE) Proficiency Performance<br />
Students in District Full Academic Year (FAY)<br />
Grade 4<br />
CURRENT AND PREVIOUS YEAR PERFORMANCE DETAIL<br />
KEY·> 11il9,m1_1 No Change<br />
Improve<br />
HISTORICAL TRENDS E~;:d~i~iiii~~t~~I~iiii<br />
2000-01 2001-02 2002·03 2.003-04 2004-05 2005-06 200&.07 2007·00 2008-09<br />
~<br />
M%<br />
'"<br />
~ '" -+-Readi"ll<br />
-ll--Languago Arts<br />
'5%<br />
Math<br />
eo% -»(--$cionco<br />
-."'-'"-,~~- ,,% """"'-Scx:lal Studion;<br />
" 60%<br />
,,%<br />
. ''''<br />
INCOME<br />
GAPANAL~S~IS~ __-f~~~~~~~~~~~~~~~~~~~~~~~~==~~~~<br />
Gap Change Low Income Gap Change<br />
Gap from Prior Year Students Gap from Prior Year
Wisconsin Knowledge and Concepts Exam (WKCE) Proficiency Performance<br />
Students in District Full Academic Year (FAY)<br />
Grade 5<br />
CURRENT AND PREVIOUS YEAR PERFORMANCE DETAIL KEY~> MAIlL_1 NoCh;;g~-r'mprove<br />
HISTORICAL TRENDS<br />
A-VearchanQel----- ---NA---F ----r;rA --1<br />
3YearChange riWr4_C 1~<br />
200;.00 2006-07<br />
2007..(18 2008-09<br />
90"10<br />
85%<br />
80%<br />
75%<br />
70"10<br />
65%<br />
60% I -&-Math<br />
55%<br />
50%<br />
45%<br />
40%<br />
GAP ANALYSIS<br />
Proficient + Advanced Performance<br />
INCOME Reading I Mathematics<br />
Gap Change<br />
from Prior Year<br />
GAP ANALYSIS<br />
Proficient + Advanced Performance<br />
ELL Reading I Mathematics<br />
... __ .... L ___ _<br />
2009 V'v. _ Proficiency Summary Reports - District FAY Final
~ __<br />
Wisconsin Knowledge and Concepts Exam (WKCE) Proficiency Performance<br />
Students in District Full Academic Year (FAY)<br />
Grade 6<br />
CURRENT AND PREVIOUS YEAR PERFORMANCE DETAIL KEY.> _ •• -NoCh~ng.. CImP~.w.-J<br />
HISTORICAL TRENDS<br />
6 Year Chanae f NA NA<br />
3 Year Chanae 1I11i!li!!li!li!i!li!!iI 1% 2005-06 20()6.07 2007-08 2008-09<br />
90%<br />
85%<br />
80%<br />
75%<br />
70%<br />
65% ! ____ Math<br />
SO%<br />
55%<br />
50%<br />
45%<br />
40%<br />
GAP ANALYSIS<br />
Proficient + Advanced Performance<br />
INCOME Reading I Mathematics<br />
I low Income I Not low Incomel I Gao Chanae I low Income I Not low Incomel G I Gao Channa<br />
ap<br />
GAP ANALYSIS<br />
Proficient + Advanced Performance<br />
ELL Reading .1. Mathematics<br />
1"1.._--- ,..__ ,.... ____<br />
Non.ELL<br />
Gap<br />
2009 Vv, . Proficiency Summary Reports - District FAY Final
Wisconsin Knowledge and Concepts Exam (WKCE) Proficiency Performance<br />
Students in District Full Academic Year (FAY)<br />
Grade 7<br />
CURRENT AND PREVIOUS YEAR PERFORMANCE DETAIL KEY -> fa:.. No Change Improve<br />
HISTORICAL TRENDS<br />
rSYear Chi:mge --, NA- 1 NA<br />
3 Year Change 0% 2%<br />
2005-06 2006-07 2007-08 2008-09<br />
90%<br />
B5%<br />
60%<br />
75%<br />
0% [ ,<br />
65,.<br />
60%<br />
55%<br />
50%<br />
45%<br />
40%<br />
__&_Math<br />
GAP ANALYSIS<br />
Proficient + Advanced Performance<br />
INCOME Reading I Mathematics<br />
low Income I Not Low<br />
Students<br />
Gap<br />
Gap<br />
Gap Change<br />
from Prior Year<br />
"6 Year Change<br />
3 Year Change<br />
NlA<br />
1%<br />
NlA<br />
3%<br />
NlA<br />
8%<br />
GAP ANALYSIS<br />
ELL<br />
~ __ "'L____<br />
Non~ELL<br />
6 Year Change<br />
3 Year Change<br />
NlA<br />
2%<br />
NlA<br />
NlA<br />
NlA<br />
0% 1%<br />
NlA<br />
1%<br />
2009 'Iv, _ Proficiency Summary Reports - District FAY Final
Wisconsin Knowledge and Concepts Exam (WKCE) Proficiency Performance<br />
Students in District Full Academic Year (FAY)<br />
Grade 8<br />
CURRENT AND PREVIOUS YEAR PERFORMANCE DETAIL<br />
Improve<br />
HISTORICAL TRENDS<br />
-------------_______________ W%<br />
-- ----- '"<br />
-------------------------------+ "'.<br />
-M>'<br />
ZOOQ..{)1 ZOOl..(l2 2002..(13 2003-04 20{l4-05 2005..(1(1 ZOOO..(/7 2007..(18 2008-09<br />
'"<br />
---,- '"<br />
............. '-'"'Il""ll6Mn<br />
'"<br />
.$5% ---,-<br />
60% M ••<br />
-ll-Soo\tIISlud ...<br />
• Test conduc;!ed in Februaf)' ofl002. Calculatlons are different than sUbsequent years.
Wisconsin Knowledge and Concepts Exam (WKCE) Proficiency Performance<br />
Students in District Full Academic Year (FAY)<br />
Grade 10<br />
CURRENT AND PREVIOUS YEAR PERFORMANCE DETAIL<br />
HISTORICAL TRENDS<br />
"-<br />
"""<br />
2000-01<br />
"-<br />
/<br />
'X<br />
2001-02<br />
/<br />
2002.(13 201n-04 ,.,.". 2005-06<br />
'" -+-RondI"9<br />
eo.<br />
-a--Ln~/Ir~<br />
~-<br />
M ..<br />
·00%<br />
-l+-Sole
2009 WKCE Madison vs. Wisconsin table_1<br />
Group: All Students<br />
I<br />
AlI MMSD stud~1s tested In grades 3 through 6 and 10 inleilding and math performed between 4and 9 pe!"OO1tage lXlints lower<br />
Jthan students across Wisconsin in the proficl~t or higher perronnance levels.<br />
BIeilkin 9 out the data into the highest performaJ1Ce ~I only - the advanced level- MMSD studems perrormed higher than<br />
Wiso:msln students as a whole in reading ingrades 1 and 8, and in math in grades 4, 1, 6, and 10. MMSD students trailed the<br />
Jstate as a whole in advanced performance In grades 3 and 4 ion reading and in grades 5 aod 6 in math.<br />
00<br />
00<br />
ro<br />
1 ;00<br />
i~<br />
,~<br />
i-<br />
IT(lre students than the state as a whole sewing in the lowest performaJ1Ce category - minima! - across<br />
from 2 to 6 percentage points.<br />
Percentage Scoring Proficient or Higher<br />
MMSD vs. Wisconsin - Reading<br />
) OMadison mwlSCOnsin)<br />
i-;:<br />
I- '- I- - '- l-<br />
i-<br />
i- - I- - I-<br />
- -<br />
~<br />
"<br />
L,-<br />
Grn
G ...<br />
Grade 3 IFteading<br />
SllbjGct<br />
I<br />
~<br />
J<br />
Madison FAY I 1479<br />
. ..<br />
g~<br />
]• " I ~<br />
ill •<br />
i!<br />
~i5<br />
• ~ *<br />
1j<br />
j; "'-"'1;; '-0, j:-.5 t '10-':/;:~;-<br />
":flit".l ' 84'::~"<br />
Grade7 IRaading IMadisonFAY 114551 0 I I 0 I 6 I 11 I 32<br />
" "<br />
" "<br />
'Gra.d(l,7nSIn-:":' rS;581! __ ,II-'l :::1'; ;o,:---l'~-'(I" 1':,,8: 1 Sj :,48,:'--ltf!ir~i}:~k-79:dmt~'<br />
Grad,,6 IMathema~cs 1MadisonFAY 11548 o ! 17 I 11 1 34 I 36 ! I 70<br />
-9i.$' 67]P.a,lIi9iriatiCa'/:]Wi$iEMATICS<br />
Giilda-8> '>00', 45 ':- 4 8S ,~"'~ 1.8 "Awrage Diff"rence In Adwnced Across All Grades<br />
G:ada 10 Social S\ud;as Mad~n FAY 1663 HI 22 411 71 -5.3 "'Averag" Dilferenoo in ProfociantorHighar Across All GmdllS<br />
'omde,10: SoclalSlud,aoi, ~risl~':' 61790 1: ;/1': - "'0.' .;1,3' 7, '31" ',,47 6 2 '78 ~;g~,' 4.4 "Al'Ilrag(lDilferoncelnMinimaiAcrossAlIGmd&s<br />
H<br />
..<br />
Gt_lO<br />
OOi<br />
00,-<br />
joo<br />
•<br />
~31)<br />
f<br />
Jw<br />
'"<br />
&_,<br />
t<br />
~<br />
:1 n...-r-<br />
'$<br />
100<br />
j=<br />
: 15<br />
"<br />
t<br />
1=<br />
Percentage Scoring Advanced<br />
MMSD VS. WisconsIn - ReadIng<br />
I O~F~Y .w"",""," I<br />
rn~~<br />
GmSe4 G""'o5 Grodo6 Glodo7<br />
Percentage Scoring Advanced<br />
MMSD vs. WisconsIn. Math<br />
I CM~ FAY mWlsSln I<br />
&-. -'"<br />
G
I- "1°. 1°10,1· 10 .10<br />
I· I· I· .I. ,I" I"<br />
I<br />
I-<br />
I- I-<br />
l"l<br />
1- 1° 1° :J ° %N,W'"<br />
I·I~ I· ';:;1"1" ,. ',''"''",,,<br />
He I~loI~ 1+1+ 10 %, ",LEe'<br />
I" I~H~<br />
I' l~i"I~<br />
'"<br />
I'I~<br />
'" '" .<br />
,-<br />
t-<br />
•.. ~<br />
.... I..<br />
,_,_ . I·<br />
%Bo"<br />
P
2009 WKCE Madison vs. Wisconsin table_1<br />
Group: Not Econ Disadvantaged<br />
Grado ! Subject<br />
1<br />
j i<br />
l ~<br />
il ~: ~<br />
i<br />
I 1 ~ • 8 ~§<br />
w<br />
~ .. ~<br />
E: OW<br />
~ .~<br />
0 Ii<br />
"<br />
eg<br />
W 0 :i ••<br />
~<br />
~<br />
* ~ ~ ~ :E'':::<br />
Z g:.!! !- * •<br />
B 0<br />
.0<br />
*<br />
* * I<br />
•<br />
j~ ~ • *<br />
I •<br />
~ ~<br />
I l~ 0<br />
"• 0<br />
*<br />
I Grade 3 IReading /Madison' 913 1 o<br />
~ * * •<br />
"<br />
• *<br />
j<br />
I j<br />
-/,: ,; I, ,,: -;-,1, :':: "j ,::' ,1;--:';:"0,, -:~ "I 3<br />
I GredE>4--IReading- Mad!son 884- 1 0 -'--1 0 2--6 ---30' 61 ---" 91 I<br />
I~eai!{ni(';" V(;sP;oIj8J_n" _~7.~ 'Sr!;> >;;;'2::/ 7 ! Reading IM""~ I '" o 232471 95<br />
15 ; 9 " 1 I<br />
o<br />
o<br />
o<br />
642662 88<br />
•<br />
4<br />
4<br />
,<br />
5<br />
5<br />
7<br />
,<br />
Among the non«OnOmlcally dfsadvant:aged students in MMSO a higher pen::entage of students score In the highest proficiency<br />
level - Advanced· On the state test compared with similar students across the state. This percentage point difference ranges from<br />
8 to lS points across aU grade levels in reading, alld between 7 and 13 points In math.<br />
Among the non-ecooomicaHy disadvantaged students, MMSD has a slightly larger percentage of students scoring In the proficlerlt<br />
or higher perofrmance levels compared to the same subgroup of students across the entire state. This finding occurs In both<br />
readl- -~<br />
i<br />
AlSO amOflg non--economicaHy disadvantaged students, MMSD has roughly the same proportion of students scoring at the lowest<br />
performance !evel- Minimal - as the same subgroup of studentsacross the state (less than 3 percellt in reading and less than 6<br />
percent In math).<br />
100<br />
90<br />
~<br />
80<br />
~<br />
70<br />
80<br />
"•<br />
50<br />
~ 40<br />
10<br />
~<br />
30<br />
8:<br />
20<br />
Percentage Scoring Proficient or Higher<br />
MMSD vs. Wisconsin - Reading<br />
Non Economically Disadvantaged students<br />
I CII.ad;son IIWisco1l$;n !<br />
11<br />
( III!I<br />
Grade 3 G'ade4 GradeS Grada!> G,ade7 GradeS G,aOO10<br />
Percentage Scoring Proficient or Higher<br />
MMSD vs. Wisconsin - Math<br />
Non Economically Disadvantaged Students<br />
Je Madison IIIwisconsin!<br />
':;::.32/': ,':_~/;: ::,::':0', ,;- 7 "c-':87;'< 100T~~==~~;=~~==~~==~~==~~======~<br />
00,1..... DO ,-= c: c::<br />
35 54 89<br />
1;\:.;-,4;P : 45 -:;'0'< 9 {~"'~ 3<br />
37 53 90<br />
-1 11 ~4<br />
41 48<br />
S9<br />
43 38<br />
11 1:,::_:86:,/1 3<br />
S1<br />
11 r':;'4a\d 3<br />
• SO<br />
~ 70<br />
g • 60 50<br />
~ 40<br />
~ 30<br />
:. 20<br />
10<br />
~<br />
13_3 13"",.4 Grnd.5 Grade5 Gra
2009 WKCE Madison vs. Wisconsin table_1<br />
Group: African American<br />
~<br />
E~<br />
Jl •<br />
2009 WKCE Madison vs. Wisconsin table_1<br />
Group: Hispanic<br />
I ~ 1* ltil ~ I ~ I I * I ; I i ~<br />
!!l<br />
•<br />
Q<br />
~<br />
~<br />
" j " ~<br />
B<br />
c<br />
,.<br />
S<br />
~<br />
11<br />
~<br />
~<br />
• B<br />
c<br />
~<br />
" <<br />
•<br />
~<br />
~<br />
e<br />
~<br />
SO<br />
70<br />
Percentage ScorIng Proficient or HIgher<br />
MMSD vs. WisconsIn - ReadIng<br />
Hls!!!!n!c Students<br />
I OMad
2009 WKCE Madison vs. Wisconsin table_1<br />
Groups: Asian<br />
Grade I Subject<br />
I Grade 3!ReadiflQ<br />
I Grade 4 I Reading<br />
.! ~<br />
e ;::<br />
Ji _ z 0<br />
! I><br />
* *<br />
!. w.5 .. "l- m !il<br />
<br />
~<br />
g ;:<br />
...I e IXI ~<br />
~ :e * e<br />
.... ------!<br />
10<br />
o .l-UIIL.-LJlil.,..L.IIL,..L<br />
Grada3 Grade4 GradeS Grado6 Grade7 Grade6 Grade 10<br />
Percentage Scoring AdVanced<br />
MMSD vs. Wisconsin· Math<br />
Asian Students<br />
I CMa
2009 WKCE Madison vs. Wisconsin table_1<br />
Group: White<br />
Grade I Subject<br />
I II ~ ~<br />
-. •• i i • i ~ ~ II B·<br />
.~<br />
~E<br />
• <
2009 WKCE Madison vs. Wisconsin table_1<br />
Group: Special Education<br />
" I " "<br />
e •<br />
~<br />
" ..<br />
~<br />
~<br />
• u<br />
.. •<br />
~<br />
;;<br />
~<br />
I " ~<br />
8<br />
..<br />
.. ~<br />
" +<br />
~<br />
50<br />
Percentage ScOring Proficient or Higher<br />
MMSD vs. Wisconsin· Reading<br />
Students with Disabilltles<br />
C~<br />
"""""'""<br />
45 J<br />
~40 f- l- f-<br />
~<br />
~35 f- f- l- f-<br />
il30 l- I-<br />
~ 25 l- I-<br />
f 20 I-<br />
~ 15<br />
•<br />
l- I--<br />
.. 10<br />
f- f- f- f- f-<br />
5 f-f-f-f-f-f- i<br />
0 I..,. t.,. '"- LI<br />
Grade$ Grade4 GradeS GladeS Grade7 Grode$ Grade10<br />
Percentage Scoring Advanced<br />
MMSD VS. Wisconsin· ReadIng<br />
~:: In<br />
Students with OlsablUtles<br />
1 CMa:!-. IIW1$eenS1n !<br />
I ,<br />
~<br />
~ 15<br />
"15<br />
• ~<br />
~ 10<br />
E<br />
.. • 5<br />
0<br />
l- I- r<br />
Ij~<br />
I-- I-- l- I-<br />
LRJ<br />
Grade 3 Grode>l Grade 5 Grad\l6 G",d(l7 Grode 6 Grade 10<br />
60 T ,<br />
Percentage Scoring Proficient or HIgher<br />
MMSO VS. Wisconsin' Math<br />
________ Isw~d~.ms~fw~·5h~D~"~'~b!"w~'J'~ ! CMs:liun aW!«
2009 WKCE Madison vs. Wisconsin table_1<br />
Group: English Language Learners (ELL)<br />
i<br />
AmOng non-native English speaking students, the students from the MMSD score at roughly equivalents rates In the<br />
highest proficiency level catEgory - Advanced - In both reading and math when compared with other non-native<br />
Enalish SPeakers across the state.<br />
AmOng not-native English speaking students, a consistently higher percentage of MMSO students perform at the<br />
jlowest proficiency level on the WKeE telts - Minimal· than do other non-native English speakJng students across<br />
'Tilisls Ihe case in both reading and math. The difference is higher in reading than<br />
Percentage Scoring Proficient or Higher<br />
MMSO VS. Wisconsin· Reading<br />
ELL Students<br />
,OT'____________ lcc="~;.=···~~····~=;.-~w= ....<br />
60<br />
•<br />
1-1-::= I<br />
'50<br />
~<br />
~ 40<br />
R'"<br />
1<br />
20<br />
=······==~d_ ________________ -,<br />
" o<br />
GmdeS Gtade4 GradeS Gfade1l Gtad97 GradeS Grade 10<br />
Percentage Scoring Advanced<br />
MMSD vs. Wisconsin - Reading<br />
ELL Students<br />
rc~~ Q~~<br />
~~tfl~------------------------------_1<br />
'* 16<br />
~ 14<br />
W 12<br />
~ 10<br />
j ,<br />
l<br />
" 6<br />
4<br />
,<br />
o<br />
Gmd83 Gm!e4 Gta:lo5 G._a Gm:IB7 G"""S G",,",10<br />
Percentage Scoring Proficient or Higher<br />
MMSO vs. Wisconsin· Math<br />
ELL Students<br />
'OT'____________ bl=C~== .. ====.=w ... ==_~.LI _________________,<br />
60<br />
•
Principal/IRT Professional Development Meeting<br />
WKCE DATA ANALYSIS WORKSHOP<br />
May 1, 2009<br />
Olson Elementary <strong>School</strong>, Rooms 135 & 136<br />
Key Outcomes:<br />
• Be able to navigate Turnleafto "mine" information from a school's WKCE data.<br />
• Based upon a school's questions, customize analysis through Turnleaf's tools.<br />
• Demonstrate a way to "close the data loop" by connecting test results to a school's<br />
instructional practices.<br />
• Develop a plan to share data with school's staff.<br />
8:15 Welcome!<br />
Overview of morning's work<br />
8:30 WKCE Data on WINSS: Common Questions<br />
8:45 WKCE Test Item Experience<br />
- What do students experience in taking the test?<br />
- Why is this important in understanding the data? a school's test<br />
preparation practices?<br />
9:00 Navigating Turnleaf: Basics of the Tool<br />
- How is the analysis tool designed?<br />
- How can I use the tool to answer questions?<br />
- How can I best discern trends and patterns?<br />
9:15 Navigating Turnleaf: Proficiency Summary and Longitudinal Data
- How did a school/groups of students perform this fall?<br />
- How has a school/groups of students performed over time?<br />
9:30 Navigating Turnleaf: Analysis by Standards<br />
- How do reading and math results break down by standards?<br />
- What might these findings mean for instruction?<br />
9:4S Navigating Turnleaf: Analysis by Items<br />
- How do standards break down by test items?<br />
- What might these findings mean for instruction<br />
10:00<br />
BREAK<br />
10:15<br />
Customized Analysis/Consultation with Instructional Expertise<br />
11:00<br />
Planning: How to share the data with your staff?<br />
11:15<br />
Next Steps<br />
Adjourn

![by Shaina Wright [PDF] Ralph Waldo Emerson Prize 2006 - School ...](https://img.yumpu.com/26083584/1/174x260/by-shaina-wright-pdf-ralph-waldo-emerson-prize-2006-school-.jpg?quality=85)