The Maryland High School Assessments (HSA) are tests that ...
The Maryland High School Assessments (HSA) are tests that ...
The Maryland High School Assessments (HSA) are tests that ...
Create successful ePaper yourself
Turn your PDF publications into a flip-book with our unique Google optimized e-Paper software.
4<br />
Method<br />
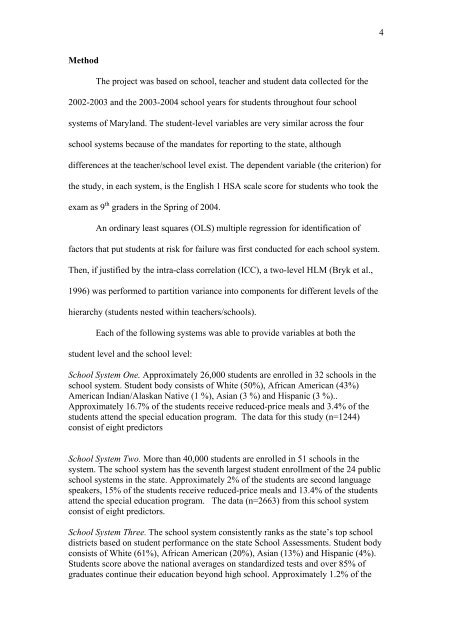
<strong>The</strong> project was based on school, teacher and student data collected for the<br />
2002-2003 and the 2003-2004 school years for students throughout four school<br />
systems of <strong>Maryland</strong>. <strong>The</strong> student-level variables <strong>are</strong> very similar across the four<br />
school systems because of the mandates for reporting to the state, although<br />
differences at the teacher/school level exist. <strong>The</strong> dependent variable (the criterion) for<br />
the study, in each system, is the English 1 <strong>HSA</strong> scale score for students who took the<br />
exam as 9 th graders in the Spring of 2004.<br />
An ordinary least squ<strong>are</strong>s (OLS) multiple regression for identification of<br />
factors <strong>that</strong> put students at risk for failure was first conducted for each school system.<br />
<strong>The</strong>n, if justified by the intra-class correlation (ICC), a two-level HLM (Bryk et al.,<br />
1996) was performed to partition variance into components for different levels of the<br />
hierarchy (students nested within teachers/schools).<br />
Each of the following systems was able to provide variables at both the<br />
student level and the school level:<br />
<strong>School</strong> System One. Approximately 26,000 students <strong>are</strong> enrolled in 32 schools in the<br />
school system. Student body consists of White (50%), African American (43%)<br />
American Indian/Alaskan Native (1 %), Asian (3 %) and Hispanic (3 %)..<br />
Approximately 16.7% of the students receive reduced-price meals and 3.4% of the<br />
students attend the special education program. <strong>The</strong> data for this study (n=1244)<br />
consist of eight predictors<br />
<strong>School</strong> System Two. More than 40,000 students <strong>are</strong> enrolled in 51 schools in the<br />
system. <strong>The</strong> school system has the seventh largest student enrollment of the 24 public<br />
school systems in the state. Approximately 2% of the students <strong>are</strong> second language<br />
speakers, 15% of the students receive reduced-price meals and 13.4% of the students<br />
attend the special education program. <strong>The</strong> data (n=2663) from this school system<br />
consist of eight predictors.<br />
<strong>School</strong> System Three. <strong>The</strong> school system consistently ranks as the state’s top school<br />
districts based on student performance on the state <strong>School</strong> <strong>Assessments</strong>. Student body<br />
consists of White (61%), African American (20%), Asian (13%) and Hispanic (4%).<br />
Students score above the national averages on standardized <strong>tests</strong> and over 85% of<br />
graduates continue their education beyond high school. Approximately 1.2% of the


