the hydraulic and water quality performance of sustainable drainage ...
the hydraulic and water quality performance of sustainable drainage ...
the hydraulic and water quality performance of sustainable drainage ...

You also want an ePaper? Increase the reach of your titles
YUMPU automatically turns print PDFs into web optimized ePapers that Google loves.
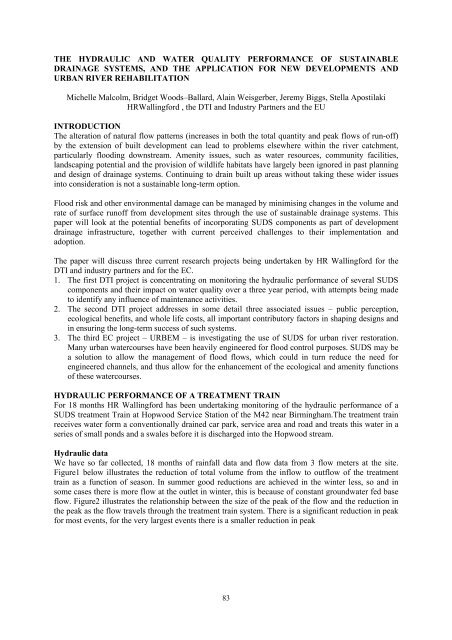
THE HYDRAULIC AND WATER QUALITY PERFORMANCE OF SUSTAINABLE<br />
DRAINAGE SYSTEMS, AND THE APPLICATION FOR NEW DEVELOPMENTS AND<br />
URBAN RIVER REHABILITATION<br />
Michelle Malcolm, Bridget Woods–Ballard, Alain Weisgerber, Jeremy Biggs, Stella Apostilaki<br />
HRWallingford , <strong>the</strong> DTI <strong>and</strong> Industry Partners <strong>and</strong> <strong>the</strong> EU<br />
INTRODUCTION<br />
The alteration <strong>of</strong> natural flow patterns (increases in both <strong>the</strong> total quantity <strong>and</strong> peak flows <strong>of</strong> run-<strong>of</strong>f)<br />
by <strong>the</strong> extension <strong>of</strong> built development can lead to problems elsewhere within <strong>the</strong> river catchment,<br />
particularly flooding downstream. Amenity issues, such as <strong>water</strong> resources, community facilities,<br />
l<strong>and</strong>scaping potential <strong>and</strong> <strong>the</strong> provision <strong>of</strong> wildlife habitats have largely been ignored in past planning<br />
<strong>and</strong> design <strong>of</strong> <strong>drainage</strong> systems. Continuing to drain built up areas without taking <strong>the</strong>se wider issues<br />
into consideration is not a <strong>sustainable</strong> long-term option.<br />
Flood risk <strong>and</strong> o<strong>the</strong>r environmental damage can be managed by minimising changes in <strong>the</strong> volume <strong>and</strong><br />
rate <strong>of</strong> surface run<strong>of</strong>f from development sites through <strong>the</strong> use <strong>of</strong> <strong>sustainable</strong> <strong>drainage</strong> systems. This<br />
paper will look at <strong>the</strong> potential benefits <strong>of</strong> incorporating SUDS components as part <strong>of</strong> development<br />
<strong>drainage</strong> infrastructure, toge<strong>the</strong>r with current perceived challenges to <strong>the</strong>ir implementation <strong>and</strong><br />
adoption.<br />
The paper will discuss three current research projects being undertaken by HR Wallingford for <strong>the</strong><br />
DTI <strong>and</strong> industry partners <strong>and</strong> for <strong>the</strong> EC.<br />
1. The first DTI project is concentrating on monitoring <strong>the</strong> <strong>hydraulic</strong> <strong>performance</strong> <strong>of</strong> several SUDS<br />
components <strong>and</strong> <strong>the</strong>ir impact on <strong>water</strong> <strong>quality</strong> over a three year period, with attempts being made<br />
to identify any influence <strong>of</strong> maintenance activities.<br />
2. The second DTI project addresses in some detail three associated issues – public perception,<br />
ecological benefits, <strong>and</strong> whole life costs, all important contributory factors in shaping designs <strong>and</strong><br />
in ensuring <strong>the</strong> long-term success <strong>of</strong> such systems.<br />
3. The third EC project – URBEM – is investigating <strong>the</strong> use <strong>of</strong> SUDS for urban river restoration.<br />
Many urban <strong>water</strong>courses have been heavily engineered for flood control purposes. SUDS may be<br />
a solution to allow <strong>the</strong> management <strong>of</strong> flood flows, which could in turn reduce <strong>the</strong> need for<br />
engineered channels, <strong>and</strong> thus allow for <strong>the</strong> enhancement <strong>of</strong> <strong>the</strong> ecological <strong>and</strong> amenity functions<br />
<strong>of</strong> <strong>the</strong>se <strong>water</strong>courses.<br />
HYDRAULIC PERFORMANCE OF A TREATMENT TRAIN<br />
For 18 months HR Wallingford has been undertaking monitoring <strong>of</strong> <strong>the</strong> <strong>hydraulic</strong> <strong>performance</strong> <strong>of</strong> a<br />
SUDS treatment Train at Hopwood Service Station <strong>of</strong> <strong>the</strong> M42 near Birmingham.The treatment train<br />
receives <strong>water</strong> form a conventionally drained car park, service area <strong>and</strong> road <strong>and</strong> treats this <strong>water</strong> in a<br />
series <strong>of</strong> small ponds <strong>and</strong> a swales before it is discharged into <strong>the</strong> Hopwood stream.<br />
Hydraulic data<br />
We have so far collected, 18 months <strong>of</strong> rainfall data <strong>and</strong> flow data from 3 flow meters at <strong>the</strong> site.<br />
Figure1 below illustrates <strong>the</strong> reduction <strong>of</strong> total volume from <strong>the</strong> inflow to outflow <strong>of</strong> <strong>the</strong> treatment<br />
train as a function <strong>of</strong> season. In summer good reductions are achieved in <strong>the</strong> winter less, so <strong>and</strong> in<br />
some cases <strong>the</strong>re is more flow at <strong>the</strong> outlet in winter, this is because <strong>of</strong> constant ground<strong>water</strong> fed base<br />
flow. Figure2 illustrates <strong>the</strong> relationship between <strong>the</strong> size <strong>of</strong> <strong>the</strong> peak <strong>of</strong> <strong>the</strong> flow <strong>and</strong> <strong>the</strong> reduction in<br />
<strong>the</strong> peak as <strong>the</strong> flow travels through <strong>the</strong> treatment train system. There is a significant reduction in peak<br />
for most events, for <strong>the</strong> very largest events <strong>the</strong>re is a smaller reduction in peak<br />
83
National Hydrology Seminar 2003<br />
Michelle Malcolm et al<br />
Volume reduction as a function <strong>of</strong> event date<br />
40.0%<br />
20.0%<br />
Volume reduction ST-DS<br />
0.0%<br />
04/04/02 00:00 24/05/02 00:00 13/07/02 00:00 01/09/02 00:00 21/10/02 00:00 10/12/02 00:00 29/01/03 00:00<br />
-20.0%<br />
-40.0%<br />
-60.0%<br />
Very small event. The accuracy<br />
limit <strong>of</strong> <strong>the</strong> instruments is<br />
h d<br />
Events following 2 dry months.<br />
The conditions are summer-like<br />
-80.0%<br />
-100.0%<br />
Figure 1<br />
Lag time as a function <strong>of</strong> upstream peak flow<br />
140<br />
120<br />
100<br />
Peak lag time (min)<br />
80<br />
60<br />
40<br />
20<br />
0<br />
0 10 20 30 40 50 60 70 80 90 100<br />
ST peak flow (l/s)<br />
Figure 2<br />
84
National Hydrology Seminar 2003<br />
Michelle Malcolm et al<br />
TREATMENT TRAIN WATER QUALITY PERFORMANCE<br />
HR Wallingford <strong>and</strong> <strong>the</strong> Environment Agency have been taking grab <strong>water</strong> <strong>quality</strong> samples at <strong>the</strong> site<br />
over a 2 year period. These samples have been taken both in wet <strong>and</strong> dry conditions <strong>and</strong> illustrate <strong>the</strong><br />
effectiveness <strong>of</strong> <strong>the</strong> ponds in <strong>the</strong> removal <strong>of</strong> pollutants.<br />
25<br />
Coach Park Treatment Train (BOD)<br />
20<br />
15<br />
10<br />
5<br />
0<br />
Silt trap Interceptor Service yard<br />
Total Wetl<strong>and</strong> Wetl<strong>and</strong> Swale Pond 2<br />
08-Feb-00 17-Aug-00pond<br />
13-Nov-00pond<br />
30-Jan-01 24-Apr-01 Inputs 12-Nov-01 04-Dec-01 20-Feb-02 20-Mar-02<br />
01-May-02 23-Oct -02 26-Nov-02<br />
100<br />
Coach Park Treatment Train (Lead)<br />
90<br />
80<br />
70<br />
60<br />
50<br />
40<br />
30<br />
20<br />
10<br />
0<br />
Silt trap Interceptor Service yard<br />
Total Wetl<strong>and</strong> Wetl<strong>and</strong> Swale Pond 2<br />
08-Feb-00 17- Aug- 00pond<br />
13-Nov-00 pond30-Jan-01 24-Apr-01 Inputs 12-Nov-01 04-Dec-01 20-Feb-02 20-Mar-02<br />
01-May-02 23-Oct-02 26-Nov-02<br />
This <strong>water</strong> <strong>quality</strong> data was fur<strong>the</strong>r analysed as part <strong>of</strong> ecological <strong>performance</strong> research was<br />
undertaken by Jeremy Biggs from <strong>the</strong> Ponds Conservation Trust under sub-contract to HR<br />
Wallingford.<br />
A major part <strong>of</strong> <strong>the</strong> research was analysing <strong>the</strong> <strong>water</strong> <strong>quality</strong> data collected by HR <strong>and</strong> <strong>the</strong><br />
Environment Agency against ecological indicators. It is valuable to look at <strong>water</strong> <strong>quality</strong> data in this<br />
way because <strong>of</strong>ten SUDS <strong>water</strong> <strong>quality</strong> <strong>performance</strong> is expressed in percentage removal <strong>of</strong><br />
determin<strong>and</strong>s. However a truer indication <strong>of</strong> <strong>performance</strong> is not how much <strong>of</strong> detemin<strong>and</strong> a SUD<br />
85
National Hydrology Seminar 2003<br />
Michelle Malcolm et al<br />
system can remove, but ra<strong>the</strong>r if <strong>the</strong> SUD system can remove enough <strong>of</strong> <strong>the</strong> determin<strong>and</strong> so as it will<br />
not impact on <strong>the</strong> resident <strong>and</strong> downstream ecology.<br />
140<br />
120<br />
Sus<br />
100<br />
pen<br />
ded<br />
soli<br />
ds 80<br />
(mg<br />
/l)<br />
60<br />
TSS average 2000-2002<br />
40<br />
20<br />
EU urban waste <strong>water</strong><br />
discharge st<strong>and</strong>ards<br />
Mean for natural, minimally<br />
impaired pond<br />
0<br />
Coach Park Silt<br />
Trap<br />
Interception Pond<br />
Interceptor<br />
Wetl<strong>and</strong><br />
Swale<br />
Balancing Pond<br />
WHOLE LIFE COSTING<br />
An underst<strong>and</strong>ing <strong>of</strong> <strong>the</strong> potential financial implications <strong>of</strong> taking responsibility for <strong>the</strong>se systems in<br />
<strong>the</strong> long-term is a vital consideration for any potential adopting authority, be <strong>the</strong>y property<br />
management companies, local authority service teams, or sewerage undertakers. The tools that are<br />
being developed by <strong>the</strong> project should allow appropriate comparisons to be made between different<br />
design solutions, <strong>and</strong> between <strong>sustainable</strong> systems <strong>and</strong> more conventional alternatives. Through<br />
identification <strong>of</strong> <strong>the</strong> likely expenditure pr<strong>of</strong>ile for <strong>the</strong> system over its design life, this should support<br />
future operators in entering into maintenance agreements with increased confidence, <strong>and</strong> with<br />
appropriate level <strong>of</strong> funding having been secured.<br />
Whole Life Costing (WLC) is about identifying future costs <strong>and</strong> referring <strong>the</strong>m back to present day<br />
values using st<strong>and</strong>ard accounting techniques (such as Present Value). It is recognised as an<br />
appropriate technique for use in valuing total costs <strong>of</strong> assets that have regular operating <strong>and</strong>/or<br />
recurrent maintenance costs, based on formalised maintenance programmes.<br />
The different approaches to WLC are presented below:<br />
WHOLE LIFE COSTING<br />
ECONOMIC APPRAISAL<br />
FINANCIAL APPRAISAL<br />
Non-Monetary Costs +<br />
Monetary Costs<br />
Environmental<br />
Costs<br />
e.g. flood damage,<br />
pollution<br />
Environmental<br />
Benefits<br />
e.g. amenity /<br />
ecological<br />
enhancement<br />
Direct Costs<br />
e.g. capital,<br />
operating, disposal<br />
costs, system<br />
revenue<br />
Indirect Costs<br />
e.g. st<strong>and</strong>by<br />
equipment hire,<br />
compensation<br />
payments<br />
86
National Hydrology Seminar 2003<br />
Michelle Malcolm et al<br />
Selection <strong>of</strong> <strong>the</strong> most appropriate discount rate is one <strong>of</strong> <strong>the</strong> most contentious issues in whole life<br />
costing, as it can have a significant effect on <strong>the</strong> outcome <strong>of</strong> <strong>the</strong> analysis. As a general guide,<br />
calculations Present Value (PV) is <strong>the</strong> st<strong>and</strong>ard accounting method used, <strong>and</strong> is defined in MAFF<br />
(1999) as “<strong>the</strong> value <strong>of</strong> a stream <strong>of</strong> benefits or costs when discounted back to <strong>the</strong> present time”. It can<br />
be thought <strong>of</strong> as <strong>the</strong> sum <strong>of</strong> money that needs to be spent today to meet all future costs as <strong>the</strong>y arise<br />
throughout <strong>the</strong> life cycle <strong>of</strong> a scheme or structure. The formula for calculating <strong>the</strong> present value is<br />
given by <strong>the</strong> following equation:<br />
t<br />
PV = ∑ = N<br />
Ct<br />
t= 0<br />
r t<br />
(1+<br />
)<br />
100<br />
Where N = Time horizon in years; C t = Total monetary costs in year t; r = Discount rate<br />
Using a high discount rate will make future costs less important, <strong>and</strong> a lower discount rate will<br />
increase <strong>the</strong>ir significance. In <strong>the</strong> public sector, <strong>the</strong> discount rate is set by <strong>the</strong> Treasury. They are<br />
currently recommending a rate <strong>of</strong> 3.5 % - a recent shift from a long-term historic value, which had<br />
been set at 6 %. The Treasury are also recommending that for projects with long-term impacts, over<br />
thirty years, a declining schedule <strong>of</strong> discount rates should be used ra<strong>the</strong>r than <strong>the</strong> st<strong>and</strong>ard discount<br />
rate, as shown in <strong>the</strong> following table:<br />
Period <strong>of</strong> years 0 - 30 31 - 75 76 - 125 126 – 200 201 - 300 300 +<br />
Discount rate 3.5 % 3.0 % 2.5 % 2.0 % 1.5 % 1.0 %<br />
The following graph shows <strong>the</strong> impact <strong>of</strong> time on <strong>the</strong> relative contribution <strong>of</strong> yearly costs to <strong>the</strong> total<br />
in a 100-year analysis, using <strong>the</strong> current Treasury recommendations <strong>and</strong> <strong>the</strong> historic 6 % discount rate.<br />
Discount Factor<br />
1.2<br />
1<br />
0.8<br />
0.6<br />
0.4<br />
0.2<br />
0<br />
0 20 40 60 80 100 120<br />
Year<br />
6 % Fixed Long Term Variable (from 3.5 %)<br />
This confirms that, using <strong>the</strong> new Treasury recommendations, <strong>the</strong> contribution <strong>of</strong> operation <strong>and</strong><br />
maintenance expenditure will be <strong>of</strong> increased significance to <strong>the</strong> WLC <strong>of</strong> <strong>the</strong> <strong>drainage</strong> system.<br />
<strong>sustainable</strong> <strong>drainage</strong> systems. In <strong>the</strong>ory, with appropriate maintenance, <strong>the</strong>ir life should be unlimited<br />
as <strong>the</strong>re is no risk <strong>of</strong> structural failures.<br />
A spreadsheet model was developed that allows costs to be built up for systems, depending on <strong>the</strong>ir<br />
design criteria. The tool highlights all <strong>the</strong> important materials <strong>and</strong> processes, <strong>and</strong> allows <strong>the</strong> user to<br />
incorporate additional, site specific costs should <strong>the</strong>y so choose. The model presents a best estimate<br />
87
National Hydrology Seminar 2003<br />
Michelle Malcolm et al<br />
<strong>of</strong> ‘average’ or ‘likely’ unit costs, but <strong>the</strong>se should be reviewed <strong>and</strong> adjusted for site-specific<br />
application.<br />
Retention Pond<br />
Development Characteristics<br />
Default<br />
User Entry<br />
Area <strong>of</strong> development 1 ha<br />
Percentage impermeability 80 %<br />
WRAP Soil Class (1-5) 4<br />
SOIL factor 0.45 0.00<br />
M5-2D rainfall 50 mm<br />
M5-60 as a fraction <strong>of</strong> M5-2D 0.40<br />
M5-60 20 0 mm<br />
Hydraulic Design: St<strong>and</strong>ard <strong>of</strong> Service<br />
Assumptions for <strong>hydraulic</strong> SoS:<br />
1) 80 % impermeability<br />
2) South East Engl<strong>and</strong> (Wokingham climate)<br />
Return Period (choose from 10, 30, 50, 100 yrs 50 yrs<br />
Throttle Rate (choose from 3,7,10 l/s/ha) 3 l/s/ha<br />
Computed detention rate (using simplified rainfall run<strong>of</strong>f model) 325 m 3 /ha<br />
Computed detention volume (using simplified rainfall run<strong>of</strong>f model) 325 m 3<br />
Total Detention Volume 325 m 3<br />
Water Quality: St<strong>and</strong>ard <strong>of</strong> Service<br />
Treatment volume rate, Vt/ha 152 m 3 /ha<br />
Treatment volume rate, Vt 152<br />
Permenant pond volume factor (should equal 4 X Vt (Ciria C522)) 4 factor<br />
Total Treatment Volume 608 m 3<br />
There are a range <strong>of</strong> design characteristics that will influence <strong>the</strong> cost <strong>of</strong> a <strong>sustainable</strong> <strong>drainage</strong><br />
scheme. The model default assumes characteristics based on current design best practice, as set out in<br />
<strong>the</strong> CIRIA design manuals. However, <strong>the</strong> user may also enter site-specific features. The following<br />
figure shows an example <strong>of</strong> model <strong>performance</strong> criteria, for a retention pond:<br />
88
National Hydrology Seminar 2003<br />
Michelle Malcolm et al<br />
Retention Pond<br />
Default<br />
User Entry<br />
Geometric Characteristics<br />
Length:Width Ratio (3:1 recommended) 3 X:1<br />
Average Permanent Pool Depth (1-2 m recommended) 1.5 m<br />
Maximum Total Pool Depth (max 3 m <strong>and</strong> max 2 m above permanent depth) 3 m<br />
Freeboard 0.25 m<br />
Pond Side Slopes (max 1 in 4 recommended) 4 1in X<br />
Shallow Benching<br />
Y<br />
Width <strong>of</strong> Shallow Bench (model assumes 10% <strong>of</strong> permanent pond area ) 1<br />
Design Chacteristics: Infrastructure<br />
Forebay / Silt Trap Pond (assume 10% <strong>of</strong> total pond, Vt) Y Y/N<br />
Engineered Silt Trap Structure N Y/N<br />
Design charactersitics: Excavation<br />
Will excavated material be disposed <strong>of</strong> on site Y Y/N<br />
Is <strong>the</strong> soil hard (chalk, stiff clay, s<strong>of</strong>t rock, broken rock) N Y/N<br />
Design Chacteristics: Planting<br />
Aquatic planting (width <strong>of</strong> marginal vegetation) Y Y/N<br />
Will <strong>the</strong>re be bankside / barrier planting Y Y/N<br />
Bankside / barrier planting (width <strong>of</strong> bankside vegetation) 5 m<br />
L<strong>and</strong> allocation<br />
Additional width around pond allocated for essential access / maintenance 5 m<br />
Will <strong>the</strong>re be an area allocated for sediment de-<strong>water</strong>ing? Y Y/N<br />
Additional area allocated for sediment de<strong>water</strong>ing (% <strong>of</strong> pond area) 20 %<br />
Will <strong>the</strong>re be an extra area allocated for amenity/recreation? Y Y/N<br />
Additional area allocated for recreation / amenity benefit (% <strong>of</strong> pond area) 5 %<br />
Easement width<br />
m<br />
Easement length<br />
m<br />
This model will <strong>the</strong>n be validated against <strong>the</strong> information available from literature, as indicated in <strong>the</strong><br />
following figures. Actual cost values cannot currently be published, due to ongoing work in this area.<br />
Texas HA (2001)<br />
Amenity pond,with reedbed<br />
Co<br />
st<br />
(£)<br />
Amenity pond, large concrete<br />
weir outlet<br />
Weigl<strong>and</strong> (1987)<br />
SWRPC (1991)<br />
Schueler (1991)<br />
0 2000 4000 6000 8000 10000 12000 14000 16000 18000 20000<br />
Volume (m 3 )<br />
89
National Hydrology Seminar 2003<br />
Michelle Malcolm et al<br />
Sustainable <strong>drainage</strong> schemes require ongoing maintenance in order to ensure short-term operation<br />
<strong>and</strong> minimise risks to long term <strong>performance</strong>. Maintenance activities are likely to comprise a major<br />
contribution to total life costs, <strong>and</strong> <strong>the</strong> lack <strong>of</strong> underst<strong>and</strong>ing <strong>and</strong> quantification <strong>of</strong> <strong>the</strong>se to date is<br />
currently one <strong>of</strong> <strong>the</strong> barriers to facilitating adoption agreements.<br />
Operation <strong>and</strong> maintenance activities can be classified as follows:<br />
• Monitoring<br />
• Regular, planned maintenance (e.g. rodding culverts, clearing debris from manholes, grass-cutting,<br />
vegetation management, sediment removal, jetting <strong>of</strong> permeable surfaces <strong>and</strong> silt traps)<br />
• Unplanned maintenance / rehabilitation (e.g. responding to problems e.g. blocked culverts/trashracks,<br />
pollution incident, vegetation death etc)<br />
• Intermittent maintenance (e.g. for major mid-life refurbishment such as geotextile replacement,<br />
vegetation replacement, soakaway replacement etc).<br />
REGULAR MAINTENANCE (SUB-ANNUAL/ANNUAL)<br />
Activity Frequency Frequency Unit rate Unit rate Unit Quantity Quantity Total<br />
(times per year) (times per year) (£) (£) (Nr. <strong>of</strong> units) (Nr. <strong>of</strong> units) costs<br />
model User model User Model User per visit (£)<br />
Mow amenity <strong>and</strong> easement 12 2.67 100m 2 0.35 0.93<br />
Mow pond surrounds <strong>and</strong> access 12 2.67 100m 2 4.81 12.83<br />
Collect litter from amenity <strong>and</strong> easement 12 5.00 100m 2 0.35 1.75<br />
Collect litter from around <strong>the</strong> pond 12 5.00 100m 2 7.64 38.16<br />
Collect litter from pond 12 5.00 100m 2 7.00 35.00<br />
Manage bank vegetation 2 38.50 100m 2 0.96 36.79<br />
Manage aquatic vegetation 2 0.00 100m 2 1.26 0.00<br />
Check inlets <strong>and</strong> outlets 12 24.30 nr 1 24.30<br />
Rip-rap <strong>and</strong> weir inspection 12 25.00 nr 1 25.00<br />
Emptying <strong>of</strong> engineered silt trap 0 0.00 hour 1 0.00<br />
Additional monitoring<br />
IRREGULAR MAINTENANCE (REFURBISHMENT AT > 1 YR RECURRENCE INTERVAL)<br />
Activity Frequency Frequency Unit rate Unit rate Unit Quantity Quantity Total<br />
(Nr <strong>of</strong> years<br />
between visits)<br />
(Nr <strong>of</strong> years<br />
between visits) (£) (£) (Nr. <strong>of</strong> units) (Nr. <strong>of</strong> units) costs<br />
Model User model User Model User per visit(£)<br />
Planned Refurbishment<br />
De-silting forebay 3 15.44 m 3 16.25 250.92<br />
De-silting pond 0 15.44 m 3 0 0.00<br />
Mobilisation for silt removal 3 5 nr 15 76.03<br />
L<strong>and</strong>fill charge (special waste) 3 100.00 m 3 15 1521.00<br />
Replace topsoil <strong>and</strong> planting 25% 0 19.34 m 2 46 887.12<br />
Replace geotextile 0 7.15 m 2 46 327.92<br />
Unplanned Rehabilitation<br />
clearing inlet <strong>and</strong> outlet blockages. 0 100.00 nr 0 0.00<br />
Construction Silt<br />
Remove construction silt (inc: de-silting <strong>and</strong> l<strong>and</strong>fill as (special waste)) 0 26.25 m 3 0 0.00<br />
Mobilistation for construction silt removal 0 5 nr 0 0.00<br />
RESULTS AND CONCLUSIONS OF WLC MODEL<br />
Generic pr<strong>of</strong>iles similar to <strong>the</strong> following are currently being developed for different SuD components,<br />
<strong>and</strong> guidance provided on how to use <strong>the</strong> simple spreadsheet model, for site-specific application.<br />
The project has demonstrated <strong>the</strong> relevance <strong>of</strong> using a Whole Life Costing approach for planning <strong>and</strong><br />
implementing <strong>sustainable</strong> <strong>drainage</strong> systems on new developments. It is hoped that such a tool will<br />
enhance industry confidence in SUDS, <strong>and</strong> support <strong>the</strong> development <strong>of</strong> long-term operation <strong>and</strong><br />
maintenance agreements<br />
Comparison WLC Pond <strong>and</strong> Storage Tank<br />
3.5% disount rate, 1 ha catchment, 50 yr design event<br />
Retention<br />
Pond<br />
£<br />
Underground<br />
Storage<br />
0<br />
2<br />
4<br />
6<br />
8<br />
10<br />
12<br />
14<br />
16<br />
18<br />
20<br />
22<br />
24<br />
26<br />
28<br />
30<br />
32<br />
34<br />
36<br />
38<br />
40<br />
42<br />
44<br />
46<br />
48<br />
Years<br />
90
National Hydrology Seminar 2003<br />
Michelle Malcolm et al<br />
PUBLIC PERCEPTION OF SUDS PONDS<br />
Stella Apostoklai from Abertay University worked under subcontract to HR Wallingford, to assess <strong>the</strong><br />
public’s perception <strong>of</strong> SUDS ponds A survey was undertaken <strong>of</strong> residents living close to SUDS ponds.<br />
The purpose <strong>of</strong> <strong>the</strong> survey was to determine <strong>the</strong> level <strong>of</strong> knowledge people had about <strong>the</strong> function <strong>of</strong><br />
SUDS ponds <strong>and</strong> to assess what were <strong>the</strong> perceived advantages <strong>and</strong> disadvantages with <strong>the</strong> ponds.<br />
Pond's Perceived Disadvantages<br />
70.0%<br />
70%<br />
Safety Risks<br />
60%<br />
Pe<br />
rce<br />
nta 50%<br />
ge<br />
s<br />
<strong>of</strong><br />
Re<br />
40%<br />
sp<br />
on<br />
de 30%<br />
nts<br />
20%<br />
10.0%<br />
Litter pollution<br />
None<br />
Not aes<strong>the</strong>tically pleasing<br />
V<strong>and</strong>alism<br />
10%<br />
5.0%<br />
0%<br />
Percent.<br />
Perceived disadvantages <strong>of</strong> <strong>the</strong> new pond<br />
Pond's Perceived Disadvantages<br />
50%<br />
45%<br />
40%<br />
35%<br />
30%<br />
25%<br />
20%<br />
15%<br />
10%<br />
5%<br />
0%<br />
45.5%<br />
18.2%<br />
9.1%<br />
1<br />
Perceived Disadvantages <strong>of</strong> <strong>the</strong><br />
established pond<br />
None<br />
Floods over <strong>the</strong><br />
road<br />
Increased traffic<br />
due to visitors<br />
V<strong>and</strong>alism<br />
Badly maintained / It<br />
is silted up<br />
91
National Hydrology Seminar 2003<br />
Michelle Malcolm et al<br />
THE USE OF SUDS IN URBAN RIVER REHABILITATION<br />
HR Wallingford is co-ordinating an EC funded project – URBEM – urban river enhancement<br />
methods. The project has 12 partners from 6 European countries <strong>and</strong> will over <strong>the</strong> next 2 years. One <strong>of</strong><br />
<strong>the</strong> outputs from <strong>the</strong> URBEM project is to develop a decision support systems for determining <strong>the</strong><br />
urban rivers with <strong>the</strong> most potential for enhancement.<br />
The potential <strong>of</strong> urban rivers will be considered under five categories:<br />
Hydraulic functioning<br />
Ecological Status<br />
Amenity<br />
Aes<strong>the</strong>tics<br />
Social <strong>and</strong> economic<br />
A range <strong>of</strong> methods for enhancing rivers will be considered from a catchment to channel scale.<br />
Spatial scale<br />
Catchment<br />
Sub-catchment<br />
Channel<br />
Methods for improving urban rivers<br />
Planning<br />
L<strong>and</strong> use control<br />
Abstraction planning <strong>and</strong> consents<br />
Discharge Planning consents<br />
Water framework directive planning<br />
SUDS<br />
Attenuating new development to green field run <strong>of</strong>f rates<br />
Treating storm <strong>water</strong> so it has no adverse effect on in-stream ecology<br />
Green corridor<br />
Cycle ways <strong>and</strong> footpaths<br />
Planting, l<strong>and</strong>scape improvements<br />
Bins, streetlights, seat<br />
SUDS<br />
Retr<strong>of</strong>itting CSO’s<br />
Geomorphological <strong>and</strong> engineering solutions<br />
Day lighting<br />
Me<strong>and</strong>ers, riffle pool<br />
Fish passes<br />
SUDS can be used at catchment or sub-catchment level to reduce <strong>the</strong> cumulative impact <strong>of</strong> new<br />
development on urban rivers. Also be used as engineering solutions at <strong>the</strong> channel scale with potential<br />
to be used to improve local <strong>water</strong> <strong>quality</strong> problems – for example reed-beds to treat CSO discharges.<br />
SUDS also <strong>of</strong>fer a potential solution in improving channels that are heavily engineered for flood<br />
alleviation purposes. Where sufficient l<strong>and</strong> exists SUDS could be used locally to reduce <strong>the</strong> flood<br />
flows <strong>and</strong> potentially <strong>the</strong> needs for such an engineered channel.<br />
REPORTS<br />
More information can be found on <strong>the</strong> research discussed in this paper from a series <strong>of</strong> technical<br />
reports available from HR Wallingford.<br />
HR Wallingford 2003: SR622 Assessment <strong>of</strong> <strong>the</strong> Social Impacts <strong>of</strong> Sustainable Drainage<br />
HR Wallingford 2003: SR625 Maximising <strong>the</strong> Ecological Benefits <strong>of</strong> Sustainable Drainage Schemes<br />
HR Wallingford 2003: SR626 The Operation <strong>and</strong> Maintenance <strong>of</strong> Sustainable Drainage <strong>and</strong><br />
Associated Costs<br />
HR Wallingford 2003: SR627 The Whole Life Costing for Sustainable Drainage<br />
92