Hygrothermal aging of a filled epoxy resin - Schneider Electric
Hygrothermal aging of a filled epoxy resin - Schneider Electric
Hygrothermal aging of a filled epoxy resin - Schneider Electric

Create successful ePaper yourself
Turn your PDF publications into a flip-book with our unique Google optimized e-Paper software.
<strong>Schneider</strong> <strong>Electric</strong> 2007 - Conferences publications<br />
to 20 mg is reported hereafter.<br />
Dynamic Mechanical Analysis (DMA): The evolution<br />
<strong>of</strong> mechanical properties and thermal transitions during<br />
conditioning were measured by DMA with a TA<br />
instruments® 2980 using the 3-point bending mode.<br />
Taking into account the elastic domain <strong>of</strong> the material,<br />
the measurement conditions were the following: a<br />
dynamic magnitude <strong>of</strong> 50µm and a static force <strong>of</strong> 140%<br />
<strong>of</strong> the dynamic force. The samples were rectangular in<br />
shape 40×10×0.5mm 3 . The frequency was 1Hz and the<br />
temperature rise was 3°C/min from -40°C to 140°C.<br />
RESULTS AND DISCUSSION<br />
Moisture uptake results<br />
Three different samples, either <strong>filled</strong> or not <strong>filled</strong>, were<br />
measured for each conditioning duration. Mean values<br />
and standard deviations are reported in Figure 1. For a<br />
better comparison <strong>of</strong> the two materials, mass variations<br />
<strong>of</strong> the <strong>filled</strong> samples were calculated taking into account<br />
the initial mass <strong>of</strong> un<strong>filled</strong> <strong>resin</strong>, evaluated by the mean<br />
filling content <strong>of</strong> 60%.<br />
Water saturation <strong>of</strong> not <strong>filled</strong> samples is observed after<br />
about 5 days. The water uptake was then <strong>of</strong> 1.5%. The<br />
mass uptake <strong>of</strong> <strong>filled</strong> samples is lower at the beginning<br />
than the one <strong>of</strong> un<strong>filled</strong> ones: the kinetics <strong>of</strong> water<br />
absorption is slower. The water diffusion is impeded by<br />
the silica grains, which slow down its propagation<br />
throughout the whole material. After 5 days<br />
conditioning, the mass variation was close to the one <strong>of</strong><br />
un<strong>filled</strong> samples but measurements tend to indicate that<br />
the mass uptake continues to progress after the quasi–<br />
saturation has been reached. This specific behaviour <strong>of</strong><br />
<strong>filled</strong> samples has already been reported in [12].<br />
Furthermore, a slope increasing after about 50 days has<br />
been observed in a similar way to that shown in [13].<br />
These measurements will be completed to confirm this<br />
tendency. This difference observed between the two<br />
materials can be attributed to phenomena taking place at<br />
the <strong>epoxy</strong>/silica interfaces. The following mechanism<br />
can be proposed. Firstly, water molecules break the<br />
physical bounds between the silica grains and the <strong>resin</strong><br />
and form H-bounds with the polymer. Then, some water<br />
mass uptake (%)<br />
2<br />
1.8<br />
1.6<br />
1.4<br />
1.2<br />
1<br />
0.8<br />
0.6<br />
0.4<br />
0.2<br />
0<br />
Un<strong>filled</strong> samples<br />
Filled samples<br />
0 20 40 60 80<br />
Conditioning time (days)<br />
Figure 1: Weight gain in un<strong>filled</strong> () and <strong>filled</strong> ()<br />
samples as a function <strong>of</strong> conditioning time.<br />
accumulates between the two phases, part <strong>of</strong> which<br />
possibly reacts with the <strong>resin</strong>.<br />
TGA results<br />
Thermogravimetric analysis was carried out for <strong>filled</strong><br />
and not <strong>filled</strong> samples after until 70 days <strong>of</strong><br />
conditioning. The thermal behaviour <strong>of</strong> unaged sample<br />
are mentioned as “reference” in the figures. The dots on<br />
the graphics are not measurements points but are added<br />
to improve visualisation <strong>of</strong> the data.<br />
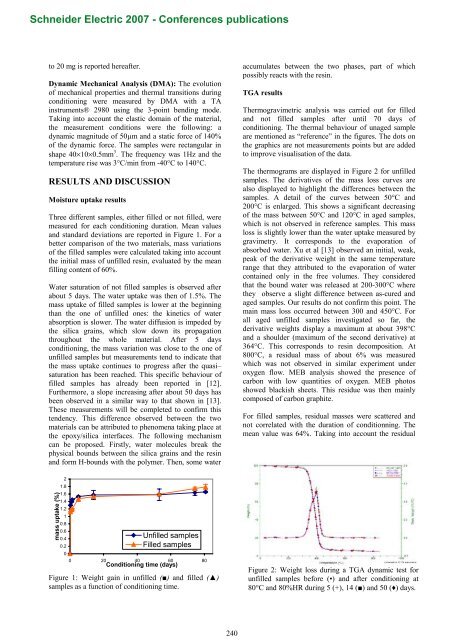
The thermograms are displayed in Figure 2 for un<strong>filled</strong><br />
samples. The derivatives <strong>of</strong> the mass loss curves are<br />
also displayed to highlight the differences between the<br />
samples. A detail <strong>of</strong> the curves between 50°C and<br />
200°C is enlarged. This shows a significant decreasing<br />
<strong>of</strong> the mass between 50°C and 120°C in aged samples,<br />
which is not observed in reference samples. This mass<br />
loss is slightly lower than the water uptake measured by<br />
gravimetry. It corresponds to the evaporation <strong>of</strong><br />
absorbed water. Xu et al [13] observed an initial, weak,<br />
peak <strong>of</strong> the derivative weight in the same temperature<br />
range that they attributed to the evaporation <strong>of</strong> water<br />
contained only in the free volumes. They considered<br />
that the bound water was released at 200-300°C where<br />
they observe a slight difference between as-cured and<br />
aged samples. Our results do not confirm this point. The<br />
main mass loss occurred between 300 and 450°C. For<br />
all aged un<strong>filled</strong> samples investigated so far, the<br />
derivative weights display a maximum at about 398°C<br />
and a shoulder (maximum <strong>of</strong> the second derivative) at<br />
364°C. This corresponds to <strong>resin</strong> decomposition. At<br />
800°C, a residual mass <strong>of</strong> about 6% was measured<br />
which was not observed in similar experiment under<br />
oxygen flow. MEB analysis showed the presence <strong>of</strong><br />
carbon with low quantities <strong>of</strong> oxygen. MEB photos<br />
showed blackish sheets. This residue was then mainly<br />
composed <strong>of</strong> carbon graphite.<br />
For <strong>filled</strong> samples, residual masses were scattered and<br />
not correlated with the duration <strong>of</strong> conditionning. The<br />
mean value was 64%. Taking into account the residual<br />
Figure 2: Weight loss during a TGA dynamic test for<br />
un<strong>filled</strong> samples before (•) and after conditioning at<br />
80°C and 80%HR during 5 (+), 14 () and 50 () days.<br />
240