Proton NMR Determination of Mg2+ and Ca2+ Concentrations Using
Proton NMR Determination of Mg2+ and Ca2+ Concentrations Using
Proton NMR Determination of Mg2+ and Ca2+ Concentrations Using

Create successful ePaper yourself
Turn your PDF publications into a flip-book with our unique Google optimized e-Paper software.
Volume 1, Issue 1, 2007<br />
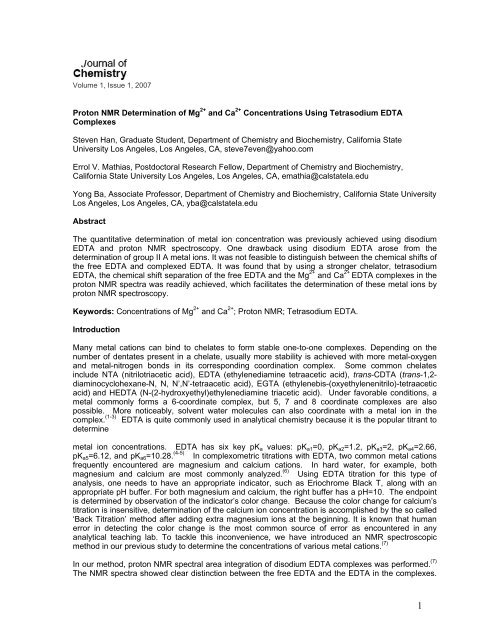
<strong>Proton</strong> <strong>NMR</strong> <strong>Determination</strong> <strong>of</strong> Mg 2+ <strong>and</strong> Ca 2+ <strong>Concentrations</strong> <strong>Using</strong> Tetrasodium EDTA<br />
Complexes<br />
Steven Han, Graduate Student, Department <strong>of</strong> Chemistry <strong>and</strong> Biochemistry, California State<br />
University Los Angeles, Los Angeles, CA, steve7even@yahoo.com<br />
Errol V. Mathias, Postdoctoral Research Fellow, Department <strong>of</strong> Chemistry <strong>and</strong> Biochemistry,<br />
California State University Los Angeles, Los Angeles, CA, emathia@calstatela.edu<br />
Yong Ba, Associate Pr<strong>of</strong>essor, Department <strong>of</strong> Chemistry <strong>and</strong> Biochemistry, California State University<br />
Los Angeles, Los Angeles, CA, yba@calstatela.edu<br />
Abstract<br />
The quantitative determination <strong>of</strong> metal ion concentration was previously achieved using disodium<br />
EDTA <strong>and</strong> proton <strong>NMR</strong> spectroscopy. One drawback using disodium EDTA arose from the<br />
determination <strong>of</strong> group II A metal ions. It was not feasible to distinguish between the chemical shifts <strong>of</strong><br />
the free EDTA <strong>and</strong> complexed EDTA. It was found that by using a stronger chelator, tetrasodium<br />
EDTA, the chemical shift separation <strong>of</strong> the free EDTA <strong>and</strong> the Mg 2+ <strong>and</strong> Ca 2+ EDTA complexes in the<br />
proton <strong>NMR</strong> spectra was readily achieved, which facilitates the determination <strong>of</strong> these metal ions by<br />
proton <strong>NMR</strong> spectroscopy.<br />
Keywords: <strong>Concentrations</strong> <strong>of</strong> Mg 2+ <strong>and</strong> Ca 2+ ; <strong>Proton</strong> <strong>NMR</strong>; Tetrasodium EDTA.<br />
Introduction<br />
Many metal cations can bind to chelates to form stable one-to-one complexes. Depending on the<br />
number <strong>of</strong> dentates present in a chelate, usually more stability is achieved with more metal-oxygen<br />
<strong>and</strong> metal-nitrogen bonds in its corresponding coordination complex. Some common chelates<br />
include NTA (nitrilotriacetic acid), EDTA (ethylenediamine tetraacetic acid), trans-CDTA (trans-1,2-<br />
diaminocyclohexane-N, N, N’,N’-tetraacetic acid), EGTA (ethylenebis-(oxyethylenenitrilo)-tetraacetic<br />
acid),<strong>and</strong> HEDTA (N-(2-hydroxyethyl)ethylenediamine triacetic acid). Under favorable conditions, a<br />
metal commonly forms a 6-coordinate complex, but 5, 7 <strong>and</strong> 8 coordinate complexes are also<br />
possible. More noticeably, solvent water molecules can also coordinate with a metal ion in the<br />
complex. (1-3) EDTA is quite commonly used in analytical chemistry because it is the popular titrant to<br />
determine<br />
metal ion concentrations. EDTA has six key pK a values: pK a1 =0, pK a2 =1.2, pK a3 =2, pK a4 =2.66,<br />
pK a5 =6.12, <strong>and</strong> pK a6 =10.28. (4-5) In complexometric titrations with EDTA, two common metal cations<br />
frequently encountered are magnesium <strong>and</strong> calcium cations. In hard water, for example, both<br />
magnesium <strong>and</strong> calcium are most commonly analyzed. (6) <strong>Using</strong> EDTA titration for this type <strong>of</strong><br />
analysis, one needs to have an appropriate indicator, such as Eriochrome Black T, along with an<br />
appropriate pH buffer. For both magnesium <strong>and</strong> calcium, the right buffer has a pH=10. The endpoint<br />
is determined by observation <strong>of</strong> the indicator’s color change. Because the color change for calcium’s<br />
titration is insensitive, determination <strong>of</strong> the calcium ion concentration is accomplished by the so called<br />
‘Back Titration’ method after adding extra magnesium ions at the beginning. It is known that human<br />
error in detecting the color change is the most common source <strong>of</strong> error as encountered in any<br />
analytical teaching lab. To tackle this inconvenience, we have introduced an <strong>NMR</strong> spectroscopic<br />
method in our previous study to determine the concentrations <strong>of</strong> various metal cations. (7)<br />
In our method, proton <strong>NMR</strong> spectral area integration <strong>of</strong> disodium EDTA complexes was performed. (7)<br />
The <strong>NMR</strong> spectra showed clear distinction between the free EDTA <strong>and</strong> the EDTA in the complexes.<br />
1
This method introduces no error due to the color sensitivity <strong>of</strong> human’s naked eyes <strong>and</strong> does not rely<br />
on indicators <strong>and</strong> their required buffer solutions. This method was effective for group IIB, IIIA, IIIB,<br />
IVA metal cations, but not feasible for group IIA metal cations. The problem arises from the<br />
indistinguishable <strong>NMR</strong> spectra <strong>of</strong> the free EDTA <strong>and</strong> the EDTA complexes due to the fast intra <strong>and</strong><br />
inter molecular exchanges. In search for a solution, a stronger chelator, such as tetrasodium EDTA,<br />
was found to be feasible. Spectral distinction was achieved due to the stronger chelating ability <strong>of</strong> the<br />
tetrasodium EDTA.<br />
Theory<br />
A st<strong>and</strong>ardized EDTA solution is used in this method. (7) The volume <strong>of</strong> the EDTA solution is fixed,<br />
<strong>and</strong> different volumes <strong>of</strong> a fixed concentration <strong>of</strong> a metal ion solution are added to the st<strong>and</strong>ardized<br />
EDTA solution. Then, proton <strong>NMR</strong> spectrum is measured for each <strong>of</strong> the mixtures. Because the <strong>NMR</strong><br />
peaks from the remaining free EDTA <strong>and</strong> the EDTA metal complex can be distinguished, we are able<br />
to use spectral area integration to find the ratio <strong>of</strong> the two components. <strong>Using</strong> this ratio, just a single<br />
mixture <strong>of</strong> the metal solution with the tetrasodium EDTA is able to determine the metal concentration,<br />
or the average value <strong>of</strong> more points can be used for a higher accuracy. However, using the following<br />
linear plotting method is better preferred. If the molarity <strong>of</strong> the st<strong>and</strong>ardized EDTA solution is denoted<br />
by M EDTA , its volume by V EDTA <strong>and</strong> the volume <strong>of</strong> the metal solution by V M , then in an equilibrium<br />
condition, it is found that:<br />
A<br />
A<br />
EDTA<br />
MEDTA<br />
⎛ 1 ⎞ VEDTAM<br />
EDTA<br />
= ⎜<br />
−1<br />
M<br />
⎟<br />
(1)<br />
⎝ M ⎠ VM<br />
where A EDTA <strong>and</strong> A MEDTA represent the <strong>NMR</strong> spectral areas <strong>of</strong> the corresponding components. The<br />
area ratio A EDTA /A MEDTA versus V EDTA M EDTA /V M is then plotted . Thus, the metal’s concentration can be<br />
obtained from the reciprocal <strong>of</strong> the slope. The theoretical intercept <strong>of</strong> this line is -1.<br />
Experimental Section<br />
Magnesium nitrate hexahydrate, calcium nitrate tetrahydrate <strong>and</strong> tetrasodium EDTA are all <strong>of</strong> ACS<br />
grade supplied by Sigma-Aldrich. All the solutions were prepared in deuterium oxide (99.8% supplied<br />
by Fisher Scientific, USA). The st<strong>and</strong>ardized EDTA concentration used was 0.0100M. The<br />
concentrations for magnesium <strong>and</strong> calcium solutions were prepared approximately to 0.01M. The<br />
volume ratios for a metal solution to the EDTA solution were prepared at 0.10, 0.12, 0.16, 0.20, 0.24,<br />
0.30, <strong>and</strong> 0.40mL with original volume <strong>of</strong> 0.40mL tetrasodium EDTA solution.<br />
All experiments were carried out using a Bruker Avance DRX 400 MHz <strong>NMR</strong> spectrometer with an<br />
inverse 5mm high resolution probe. The recycling delay was set to be 5s <strong>and</strong> 32 scans were used.<br />
The 5s recycling delay guaranteed the correct area ratios because the proton longitudinal relaxation<br />
times (T 1 ) <strong>of</strong> the EDTA <strong>and</strong> its complexes were found to be less than 1s. The HOD peak at 4.8 ppm<br />
in the solvent was used as the secondary reference for measuring the chemical shifts.<br />
Results <strong>and</strong> Discussion<br />
Figure 1 shows the proton <strong>NMR</strong> spectra <strong>of</strong> the tetrasodium EDTA solution (labeled as EDTA), the<br />
MgEDTA solution, the mixture <strong>of</strong> (0.2ml) <strong>of</strong> Mg solution in (0.4 ml) <strong>of</strong> EDTA solution (labeled as<br />
MgEDTA + EDTA), CaEDTA, <strong>and</strong> the mixture <strong>of</strong> (0.12ml) <strong>of</strong> Ca solution in (0.40ml) <strong>of</strong> EDTA solution<br />
(labeled as CaEDTA + EDTA). In the free EDTA spectrum, the two chemical shifts at 3.2 ppm <strong>and</strong><br />
2.7 ppm indicating the acetate-methylene protons <strong>and</strong> the amine-methylene protons, respectively.<br />
The MgEDTA spectrum shows an AB pattern centered at 3.3 ppm (J = 16.4 Hz) for the acetatemethylene<br />
protons <strong>and</strong> a singlet at 2.8 ppm for the amine-methylene protons. In the MgEDTA +<br />
EDTA spectrum, the corresponding free EDTA peaks shifted to 3.4 ppm <strong>and</strong> 2.9 ppm while no<br />
change in chemical shift for the MgEDTA complex was observed. It shows that the chemical shifts<br />
<strong>and</strong> line-widths changed with the ratio <strong>of</strong> Mg to EDTA. However, the spectral pattern allows us to<br />
easily distinguish between the<br />
2
Figure 1. <strong>Proton</strong> <strong>NMR</strong> spectra <strong>of</strong> a) EDTA, b) MgEDTA, c) EDTA + MgEDTA, d) CaEDTA <strong>and</strong> e)<br />
EDTA + CaEDTA.<br />
Peaks belonging to EDTA <strong>and</strong> MgEDTA. The CaEDTA spectrum also shows an AB pattern<br />
comprising <strong>of</strong> chemical shifts centered at 3.0 ppm (J = 16.1 Hz) for the acetate-methylene protons<br />
<strong>and</strong> a singlet at 2.4 ppm for the amine-methylene protons. In the CaEDTA + EDTA spectrum, the<br />
corresponding free EDTA peaks slightly shifted to 3.3 ppm <strong>and</strong> 2.8 ppm while no observable change<br />
occurred for the CaEDTA peaks.<br />
Figure 2 shows the plots <strong>of</strong> the experimental points <strong>of</strong> A EDTA /A MEDTA versus V EDTA M EDTA /V M for<br />
determining the concentrations <strong>of</strong> Mg 2+ <strong>and</strong> Ca 2+ solutions, where the squares represent those <strong>of</strong><br />
Mg 2+ <strong>and</strong> the circles represent those <strong>of</strong> Ca 2+ . The corresponding linear curve fittings result in a<br />
3
concentration <strong>of</strong> 0.0094 ± 0.0001 M for Mg 2+ <strong>and</strong> 0.0112 ± 0.0001 M for Ca 2+ . The errors were<br />
generated through the theoretical fittings.<br />
3.5<br />
3.0<br />
Mg<br />
Ca<br />
2.5<br />
A EDTA<br />
/A MEDTA<br />
2.0<br />
1.5<br />
1.0<br />
0.5<br />
0.0<br />
0.010 0.015 0.020 0.025 0.030 0.035 0.040<br />
V EDTA<br />
M EDTA<br />
/V M<br />
Figure 2. A EDTA /A MEDTA versus V EDTA M EDTA /V M for determining the concentrations <strong>of</strong> Mg 2+ <strong>and</strong> Ca 2+<br />
solutions.<br />
In an aqueous solution, tetrasodium EDTA has a stronger chelating ability to metal ions due to the<br />
two extra lone pairs <strong>of</strong> electrons present in the additional free oxygen’s anions in comparison to the<br />
disodium EDTA where the two oxygen atoms are protonated. This explains why tetrasodium EDTA is<br />
able to determine the concentrations <strong>of</strong> Mg 2+ <strong>and</strong> Ca 2+ solutions. Much like in previous studies with<br />
disodium EDTA, tetrasodium EDTA when bound to a metal cation can form an octahedral<br />
coordinated complex. The presence <strong>of</strong> an AB pattern observed for the acetate-methylene proton <strong>of</strong><br />
the metal complex is due to the fact that a fast ∆, Λ interconversion <strong>and</strong> a slow nitrogen inversion<br />
exist at room temperature. 8 The former process led to the two AB patterns (one from the acetate<br />
groups out <strong>of</strong> the N-M-N plane <strong>and</strong> one in the N-M-N plane) to be averaged to one AB pattern.<br />
Although successful for the Mg 2+ <strong>and</strong> Ca 2+ , the chelating effect <strong>of</strong> the tetrasodium EDTA is still not<br />
strong enough to determine the concentrations <strong>of</strong> the other group II A metal ions. Thus, an even<br />
stronger chelating agent is needed to do so. An ongoing study is in progress using trans-CDTA. In<br />
looking at the lig<strong>and</strong>’s backbone, there are no ∆, Λ interconversion <strong>and</strong> slow nitrogen inversion was<br />
seen at room temperature. 9,10 This gives two AB patterns observed for the acetate-methylene group<br />
<strong>of</strong> the complexes. As a result, it is easy to distinguish between the acetate-methylene protons <strong>of</strong> free<br />
CDTA <strong>and</strong> the metal-CDTA complex.<br />
References<br />
1. G. Schwarzenbach, “Complexometric Titrations”, Interscience, New York, (1957) 101.<br />
2. D. C. Harris, “Quantitative Chemical Analysis”, W. H. Freeman, New York, (1997) 307.<br />
3. R. B. Fischer, “Basic Theory <strong>and</strong> Practice <strong>of</strong> Quantative Chemical Analysis”, W. B. Saunders,<br />
Philadelphia, (1968) 415.<br />
4. L. G. Sillen, “Stability Constants <strong>of</strong> Metal-Ion Complexes”, Chemical Society, London, (1964)<br />
690.<br />
4
5. A. E. Martell, <strong>and</strong> “R. M. Smith, Critical Stability Constants, Vol. 1”, Plenum Press, New York,<br />
(1974) 204.<br />
6. M. C. Yappert, <strong>and</strong> D. B. Dupre, J. Chem. Edu., 74 (1997) 1422.<br />
7. S. Han, <strong>and</strong> Y. Ba, J. Soln. Chem., 33 (2004) 301.<br />
8. Y. Ba; S. Han, T. Su; L. Ni, A. Garcia, J. Chem. Edu. 83 (2006) 296.<br />
9. Y. Ba, R. Song, <strong>and</strong> Z. Qiu, Magn. Reson. Chem. 33 (1989) 916.<br />
10. P. Mirti, M. C. Gennaro, <strong>and</strong> C. Casalino, Inorg. Chim. Acta. 53 (1981) L257.<br />
5