Manifestations of Gastrointestinal Disease in the Child
Manifestations of Gastrointestinal Disease in the Child
Manifestations of Gastrointestinal Disease in the Child
You also want an ePaper? Increase the reach of your titles
YUMPU automatically turns print PDFs into web optimized ePapers that Google loves.
<strong>Gastro<strong>in</strong>test<strong>in</strong>al</strong> <strong>Disease</strong> <strong>in</strong> <strong>the</strong> <strong>Child</strong> 705<br />
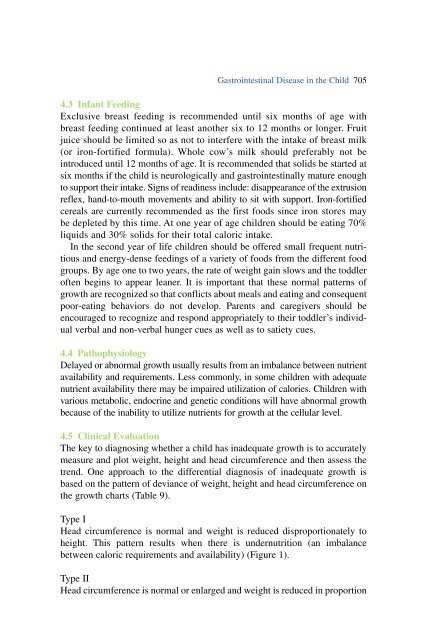
4.3 Infant Feed<strong>in</strong>g<br />
Exclusive breast feed<strong>in</strong>g is recommended until six months <strong>of</strong> age with<br />
breast feed<strong>in</strong>g cont<strong>in</strong>ued at least ano<strong>the</strong>r six to 12 months or longer. Fruit<br />
juice should be limited so as not to <strong>in</strong>terfere with <strong>the</strong> <strong>in</strong>take <strong>of</strong> breast milk<br />
(or iron-fortified formula). Whole cow’s milk should preferably not be<br />
<strong>in</strong>troduced until 12 months <strong>of</strong> age. It is recommended that solids be started at<br />
six months if <strong>the</strong> child is neurologically and gastro<strong>in</strong>test<strong>in</strong>ally mature enough<br />
to support <strong>the</strong>ir <strong>in</strong>take. Signs <strong>of</strong> read<strong>in</strong>ess <strong>in</strong>clude: disappearance <strong>of</strong> <strong>the</strong> extrusion<br />
reflex, hand-to-mouth movements and ability to sit with support. Iron-fortified<br />
cereals are currently recommended as <strong>the</strong> first foods s<strong>in</strong>ce iron stores may<br />
be depleted by this time. At one year <strong>of</strong> age children should be eat<strong>in</strong>g 70%<br />
liquids and 30% solids for <strong>the</strong>ir total caloric <strong>in</strong>take.<br />
In <strong>the</strong> second year <strong>of</strong> life children should be <strong>of</strong>fered small frequent nutritious<br />
and energy-dense feed<strong>in</strong>gs <strong>of</strong> a variety <strong>of</strong> foods from <strong>the</strong> different food<br />
groups. By age one to two years, <strong>the</strong> rate <strong>of</strong> weight ga<strong>in</strong> slows and <strong>the</strong> toddler<br />
<strong>of</strong>ten beg<strong>in</strong>s to appear leaner. It is important that <strong>the</strong>se normal patterns <strong>of</strong><br />
growth are recognized so that conflicts about meals and eat<strong>in</strong>g and consequent<br />
poor-eat<strong>in</strong>g behaviors do not develop. Parents and caregivers should be<br />
encouraged to recognize and respond appropriately to <strong>the</strong>ir toddler’s <strong>in</strong>dividual<br />
verbal and non-verbal hunger cues as well as to satiety cues.<br />
4.4 Pathophysiology<br />
Delayed or abnormal growth usually results from an imbalance between nutrient<br />
availability and requirements. Less commonly, <strong>in</strong> some children with adequate<br />
nutrient availability <strong>the</strong>re may be impaired utilization <strong>of</strong> calories. <strong>Child</strong>ren with<br />
various metabolic, endocr<strong>in</strong>e and genetic conditions will have abnormal growth<br />
because <strong>of</strong> <strong>the</strong> <strong>in</strong>ability to utilize nutrients for growth at <strong>the</strong> cellular level.<br />
4.5 Cl<strong>in</strong>ical Evaluation<br />
The key to diagnos<strong>in</strong>g whe<strong>the</strong>r a child has <strong>in</strong>adequate growth is to accurately<br />
measure and plot weight, height and head circumference and <strong>the</strong>n assess <strong>the</strong><br />
trend. One approach to <strong>the</strong> differential diagnosis <strong>of</strong> <strong>in</strong>adequate growth is<br />
based on <strong>the</strong> pattern <strong>of</strong> deviance <strong>of</strong> weight, height and head circumference on<br />
<strong>the</strong> growth charts (Table 9).<br />
Type I<br />
Head circumference is normal and weight is reduced disproportionately to<br />
height. This pattern results when <strong>the</strong>re is undernutrition (an imbalance<br />
between caloric requirements and availability) (Figure 1).<br />
Type II<br />
Head circumference is normal or enlarged and weight is reduced <strong>in</strong> proportion


