
You also want an ePaper? Increase the reach of your titles
YUMPU automatically turns print PDFs into web optimized ePapers that Google loves.
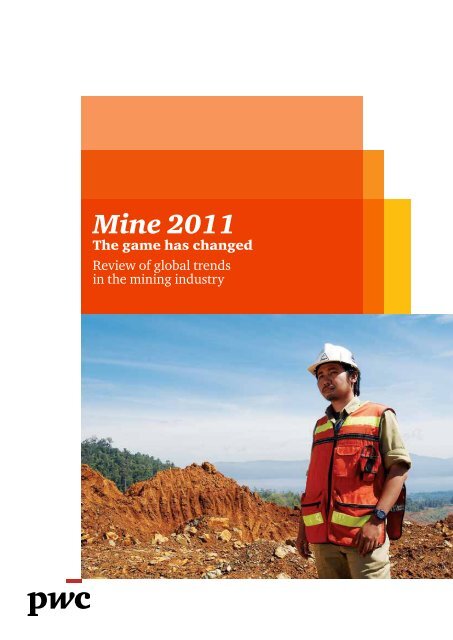
<strong>Mine</strong> <strong>2011</strong><br />
<strong>The</strong> <strong>game</strong> <strong>has</strong> <strong>changed</strong><br />
Review of global trends<br />
in the mining industry
Contents<br />
01<br />
Executive summary | page 01<br />
02<br />
Industry in perspective | page 02<br />
03<br />
A view from the top | page 10<br />
04<br />
Nine-year trends 2002-2010 | page 14<br />
06<br />
Financial review | page 20<br />
07<br />
Reserves | page 30<br />
10<br />
Glossary | page 38<br />
11<br />
Top 40 companies analysed | page 39<br />
12<br />
Explanatory notes for aggregated financial information | page 40<br />
13<br />
Key contributors to <strong>Mine</strong> | page 41<br />
14<br />
Contacting PwC | page 42<br />
15<br />
Other PwC Mining Publications | page 43<br />
Features<br />
05<br />
Vertical integration<br />
‘no-go’ or ‘gung-ho!’?<br />
Page 18<br />
08<br />
What’s mine is mine<br />
Page 34<br />
PwC
<strong>Mine</strong> <strong>2011</strong><br />
<strong>The</strong> <strong>game</strong> <strong>has</strong> <strong>changed</strong><br />
ng<br />
Featurettes<br />
02<br />
<strong>The</strong> state of Silver | page 07<br />
02<br />
Emergence of Sovereign Wealth Funds (SWFs) | page 08<br />
02<br />
Disclosing government payments | page 09<br />
04<br />
Operating costs and margins—A new base | page 17<br />
06<br />
Chilean mining clusters—Accelerating the development of<br />
world-class suppliers | page 24<br />
06<br />
<strong>The</strong> talent race is back on! | page 25<br />
06<br />
Mining company returns—risk vs. reward | page 25<br />
06<br />
<strong>The</strong> push for capital expenditures | page 27<br />
07<br />
Exploration expenditure | page 32<br />
old Medal Performance<br />
09 Global Gold Price Survey Report<br />
ember 2009<br />
09<br />
<strong>The</strong> golden rules<br />
Page 36<br />
<strong>Mine</strong>–<strong>The</strong> <strong>game</strong> <strong>has</strong> <strong>changed</strong>
<strong>Mine</strong> <strong>2011</strong><br />
<strong>The</strong> <strong>game</strong> <strong>has</strong> <strong>changed</strong><br />
01<br />
Executive summary<br />
PwC
Welcome to PwC’s eighth annual review of global trends in the mining industry—<strong>Mine</strong>. <strong>The</strong>se reviews<br />
provide a comprehensive analysis of the financial performance and position of the global mining<br />
industry as represented by the Top 40 mining companies by market capitalisation.<br />
Last year we highlighted the growing optimism in the mining<br />
industry and demand fundamentals that were driving the<br />
industry back to boom times. <strong>The</strong> 2010 results have delivered<br />
on this expectation, but it is clear that the <strong>game</strong> <strong>has</strong> <strong>changed</strong>.<br />
<strong>The</strong> mining industry <strong>has</strong> entered a new era. Demand<br />
continues to be stoked by strong growth in emerging<br />
markets. Supply is increasingly constrained, as development<br />
projects become more complex and are typically in more<br />
remote, unfamiliar territory. <strong>The</strong> cost base of the industry<br />
<strong>has</strong> permanently <strong>changed</strong> as lower grades and shortages of<br />
labour take effect.<br />
To keep up with demand, the Top 40 have announced more<br />
than $300 billion of capital programs with over $120 billion<br />
planned for <strong>2011</strong>, more than double the total 2010 spend.<br />
While not all will be completed, the sheer size and volume of<br />
the announced capital projects demonstrates an industry<br />
where fulfilling seemingly insatiable demand is the top priority.<br />
In 2010, despite tones of cautious optimism from CEOs and<br />
short-term fluctuations in the market caused by instability<br />
across many areas of the globe, the financial results for the<br />
Top 40 were spectacular:<br />
• Revenues increased 32% – breaking $400 billion for the<br />
first time<br />
• Net profit was up 156% to $110 billion<br />
• Operating cash flows grew 59%, leaving more than $100<br />
billion cash on hand at year end<br />
• Total assets approached $1 trillion<br />
• Net debt reduced to $46 billion, resulting in gearing of<br />
only 8%<br />
However, while commodity prices have increased the<br />
margins achieved in the past year are still below the highs of<br />
2006 and 2007.<br />
Investment in new supply is increasingly focused on emerging<br />
markets, and by new faces, as customers and governments<br />
enter the industry with the primary goal of securing supply.<br />
Vertical integration into mining by customers that prioritise<br />
certainty of supply over cost, will bring additional supply<br />
online from non-Tier one assets. <strong>The</strong> cost curve <strong>has</strong> shifted<br />
and commodity prices have permanently moved higher.<br />
Production for 2010 increased by 5% overall with the<br />
benefits of expansion through the global financial crisis being<br />
realised by those who continued to invest through the cycle.<br />
Emerging markets continue to change the face of the mining<br />
industry. One sign is the average Total Shareholder Return<br />
(TSR) of companies from emerging markets in the Top 40<br />
more than doubling the return from the ‘traditional’ mining<br />
countries over the past four years.<br />
Overall the market capitalisation <strong>has</strong> increased by 26%.<br />
While some have expressed concern that the market<br />
capitalisation of the industry <strong>has</strong> increased too fast and too<br />
much; the jump is attributable largely to balance sheet<br />
growth following 2010’s stellar results.<br />
<strong>The</strong> outlook expressed by industry leaders is increasingly<br />
positive, with companies taking definitive action on capital<br />
projects, as well as mergers and acquisitions. In a view from<br />
the top, the CEOs note their continuing belief in emerging<br />
markets, particularly the ongoing growth in China and the<br />
nation’s ability to achieve or exceed the 7% growth target<br />
outlined in the 12th Five Year Plan. Resource nationalism<br />
and stakeholder management occupy a higher degree of<br />
attention from the CEOs, as does the ever increasing<br />
complexity and sophistication in the industry.<br />
With mining continuing to climb up the political priority list<br />
at a time of budget deficits and changing economic and social<br />
priorities, many governments are looking at reforms to their<br />
mining codes, grappling with sustainability issues and<br />
revisiting their approach to taxation and royalties. In what’s<br />
mine is mine we are joined by Eurasia Group, which <strong>has</strong><br />
provided an overview of a number of the key drivers for these<br />
trends in light of a growing focus on corporate transparency<br />
and the interplay between corporates and society.<br />
<strong>The</strong>se are interesting times for the mining industry, with ever<br />
increasing scrutiny from governments, customers and other<br />
stakeholders. Growing demand for its products, driven by<br />
emerging markets, highlights that supply will be the most<br />
significant challenge it will face. <strong>The</strong> shift in balance is a<br />
positive one for the mining industry, but it will not be simple<br />
and will take some managing. All of this highlights that the<br />
<strong>game</strong> <strong>has</strong> <strong>changed</strong>.<br />
We trust you will find this year’s publication informative and<br />
encourage you to send us your feedback.<br />
Tim Goldsmith<br />
PwC Global Mining Leader<br />
<strong>Mine</strong> Project Leader<br />
<strong>Mine</strong>–<strong>The</strong> <strong>game</strong> <strong>has</strong> <strong>changed</strong> 1
<strong>Mine</strong> <strong>2011</strong><br />
<strong>The</strong> <strong>game</strong> <strong>has</strong> <strong>changed</strong><br />
02<br />
Industry in perspective<br />
2 PwC
Game-changing trends<br />
Over the course of the last year, global economic and<br />
political trends have <strong>changed</strong> the industry. <strong>The</strong> mining<br />
industry finds itself in a new era and there is no turning<br />
back. Emerging markets are leading bullish long-term<br />
demand projections while supply remains constrained,<br />
with challenges such as declining grade and more<br />
remote locations. <strong>The</strong> cost curve <strong>has</strong> shifted up,<br />
continuing to put pressure on the industry to maintain<br />
financial discipline. New players are emerging and the<br />
industry is receiving more attention from its many and<br />
varied stakeholders. <strong>The</strong> <strong>game</strong> <strong>has</strong> <strong>changed</strong> in the mining<br />
industry.<br />
Leading the way<br />
Mining companies have continued to outperform the<br />
overall market, as consumer sectors dependant on<br />
demand from developed economies struggled to<br />
recover. While the industry was hit hard by the global<br />
financial crisis, mining companies have led the return<br />
and gone beyond.<br />
Global indices (February 1989=1)<br />
9<br />
8<br />
7<br />
6<br />
5<br />
4<br />
3<br />
2<br />
1<br />
0<br />
1989<br />
1991<br />
1993<br />
1995<br />
1997<br />
1999<br />
2001<br />
2003<br />
2005<br />
2007<br />
2009<br />
<strong>2011</strong><br />
Dow Jones<br />
FTSE<br />
HSBC Global Mining Index<br />
Source: Bloomberg.<br />
2010 saw real tension in the market as growth<br />
rebounded, offset by a number of incidents that kept<br />
caution and risk on the agenda. Emerging countries<br />
continued to storm ahead, with demand for resources<br />
driven by strong GDP growth, including close to 10%<br />
growth in China.<br />
<strong>The</strong>se results were achieved against a backdrop of natural<br />
disasters, including the Chilean earthquake and floods in<br />
Australia. Political pressure increased with reviews of<br />
<strong>Mine</strong>–<strong>The</strong> <strong>game</strong> <strong>has</strong> <strong>changed</strong> 3
<strong>Mine</strong> <strong>2011</strong><br />
<strong>The</strong> <strong>game</strong> <strong>has</strong> <strong>changed</strong><br />
mining and taxation laws and government intervention<br />
influencing deals in a number of mining countries such as<br />
Australia, Canada and South Africa. <strong>The</strong> tension in the<br />
Middle East and continuing concern about European<br />
sovereign debt have also weighed on markets.<br />
Market cap is (almost) back<br />
Mining market capitalisation continued to rebound in<br />
2010, with many players recovering the remaining<br />
market capitalisation lost during the global financial<br />
crisis and surpassing the level seen at the end of 2007.<br />
<strong>The</strong> total year end market capitalisation of the Top 40<br />
increased by 26%, with larger gains generally achieved<br />
by the smaller companies. This made it tougher to be<br />
included in the Top 40, with the market capitalisation<br />
required to make the list increasing from $6.5 billion in<br />
2009 to $11.0 billion in 2010.<br />
Undervalued industry?<br />
<strong>The</strong> Price to Earnings (P/E) multiple for the Top 40 <strong>has</strong><br />
declined in 2010 as profit growth <strong>has</strong> well exceeded the<br />
increase in market capitalisation. We note that the 2009<br />
P/E was unusually high due to historical earnings being<br />
impacted by impairment charges and lower commodity<br />
prices, while market capitalisation is forward looking.<br />
Price/Earnings 1<br />
30<br />
25<br />
20<br />
15<br />
10<br />
5<br />
0<br />
2009<br />
2010<br />
Source: Capital IQ, Bloomberg, PwC analysis.<br />
1<br />
Price/Earnings is computed by dividing market capitalisation by profits.<br />
2009 Net assets as % of Market Capitalisation<br />
Some commentators have questioned the sustainability<br />
of the rise in the share prices of mining companies. A<br />
comparison of net assets to the market capitalisation of<br />
the Top 40 shows that net assets have remained at 35%<br />
of market capitalisation, demonstrating that market<br />
capitalisation <strong>has</strong> only increased by the profits the<br />
industry <strong>has</strong> generated and retained in 2010.<br />
Market cap<br />
Net assets<br />
35%<br />
Source: Capital IQ, Bloomberg, PwC analysis.<br />
2010 Net assets as % of Market Capitalisation<br />
35%<br />
Market cap<br />
Net assets<br />
Source: Capital IQ, Bloomberg, PwC analysis.<br />
4 PwC
<strong>The</strong> super majors step out<br />
During 2010 we saw the top three miners (BHP Billiton,<br />
Vale and Rio Tinto) step clear of the rest of the industry.<br />
<strong>The</strong> market capitalisation of third place Rio Tinto is<br />
double the size of the next largest player, China<br />
Shenhua, which declined 25% in value during 2010. At<br />
the top, BHP Billiton’s market capitalisation further<br />
strengthened, putting it clearly above the rest. Price and<br />
production increases in iron ore were major drivers of<br />
the growth by the top three.<br />
Top 3 market capitalisation ($ billion)—31 December<br />
250<br />
200<br />
150<br />
100<br />
50<br />
<strong>The</strong> drive for growth<br />
Strengthening demand for primary resources,<br />
predominantly from emerging economies, <strong>has</strong> been the<br />
big story for 2010. End user need for minerals shows no<br />
sign of letting up, especially given the targeted 7% GDP<br />
growth included in China’s recently released 12th Five<br />
Year Plan. <strong>The</strong> plan included significant infrastructure<br />
spend, such as the construction of 30,000 km of new<br />
railway line.<br />
At the same time, there is the challenge of declining<br />
extraction grades, more geographically remote and/or<br />
politically challenging regions and the increasing scale<br />
of projects required to generate economic returns.<br />
Supplying sufficient resources to meet the growing<br />
demand is a key challenge for the industry.<br />
<strong>The</strong> world continues to need raw materials and<br />
mining companies’ results show this. However, with<br />
pressures from a growing number of stakeholders on<br />
how to distribute the benefits, miners have the challenge<br />
of delivering on their social commitments and ensuring<br />
their contributions are both appropriate and properly<br />
understood.<br />
0<br />
BHP Billiton<br />
Vale<br />
Rio Tinto<br />
2005<br />
2006<br />
2007<br />
2008<br />
2009<br />
2010<br />
Source: Capital IQ.<br />
<strong>Mine</strong>–<strong>The</strong> <strong>game</strong> <strong>has</strong> <strong>changed</strong> 5
<strong>Mine</strong> <strong>2011</strong><br />
<strong>The</strong> <strong>game</strong> <strong>has</strong> <strong>changed</strong><br />
Key players<br />
<strong>The</strong> Top 40 for 2010 saw four companies rejoin the list<br />
and three first time entrants. <strong>The</strong> newly listed Coal India<br />
was the largest new entrant, following its IPO in October<br />
2010. <strong>The</strong>re <strong>has</strong> been less volatility in 2010, with only<br />
two companies more than doubling their market<br />
capitalisation and just four decreasing; the largest<br />
decrease being 32% by NMDC. Interestingly all four of<br />
the decreases were Indian or Chinese companies.<br />
Glencore <strong>has</strong> recently completed its listing in London<br />
and Hong Kong, creating many headlines in the process.<br />
<strong>The</strong> move by traders, steel companies and others to<br />
acquire mining assets makes it more challenging each<br />
year to determine who the Top 40 mining companies are.<br />
Top 10 market capitalisation ($ billion)—31 December 2010<br />
250<br />
200<br />
150<br />
100<br />
50<br />
<strong>The</strong> evolving market<br />
<strong>The</strong> challenge for mining companies in a resurgent<br />
market is to demonstrate that they made the right choices<br />
during the financial crisis and that they are able to take<br />
advantage of the upside potential of the industry. Fouryear<br />
Total Shareholder Return (TSR) data through 2010<br />
shows mostly impressive, although uneven, returns from<br />
the sector.<br />
In 2010, there were a number of players that greatly<br />
benefited from volatility in commodity markets, notably<br />
copper and silver, with companies like Silver Wheaton<br />
showing an impressive 160% one year TSR.<br />
<strong>The</strong> difference in returns between emerging market<br />
producers and those from traditional countries widened<br />
in 2010. <strong>The</strong> four year TSR for emerging market players<br />
more than doubled the returns of companies from<br />
traditional mining countries. This outperformance links<br />
to the wider economic story of faster growth in<br />
emerging markets. Even though companies from<br />
traditional mining countries hold assets around the<br />
world, emerging market players have still outperformed.<br />
Top 40 TSR 2007–2010<br />
250%<br />
200%<br />
0<br />
BHP<br />
Billiton<br />
2009<br />
2010<br />
Vale<br />
Rio<br />
Tinto<br />
China<br />
Shenhua<br />
Xstrata<br />
Anglo<br />
American<br />
Freeport-<br />
McMoRan<br />
Barrick<br />
Gold<br />
PotashCorp<br />
Coal<br />
India<br />
150%<br />
100%<br />
Source: Capital IQ.<br />
50%<br />
Reliable performance<br />
Strong demand <strong>has</strong> made 2010 a stand out year for the<br />
mining industry. Across the Top 40 there was a<br />
cumulative 32% increase in revenues, a 72% increase in<br />
adjusted EBITDA and a 156% increase in net profit.<br />
Much of the industry’s good news <strong>has</strong> been achieved<br />
through a combination of commodity price and<br />
production increases. Many analysts would argue that in<br />
2010 the Top 40 were simply in the right market at the<br />
right time. However, if it is luck, fortune <strong>has</strong> most<br />
greatly rewarded those who invested through the cycle,<br />
as the value from large capital spend by these companies<br />
is reaping rewards.<br />
Financial discipline and management of costs will be<br />
important in <strong>2011</strong>, while companies continue to drive<br />
their operations to maximise production and returns.<br />
0%<br />
Emerging market<br />
Source: Bloomberg and PwC analysis.<br />
Traditional market<br />
6 PwC
<strong>The</strong> 2010 four year TSR for the Top 10 mining<br />
companies (excluding Coal India which listed in<br />
2010) provides insight into challenging performance<br />
stories. While a four-year period is arguably a short<br />
time frame for the industry, we have seen the highs<br />
and lows of a commodity cycle, albeit a short one,<br />
during this period. <strong>The</strong> results show the importance<br />
of holding Tier one assets and being the leader in<br />
chosen markets.<br />
Top 10 TSR 2007–2010<br />
230%<br />
180%<br />
130%<br />
80%<br />
30%<br />
-20%<br />
BHP<br />
Billiton<br />
Vale<br />
Rio<br />
Tinto<br />
China<br />
Shenhua<br />
Energy<br />
Anglo<br />
American<br />
Freeport-<br />
McMoran<br />
Barrick<br />
Gold<br />
Note: Coal India figures are excluded due to lack of comparative data as it<br />
<strong>has</strong> only listed in 2010.<br />
Source: Bloomberg and PwC analysis.<br />
Xstrata<br />
PotashCorp<br />
Ag 47<br />
107.868<br />
<strong>The</strong> state of Silver<br />
Silver made headlines in<br />
2010 and Silver Wheaton<br />
had the highest one year<br />
TSR of the Top 40. Investor<br />
interest in a minor metal,<br />
commonly considered a byproduct<br />
by most miners was<br />
enormous. This reinforces<br />
the story that commodity<br />
markets have become more<br />
dynamic in the last year.<br />
<strong>The</strong> formation of silver<br />
ETFs five years ago <strong>has</strong><br />
clearly driven new interest<br />
in the market. From May<br />
2006 to early <strong>2011</strong>, the<br />
largest of these (iShares<br />
Silver Trust) moved from<br />
holding just over 600<br />
tonnes to over 11,000<br />
tonnes of silver.<br />
Much of the rise in the<br />
price of silver <strong>has</strong> been on<br />
the back of speculation,<br />
although there are some<br />
growing commercial uses,<br />
such as the importance<br />
of silver in solar cells. It is<br />
clear, however, that ETF’s<br />
are playing an increasing<br />
role in the volatile silver<br />
market—indeed at the time<br />
of writing this volatility<br />
<strong>has</strong> caused significant<br />
price fluctuations.<br />
Understanding how<br />
financial investors will act<br />
is increasingly as important<br />
as understanding demand<br />
and supply characteristics<br />
in the short-term.<br />
<strong>Mine</strong>–<strong>The</strong> <strong>game</strong> <strong>has</strong> <strong>changed</strong> 7
<strong>Mine</strong> <strong>2011</strong><br />
<strong>The</strong> <strong>game</strong> <strong>has</strong> <strong>changed</strong><br />
Emergence<br />
of Sovereign<br />
Wealth Funds<br />
(SWFs)<br />
It is not new for SWFs to invest in the<br />
resources sector. Several of the largest<br />
funds (notably from the United Arab<br />
Emirates, Norway and Kuwait) were set<br />
up with oil money, and have not been<br />
shy to invest in commodities-based<br />
businesses, although historically mostly<br />
in the oil sector. What is relatively new is<br />
that non-commodity SWFs have begun to<br />
invest heavily in mining – either through<br />
a desire to diversify their portfolios,<br />
taking advantage of the under-valued<br />
resources sector or, perhaps more<br />
importantly, to secure supply of<br />
commodities for their home markets.<br />
For some, SWFs have been both a<br />
stable source of capital, with longer<br />
investment horizons than most, and<br />
strategic partners. This can be seen<br />
in China Investment Corporation’s<br />
(“CIC”) investments in Teck Resources<br />
and Bumi Resources, both of whom sell<br />
much of their production to China.<br />
Mining companies should consider<br />
the perception of political overtones<br />
around some SWF investments.<br />
With operations becoming more<br />
geographically spread, often in<br />
locations with limited democracy and<br />
immature or evolving governance<br />
systems, SWFs may be seen to<br />
be leading the charge for foreign<br />
governments in securing resources.<br />
<strong>The</strong> <strong>game</strong> <strong>has</strong> indeed <strong>changed</strong>.<br />
Citizens of the world<br />
<strong>The</strong> mining industry <strong>has</strong> increased its focus on stakeholder<br />
management in response to growing pressure on executives.<br />
<strong>The</strong>re <strong>has</strong> been broad agreement that cooperation between<br />
the public sector, private sector and society is needed to<br />
deliver equitable returns for all.<br />
In many cases the mining sector is at the forefront of much<br />
of this debate, reflecting the attitudes of the companies and<br />
pressure from stakeholders in the regions in which they<br />
operate. More than ever, companies need to deliver benefits<br />
to local communities, which increases the onus to<br />
demonstrate leadership through transparency in reporting,<br />
corporate values and direct contributions.<br />
For example, in 2010 the International Integrated Reporting<br />
Committee (IIRC) was formed in an effort to strengthen<br />
reporting and address all stakeholder needs. We believe<br />
there is still work to be done in terms of improving<br />
reporting. Our analysis revealed significant differences<br />
between the reporting by companies from emerging and<br />
traditional markets when it came to matters such as water<br />
and energy consumption, pollution and social investment.<br />
For many companies from the emerging markets there was<br />
little or no information available, whereas for the traditional<br />
players comparability is challenging due to differences in<br />
methodologies applied and measures used.<br />
8 PwC
Disclosing government payments<br />
‘Pay your fair share’,<br />
‘Publish What You Pay’,<br />
‘Extractive Industry<br />
Transparency Initiative’,<br />
‘Dodd-Frank Tax and<br />
Royalty Disclosure Rules’ –<br />
all of these thoughts, ideas<br />
and rules embody similar<br />
concepts: do the payments<br />
mining companies make<br />
to governments contribute<br />
to sustainability, fairness<br />
and transparency?<br />
Various voluntary initiatives<br />
are now in play, followed<br />
by upcoming rules-based<br />
disclosure standards, for<br />
example, in the Dodd-<br />
Frank Act in the US that<br />
was enacted in July 2010.<br />
We have heard from<br />
mining industry leaders<br />
that gathering this data<br />
is difficult.<br />
In what format should the<br />
data be disclosed?<br />
Will this data be<br />
comparable amongst<br />
mining companies and<br />
between countries?<br />
Mining company leaders<br />
face a long road to balance<br />
the consistency and<br />
data integrity aspects<br />
with fair and accurate<br />
disclosures, to accomplish<br />
the transparency that<br />
stakeholders are requesting.<br />
As governments continue to<br />
implement active changes<br />
to laws surrounding<br />
taxation, royalties and<br />
disclosures, mining<br />
companies should continue<br />
to consider political<br />
environments when making<br />
investment decisions. We<br />
expect continuing focus<br />
and discussion to come<br />
in this area in the near<br />
term as mining companies<br />
gather and report, in<br />
varying forms, the data<br />
that stakeholders demand.<br />
<strong>Mine</strong>–<strong>The</strong> <strong>game</strong> <strong>has</strong> <strong>changed</strong> 9
<strong>Mine</strong> <strong>2011</strong><br />
<strong>The</strong> <strong>game</strong> <strong>has</strong> <strong>changed</strong><br />
03<br />
A view from the top<br />
10 PwC
As in prior years, we have discussed the future<br />
of the mining industry with CEOs of a number<br />
of the Top 40 companies. This article<br />
summarises those views.<br />
First and foremost, the CEOs hold a higher degree of<br />
confidence in the future than we have seen in the last<br />
few years. It is not only the CEOs’ words which show<br />
this, but also their willingness to commit substantial<br />
capital to fund the expansion of major mineral regions.<br />
We’ve also seen <strong>2011</strong> start in an active merger and<br />
acquisition environment, and whilst mega deals are not<br />
yet coming through, most other types of transactions are<br />
common place.<br />
<strong>The</strong> CEOs continue to believe in the emerging markets story<br />
and particularly the ongoing growth in China – 30 years<br />
of achieving its targets and Five Year Plans <strong>has</strong> convinced<br />
the miners that the likelihood of the 12th Five Year Plan<br />
being successfully achieved is high. <strong>The</strong>y point to the 7%<br />
growth target as being the floor not the ceiling and<br />
support this with results from recent history. By any<br />
measure, adding this level of supply year in year out is both<br />
a significant challenge and opportunity for the industry.<br />
Most point to China as the short-term driver of the<br />
industry; at the same time, they talk of the other rapidly<br />
growing economies such as India, Indonesia and Brazil<br />
contributing to increased mineral demand. Other positive<br />
macro-economic developments include the recovering US<br />
economy, which remains a major mineral consumer, and<br />
the demand generated by the rebuilding of part of Japan.<br />
While confidence in the future of the global economy<br />
<strong>has</strong> grown, risk remains. Growth in Europe remains<br />
sluggish and sovereign debt issues do not seem to be<br />
fully flushed through the system. In addition, the<br />
political unrest moving through the Middle East and the<br />
impact of the earthquake and tsunami in Japan are<br />
examples of black swan events to which CEOs have had<br />
to respond. <strong>The</strong>y are becoming accustomed to expecting<br />
the unexpected and have focussed on increasing<br />
organisational flexibility to be able to respond more<br />
quickly to the volatility generated by such events.<br />
As the mining industry is a long-term <strong>game</strong>, CEOs see<br />
their role as looking through the short-term blips that<br />
may occur and planning for the long-term. <strong>The</strong>re is a<br />
consistent view that commodity demand in the longterm<br />
will be strong and the CEOs want to position their<br />
companies to benefit.<br />
While the majors will always be looking to acquire<br />
assets, the view of the CEOs we spoke to was that<br />
<strong>Mine</strong>–<strong>The</strong> <strong>game</strong> <strong>has</strong> <strong>changed</strong> 11
<strong>Mine</strong> <strong>2011</strong><br />
<strong>The</strong> <strong>game</strong> <strong>has</strong> <strong>changed</strong><br />
building was better than buying at the current time. In<br />
fact, if you take that one step further, expanding rather<br />
than building is seen as the most cost effective and easiest<br />
way to grow. Indeed, while many lament the lack of new<br />
greenfield projects throughout the industry, they are also<br />
relatively cautious in incurring major expenditures on<br />
early stage exploration, relying instead on the junior<br />
sector which <strong>has</strong> historically been more effective on a<br />
pound for pound basis. This could be a dangerous<br />
approach and could lead to major shortages of minerals in<br />
years to come if the junior sector loses its current support.<br />
Building new mines and expanding existing mines is not<br />
getting any easier. Cost inflation, lead times and skill<br />
shortages are increasing challenges to all industry players<br />
and no-one is immune. Whilst geography <strong>has</strong> a major<br />
impact on how short these essentials may be, there is<br />
increasing empirical evidence that stretched boom towns,<br />
such as Perth in Western Australia, are more common<br />
than they were only six months ago. <strong>The</strong> tighter these<br />
towns become and the less available the resources, the<br />
less likely that supply will come to market at the time that<br />
plans might currently suggest. <strong>The</strong> CEOs see that they<br />
have a real challenge in this area, but also note that while<br />
slippages and cost increases occur (often in tandem), they<br />
also lead to stronger commodity prices as supply struggles<br />
to keep up with ongoing increases in demand.<br />
Given so many challenges in building and operating<br />
mines, we are seeing innovative initiatives by miners,<br />
particularly pushing technology further to the forefront of<br />
the industry. While peopleless mines appear a realistic<br />
goal, it is difficult to see the construction of new mines<br />
reaching the same point anytime soon.<br />
CEOs are faced with a continuing challenge of properly<br />
managing existing talent and securing the right talent for<br />
successful future projects around the globe and notably in<br />
emerging markets. CEOs believe the talent management<br />
process must continue to evolve to keep up with the<br />
unique industry challenges surrounding location of mines<br />
and type of workforce.<br />
In the intervening 12 months since we last undertook<br />
these interviews, the greatest change to the thoughts of<br />
the CEOs is around resource nationalism. Last year this<br />
was an emerging issue, spearheaded by the Australian<br />
Government’s announcement of a proposed Resource<br />
Super Profits Tax. Whilst resource nationalism remains an<br />
ill-defined term, the industry is seeing varied, but regular,<br />
occurrences which provide the CEOs with much food for<br />
thought – for example, in the last 12 months governments<br />
in Australia, Brazil, Canada, Chile, DRC, Guinea, South<br />
Africa and Zimbabwe, to name just a few, have all taken<br />
action in different ways and others have openly discussed<br />
thoughts of doing the same.<br />
<strong>The</strong> challenges facing CEOs seem more diverse and<br />
plentiful in a booming mining industry and certainly none<br />
report the last year as being easy, or expect the future to<br />
get any easier. All stakeholders need careful consideration<br />
and relationships need to be forged ever deeper. One<br />
stakeholder that some seem to be taking for granted is the<br />
customer. Clearly, in a supply constrained world, the<br />
miner <strong>has</strong> the upper–hand and the customer <strong>has</strong> to take<br />
what it can. Many of the customers are not happy with<br />
this arrangement, particularly in bulk minerals as they<br />
sense their sector is far more fractured than the mining<br />
industry and they are unable to pass increased raw<br />
materials prices on to their own customers.<br />
Indeed these same bulk mineral customers appear to be<br />
making their move, increasingly buying undeveloped tier<br />
two and three assets. <strong>The</strong> dash to secure resource is on,<br />
and India and China are both up to their necks in it. <strong>The</strong><br />
CEOs are acutely aware of these developments and<br />
recognise that this will ultimately lead to greater supply.<br />
However, as many of these assets are more marginal than<br />
the current crop owned and operated by the majors, they<br />
perceive that much of this activity will push the industry<br />
cost curve much higher, which will help underwrite<br />
higher long-term commodity prices.<br />
<strong>The</strong> final thought is that funding is not the same key issue<br />
it was a year ago – an incredible statement given where<br />
things were so recently. Cash flows are plentiful.<br />
In closing, the CEOs are confident of the future but expect<br />
volatility. <strong>The</strong>y too believe that the <strong>game</strong> <strong>has</strong> <strong>changed</strong>.<br />
While specific commodities have different outlooks,<br />
almost all are seen as positive. CEOs know that all<br />
stakeholders want their share – record profits and cash<br />
flow may be great to offer up to investors; however, they<br />
do not pacify a government wanting to address a budget<br />
deficit or customers struggling to pass on costs to end<br />
users. Last year we raised the entrance of diplomacy as a<br />
pre-requisite skill of the modern mining CEO. In <strong>2011</strong> the<br />
ability to navigate competing stakeholder demands could<br />
well be the differentiating factor in the industry.<br />
12 PwC
<strong>Mine</strong>–<strong>The</strong> <strong>game</strong> <strong>has</strong> <strong>changed</strong> 13
<strong>Mine</strong> <strong>2011</strong><br />
<strong>The</strong> <strong>game</strong> <strong>has</strong> <strong>changed</strong><br />
04<br />
Nine-year trends 2002–2010<br />
14 PwC
<strong>The</strong> information included below differs from the rest of our analysis as it includes the aggregated<br />
results of the companies as reported in <strong>Mine</strong> in each of the respective years disclosed. As such, the 2009<br />
column presented below differs from that included in the Financial Review section as it relates to the<br />
40 companies that were included in our previous <strong>Mine</strong> publication.<br />
$ billion 2010 2009 2008 2007 2006 2005 2004 2003 2002<br />
Aggregated income statement<br />
Revenue 435 325 349 312 249 222 184 110 93<br />
Operating expenses 246 217 208 176 141 141 129 81 72<br />
Adjusted EBITDA 189 108 141 136 108 81 55 29 21<br />
Amortisation, depreciation and impairment 34 31 57 19 12 16 15 10 9<br />
PBIT 155 77 84 117 96 65 40 19 12<br />
Net interest cost 7 6 6 5 3 4 3 3 4<br />
PBT 148 71 78 112 93 61 37 16 8<br />
Income tax expense 38 22 21 32 27 16 9 4 2<br />
Net profit 110 49 57 80 66 45 28 12 6<br />
Increase/(decrease) in revenue 34% (7%) 12% 25% 12% 21% 67% 18% -<br />
Increase/(decrease) in adjusted EBITDA 75% (23%) 4% 26% 33% 47% 90% 38% -<br />
Year on year increase/(decrease) in net profit 124% (14%) (29%) 21% 47% 61% 133% 100% -<br />
Adjusted EBITDA margin 43% 33% 40% 44% 43% 36% 30% 26% 23%<br />
Net profit margin 25% 15% 16% 26% 27% 20% 15% 11% 6%<br />
Aggregated cash flow statement<br />
Operating activities 137 83 104 95 77 58 41 22 -<br />
Investing activities (79) (74) (102) (126) (67) (38) (23) (20) -<br />
Financing activities (35) 10 14 36 4 (11) (10) 1 -<br />
Aggregated balance sheet<br />
Property, plant and equipment 511 467 402 371 262 224 196 140 116<br />
Other assets 432 334 274 284 192 148 120 83 72<br />
Total assets 943 801 676 655 454 372 316 223 188<br />
Total liabilities 387 354 339 329 217 178 151 114 101<br />
Total equity 556 447 337 326 237 194 165 109 87<br />
Return on equity 22% 13% 17% 28% 31% 25% 20% 12% 7%<br />
Income statement – Revenue smashes through<br />
$400 billion<br />
• At $435 billion, revenue exceeded the $400 billion<br />
barrier to reach the highest level ever reported, a<br />
34% increase over 2009. This <strong>has</strong> been driven by<br />
increases in prices in major commodities and a return<br />
to growth in production, illustrating the mining<br />
industry’s come-back since the global financial crisis.<br />
• Consistent with revenue, adjusted EBITDA <strong>has</strong> also<br />
hit its highest level. At 43% the 2010 adjusted<br />
EBITDA margin is in-line with 2006 and 2007<br />
results as relative increases in operating expenses<br />
have offset the rise in revenue.<br />
• Despite increases in the scale of the Top 40, net<br />
interest cost <strong>has</strong> remained relatively flat as a result<br />
of falling interest rates, coupled with more interest<br />
earning cash reserves and less interest bearing debt<br />
on company balance sheets.<br />
• Net profit <strong>has</strong> increased by 124% compared to 2009<br />
to surpass $100 billion for the first time. However,<br />
similar to adjusted EBITDA margins, the 2010 net<br />
profit margin of 25% is slightly lower than the net<br />
profit margin achieved in 2007 and the record 2006<br />
net profit margin.<br />
<strong>Mine</strong>–<strong>The</strong> <strong>game</strong> <strong>has</strong> <strong>changed</strong> 15
<strong>Mine</strong> <strong>2011</strong><br />
<strong>The</strong> <strong>game</strong> <strong>has</strong> <strong>changed</strong><br />
• Adjusted EBITDA <strong>has</strong> steadily increased over the last<br />
nine years, except in 2008 and 2009 during the<br />
global financial crisis. <strong>The</strong> table below shows<br />
adjusted EBITDA for the last nine years, including a<br />
trend line of what adjusted EBITDA could have been<br />
if the longer-term trend continued during the crisis.<br />
Operating costs and<br />
margins – a new base<br />
This shows that the 2010 result is a return to the<br />
historical trend, rather than an outlier result.<br />
2002–2010 Adjusted EBITDA ($ billion)<br />
200%<br />
180%<br />
160%<br />
140%<br />
120%<br />
100%<br />
80%<br />
60%<br />
40%<br />
20%<br />
0%<br />
2002<br />
2003<br />
Source: PwC analysis.<br />
2004<br />
2005<br />
2006<br />
2007<br />
2008<br />
Return on equity and return on capital<br />
employed lag despite record profits<br />
Year ROE ROCE<br />
2010 22% 18%<br />
2009 13% 9%<br />
2008 17% 13%<br />
2007 28% 22%<br />
2006 31% 23%<br />
2005 25% 18%<br />
2004 20% 14%<br />
2003 12% 8%<br />
2002 7% 5%<br />
2009<br />
2010<br />
Despite record revenue and net profit, margins<br />
continue to be impacted by increased<br />
operating expenses. <strong>The</strong> 2010 adjusted<br />
EBITDA margin is no higher than in the boom<br />
years of 2006 and 2007, despite record<br />
commodity prices exceeding those previously<br />
achieved. <strong>The</strong>se results suggest that there <strong>has</strong><br />
been a fundamental shift in the cost base of the<br />
industry. Costs have remained high through<br />
the financial crisis and with continuing<br />
pressure on the price of key inputs such as<br />
energy and reagents, coupled with ever<br />
increasing capital construction costs, there<br />
appears to be no let-up in sight for the<br />
industry. Labour continues to be in high<br />
demand. With many newly announced major<br />
growth projects commencing and skill<br />
shortages in a number of locations, the cost of<br />
hiring and retaining workers is more likely to<br />
increase over time.<br />
Ongoing weakness in the US dollar <strong>has</strong> meant<br />
that for the first time commodity currencies<br />
have higher relative strength than the US<br />
dollar, also impacting margins for many.<br />
Industry valuations often use historical<br />
average commodity prices as long-term<br />
assumptions, but given the shift in the<br />
industry’s cost base, commodity prices cannot<br />
return to historical averages. We have seen this<br />
<strong>game</strong> change.<br />
ROE <strong>has</strong> increased since 2009, but is still well off the<br />
2006 peak of 31% and is not significantly higher than<br />
the 2002-2009 average of 19%. Net profit in 2010<br />
reached above $100 billion for the first time and the<br />
majority of these historical profits have been retained by<br />
companies. This, combined with relatively expensive<br />
capital raisings over recent years, <strong>has</strong> kept equity<br />
invested in the industry relatively high, pushing down<br />
returns. Determining the most appropriate and efficient<br />
capital structure remains a challenge for the industry.<br />
16 PwC
Cash flows – Operating cash flow returns, but<br />
investing lags<br />
• At $137 billion for 2010, operating cash flows increased<br />
to their highest level, a 65% rise over 2009 and only the<br />
second time they have exceeded $100 billion.<br />
• Investing cash flows increased by 7% but were still<br />
well below the $126 billion invested in 2007. In 2010<br />
for every dollar earned in revenue only 18 cents were<br />
invested, significantly lower than the 40 cents invested<br />
per dollar of revenue in 2007 and the 2003-2009<br />
average of 26 cents per dollar. In 2010 Investing cash<br />
flows were only 58% of operating cash flows,<br />
compared to an average of 94% for 2003-2009.<br />
• With recently announced capital projects, we expect<br />
investing cash flows to increase again in the coming<br />
years. However, companies struggle to meet their<br />
capex targets as complexities often delay project<br />
timetables.<br />
• Financing cash flow was a net outflow for the first time<br />
since 2005, with a net of $35 billion being repaid to<br />
lenders or returned to shareholders.<br />
Balance sheet – Assets approach $1 trillion<br />
• Property, plant and equipment continued the upward<br />
trend experienced every year since 2002, as capital<br />
expenditures and acquisitions exceeded depreciation<br />
and disposals.<br />
majority of which were Australian and Canadian<br />
mid-tier miners. Amazingly there were no South<br />
African or UK based miners acquired. Notable names<br />
include:<br />
o Australia: Lihir Gold, WMC Resources, and Zinifex<br />
o Canada: Falconbridge, Glamis Gold, Inco,<br />
Noranda and Placer Dome<br />
o United States: Phelps Dodge<br />
• Where change <strong>has</strong> occurred, there <strong>has</strong> been a shift in<br />
the countries represented, with a higher portion of<br />
emerging market companies making the Top 40 in<br />
recent years. This increased to 18 in 2010. This move<br />
reflects the continued shift in the players and power<br />
base of the mining industry.<br />
Composition of Top 40<br />
100%<br />
80%<br />
60%<br />
40%<br />
20%<br />
• <strong>The</strong> increase in property, plant and equipment is well<br />
below the 2002-2009 average of 23% and is the<br />
second smallest year-on-year increase in the history of<br />
<strong>Mine</strong>; only slightly higher than the 2008 increase of<br />
8%, which was largely the result of significant<br />
impairment charges in that year.<br />
0%<br />
2004<br />
2005<br />
Emerging markets<br />
Traditional markets<br />
Source: PwC analysis.<br />
2006<br />
2007<br />
2008<br />
2009<br />
2010<br />
<strong>2011</strong><br />
• Total assets increased to close to $1 trillion, largely<br />
driven by record levels of cash and property, plant and<br />
equipment on company balance sheets.<br />
• <strong>The</strong> 24% increase in equity in 2010 was largely in line<br />
with the average increase of 27% from 2002-2009, with<br />
the bulk coming from profits, rather than capital raising.<br />
Top 40 analysis – Three companies debut in 2010<br />
We have examined the composition of the companies<br />
included in each of the eight publications of <strong>Mine</strong>.<br />
Looking back, there <strong>has</strong> been remarkable stability in the<br />
composition of the Top 40. We can see:<br />
• 17 companies have been included in every edition<br />
of <strong>Mine</strong>, with a further 20 being included in four or<br />
more editions.<br />
• <strong>The</strong> trend <strong>has</strong> partially been the result of more public<br />
information being made available for companies from<br />
emerging markets as a result of the public listing of<br />
stakes in a number of state-owned enterprises. It is<br />
important to note that there are a number of<br />
additional Chinese and Russian companies that would<br />
otherwise have been included in the Top 40 each year if<br />
sufficient information was available at the time of<br />
publication.<br />
• In Vertical Integration – ‘no-go’ or ‘gung-ho!’ we discuss<br />
the increased level of integration in the industry. We<br />
expect to see a few new names among the top mining<br />
companies in coming years.<br />
• Over the years a number of companies have dropped<br />
off as a result of mergers and acquisitions, the<br />
<strong>Mine</strong>–<strong>The</strong> <strong>game</strong> <strong>has</strong> <strong>changed</strong> 17
05 Vertical<br />
integration<br />
‘no-go’ or ‘gung-ho!’?<br />
Over the last three decades, as Wall<br />
Street and management theorists<br />
encouraged companies to focus<br />
on their core competencies, the<br />
mining and metals industry became<br />
less vertically integrated. Recent<br />
events however have indicated a<br />
growing trend towards the vertical<br />
integration of yesteryear. Vertical<br />
integration strategies vary, but recent<br />
trends show that it <strong>has</strong> been largely<br />
upstream as metals companies and<br />
end-users seek to add mining assets,<br />
and miners add infrastructure,<br />
reintroducing the question of ‘what<br />
makes a mining company’?<br />
Vertical integration trends have<br />
been shaped by an increase in global<br />
demand for metals and the growing<br />
importance of securing stable supplies<br />
of increasingly scarce resources.<br />
Metals companies have looked to<br />
vertically integrate primarily to<br />
secure alternative sources of raw<br />
material supply to facilitate their<br />
own continued operation. Additional<br />
objectives often include gaining<br />
greater control over the price of<br />
production inputs and to provide<br />
future growth prospects.<br />
Integration exposes companies to new<br />
dimensions of market risk in different<br />
sectors of the industry and potentially<br />
decreases flexibility to react to<br />
changing market conditions. It soaks<br />
up significant capital, which could<br />
otherwise be deployed on growing<br />
the existing business. Integrating<br />
often requires M&A as organic<br />
vertical growth is often impossible or<br />
impractical and deals can be risky and<br />
often do not generate the expected<br />
value. Vertically integrating can<br />
stretch management into new areas of<br />
focus and could simply add too much<br />
complexity to an organisation.<br />
Despite these risks, the mining<br />
and metals industry is vertically<br />
integrating, albeit in different ways<br />
18 PwC
and for different reasons. <strong>The</strong> steel<br />
industry <strong>has</strong> seen considerable<br />
vertical integration as producers drive<br />
for greater self-sufficiency of raw<br />
materials, either due to increasingly<br />
tight supply of inputs or increasing<br />
frustration with the major miners’<br />
ability to dictate price and pricing<br />
terms. This strategy seeks to reduce<br />
the market power of the major iron<br />
ore producers through decreased<br />
reliance on third-party suppliers.<br />
An example of this strategy is<br />
ArcelorMittal, which is significantly<br />
increasing its in-house iron ore and<br />
coal business as part of a strategy to<br />
double iron ore production to 100<br />
million tonnes per annum. Many<br />
other major steel companies have<br />
publicly stated their intentions to<br />
increase iron-ore and coking coal selfsufficiency;<br />
• Taiwan’s China Steel plans to<br />
increase iron ore self-sufficiency<br />
from 2% to 30% by 2015;<br />
• POSCO targets 50% raw material<br />
self sufficiency by 2014; and<br />
• Tata Steel plans to reach 100%<br />
iron ore and 50% coking coal selfsufficiency.<br />
While these stated desires are clear,<br />
only time will tell whether these<br />
companies, and others, are able to<br />
successfully and profitably deliver<br />
these strategies.<br />
Recent vertical integration <strong>has</strong><br />
also included end-users of mining<br />
products acquiring upstream assets.<br />
Many power producers, including<br />
Huadian of China and Tata Power of<br />
India, have made major coal mining<br />
acquisitions. Amongst zinc smelters,<br />
Nyrstar <strong>has</strong> been active in acquiring<br />
mining assets, including their <strong>2011</strong><br />
deal for Canada’s Farallon Mining,<br />
which increased its self-supplied<br />
zinc concentrate usage to 31%. This<br />
trend will likely also apply to traders<br />
as they increasingly look to build up<br />
upstream holdings, seen by Glencore<br />
in their run up to a potential IPO and<br />
China Minmetals in their acquisition<br />
of assets from Oz <strong>Mine</strong>rals and recent<br />
attempt for Equinox.<br />
We are beginning to see companies<br />
also look at other ways of achieving<br />
their integration objectives, such as<br />
combining strategic investment and<br />
off-take or partnership agreements<br />
to lower the risk associated with<br />
integration, but still reap similar<br />
benefits. A number of companies<br />
have adopted this approach, taking<br />
minority stakes or providing initial<br />
funding to major projects. Examples<br />
include China Railway’s 12.5%<br />
equity stake in African <strong>Mine</strong>rals with<br />
a 20 year off-take agreement and<br />
JFE Steel’s 20% investment in the<br />
Byerwen Coal project with a longterm<br />
off-take agreement.<br />
In contrast to other miners, Vale <strong>has</strong><br />
taken a 27% stake in the Brazilian<br />
steel production assets owned by<br />
ThyssenKrupp CSA. This equity<br />
investment is combined with an<br />
exclusive iron ore supply agreement,<br />
solidifying a domestic buyer for Vale’s<br />
Brazilian iron ore.<br />
Although vertical integration<br />
strategies vary amongst the miners,<br />
generally there is no desire to<br />
increase their presence in metals<br />
manufacturing or sales. Where<br />
integration <strong>has</strong> occurred, the focus<br />
is primarily on infrastructure assets,<br />
largely for the same motivation as<br />
described above – ensuring security<br />
of access to key production and<br />
transport needs. Vale, for example,<br />
is adding a number of bulk iron ore<br />
ships to their in-house fleet.<br />
Overall, trends in vertical integration<br />
reflect the changing nature of the<br />
industry, particularly as customers<br />
are becoming competitors to their<br />
current suppliers. For companies<br />
moving upstream in the quest for selfsufficiency,<br />
the mines being acquired<br />
are generally not Tier one assets and<br />
are usually in the development p<strong>has</strong>e.<br />
With the priority for new entrants<br />
often being security of supply, lower<br />
tier assets coming on-stream will shift<br />
the industry’s cost-curve.<br />
While traditional mining houses<br />
are not expected to vertically<br />
integrate downstream, many will<br />
likely continue to integrate into<br />
infrastructure. In metals, tightening<br />
supplies for raw materials and<br />
increasingly variable commodity<br />
prices will continue to drive<br />
producers upstream either through<br />
direct ownership and control or<br />
through minority ownership and<br />
strategic off-take agreements. In a<br />
supply constrained world, for many<br />
companies there is no alternative.<br />
What remains to be seen is whether<br />
vertical integration can deliver<br />
sustainable value and how the<br />
balance between miners, metals<br />
companies, and the markets they<br />
serve will change.<br />
<strong>Mine</strong>–<strong>The</strong> <strong>game</strong> <strong>has</strong> <strong>changed</strong> 19
<strong>Mine</strong> <strong>2011</strong><br />
<strong>The</strong> <strong>game</strong> <strong>has</strong> <strong>changed</strong><br />
06<br />
Financial review<br />
20 PwC
Income statement<br />
2010<br />
$ billion<br />
2009<br />
$ billion<br />
Change<br />
%<br />
Revenue 435 330 32<br />
Operating expenses (246) (220) 12<br />
Adjusted EBITDA* 189 110 72<br />
Impairment charges (1) (12) (92)<br />
Depreciation & amortisation (33) (27) 22<br />
PBIT 155 71 118<br />
Net interest expense (7) (5) 40<br />
Income tax expense (38) (23) 65<br />
Net profit 110 43 156<br />
* EBITDA adjusted to exclude impairment charges.<br />
Key ratios<br />
2010<br />
%<br />
2009<br />
%<br />
Adjusted EBITDA margin 43 33<br />
Net profit margin 25 13<br />
Return on capital employed 18 9<br />
Return on equity 22 11<br />
Profits rising<br />
<strong>The</strong> Top 40 had an outstanding year, with net profit increasing 156% from<br />
2009 to break the $100 billion barrier. High commodity prices and increased<br />
production explain most of this strong performance as operating margins<br />
flowed through to the bottom line. <strong>The</strong> key ratios demonstrate a well rounded<br />
performance by the Top 40, with return on capital employed and return on<br />
equity doubling in percentage terms from 2009. However as noted in Nine Year<br />
Trends, the returns remain below the highs of 2006 and 2007.<br />
Revenue<br />
Revenue increased 32% from 2009, exceeding the $400 billion mark to reach<br />
its highest level since we started our analysis. <strong>The</strong> jump was attributable to<br />
both record high commodity prices coupled with an overall 5% rise in<br />
production.<br />
Revenue ($ billion) Adjusted EBITDA margin (%)<br />
2010 2009 2010 2009<br />
Rio Tinto 57 42 44 32<br />
BHP Billiton 53 51 45 39<br />
Vale 46 24 59 48<br />
<strong>Mine</strong>–<strong>The</strong> <strong>game</strong> <strong>has</strong> <strong>changed</strong> 21
<strong>Mine</strong> <strong>2011</strong><br />
<strong>The</strong> <strong>game</strong> <strong>has</strong> <strong>changed</strong><br />
<strong>The</strong> top three companies by revenue represent 36% of<br />
total revenues, largely un<strong>changed</strong> from the prior year,<br />
reflecting the strong performance across the board. <strong>The</strong><br />
mix however <strong>has</strong> <strong>changed</strong> significantly, with Rio Tinto<br />
taking top spot from BHP Billiton this year and Vale nearly<br />
to doubling its revenue. Vale’s strong performance in 2010<br />
is primarily due to a return to full production in 2010<br />
following the strength in the iron ore market. Rio Tinto<br />
and Vale together accounted for 35% of the total increase<br />
in revenues from the prior year.<br />
However, it is worth noting that BHP Billiton’s revenue<br />
would have topped Rio Tinto’s had its year end been 31<br />
December rather than 30 June, as BHP Billiton had a $9.6<br />
billion (39%) increase in half year revenues in the second<br />
half of 2010.<br />
Commodity prices<br />
Higher commodity prices contributed to the improved<br />
margins and profits in 2010. <strong>The</strong> average price of all five<br />
commodities noted below increased from the prior years,<br />
with percentage increases ranging from 26% to 111%.<br />
Copper, gold, coal and iron ore reached new average highs<br />
in the year, while aluminium could not surpass pre-global<br />
financial crisis levels. <strong>The</strong> increasing trend continued with<br />
year end prices higher than annual averages.<br />
Average Iron Ore <strong>The</strong>rmal<br />
Coal<br />
2003<br />
average<br />
2004<br />
average<br />
2005<br />
average<br />
2006<br />
average<br />
2007<br />
average<br />
2008<br />
average<br />
2009<br />
average<br />
2010<br />
average<br />
2010<br />
close<br />
Copper Gold Aluminium<br />
$/dmtu $/tonne $/tonne $/ounce $/tonne<br />
30 27 1,789 364 1,431<br />
36 44 2,868 410 1,717<br />
62 53 3,684 445 1,900<br />
73 52 6,725 604 2,568<br />
80 56 7,124 697 2,638<br />
145 125 6,938 872 2,567<br />
97 70 5,178 974 1,671<br />
205 98 7,558 1,227 2,200<br />
210 120 9,600 1,421 2,470<br />
Note: Iron ore prices used above are the Asian Basin price for<br />
Hamersley fines sourced from the AME Group Iron Ore Outlook. <strong>The</strong><br />
thermal coal price is the typical price for Hunter Valley settlements,<br />
basis 6,700 kcal/kg GAD or 6,322 kcal/kg GAR, sourced from the<br />
AME Group <strong>The</strong>rmal Coal Outlook.<br />
Commodity prices (2003=1)<br />
8<br />
7<br />
6<br />
5<br />
4<br />
3<br />
2<br />
1<br />
0<br />
2003<br />
avg<br />
2004<br />
avg<br />
2005<br />
avg<br />
Iron ore US¢/dmtu<br />
Copper $/tonne<br />
<strong>The</strong>rmal coal $/tonne<br />
2006<br />
avg<br />
Source: Bloomberg, AME Outlooks.<br />
2007<br />
avg<br />
2008<br />
avg<br />
Gold $/ounce<br />
Aluminium $/tonne<br />
2009<br />
avg<br />
2010<br />
avg<br />
2010<br />
close<br />
Iron Ore<br />
Iron ore turned in record prices with an increase of 111%<br />
in the 2010 average price as demand for steel rebounded,<br />
tightening the market for iron ore. Iron ore prices showed<br />
volatility in mid 2010, but generally trended upwards<br />
throughout the year. With record prices and more contracts<br />
moving towards shorter-term pricing, it is no surprise that<br />
iron ore <strong>has</strong> received so much recent attention.<br />
Copper<br />
<strong>The</strong> copper price reached record levels with the 2010 yearend<br />
spot price reaching $9,600 per tonne and the average<br />
price up by 46%. This was influenced by continued strong<br />
demand for copper, led by China and supply constraints<br />
due to a combination of labour strikes, notably in Chile<br />
and Peru, mechanical failures and grade diminution.<br />
<strong>The</strong> copper price continued its upward trend in the first<br />
quarter of <strong>2011</strong>, driven largely by positive economic data<br />
from the world’s top consumer, China, and an expected<br />
recovery in the US economy. Consistent with the prior<br />
year, the underlying fundamentals of copper remain<br />
strong and the industrial metals required to rebuild<br />
Japan’s damaged infrastructure combined with continued<br />
growth in the developing world are expected to contribute<br />
to continued high demand in the second half of <strong>2011</strong>.<br />
Supply also remains severely constrained.<br />
Gold<br />
Gold <strong>has</strong> been on a constant upward trend since the average<br />
price of $364 per ounce in 2003, reaching the new high of<br />
$1,421 at the end of 2010. Although gold prices experienced<br />
some price volatility in early <strong>2011</strong>, the driving factors behind<br />
the continued high prices have remained in place, leading<br />
to further price increases through the first part of <strong>2011</strong>.<br />
22 PwC
Revenue by commodity<br />
Share of revenue by commodity<br />
30%<br />
25%<br />
20%<br />
15%<br />
10%<br />
<strong>The</strong> largest boost in production comes from potash, a<br />
reversal of the declines in 2009. Iron ore production<br />
levels have returned to 2008 levels as iron-ore producers<br />
expand operations and returned to full production rates.<br />
In 2010, with demand on the rise, iron-ore mines operated<br />
at full capacity, brought major capital projects online, and<br />
generated a 16% increase in production levels. Copper<br />
production decreased as a result of lower grades and<br />
labour strikes in Chile and Peru. Major capital projects also<br />
came online in coal, but these were offset by Rio Tinto’s<br />
sale of its US coal assets. Increasing demand for bauxite<br />
spurred increased production by Rio Tinto at Weipa.<br />
5%<br />
Total production<br />
(Using Copper equivalent tonnes—2010 closing spot)<br />
0%<br />
Coal<br />
2009<br />
2010<br />
Copper<br />
Iron ore<br />
Source: PwC analysis.<br />
Gold<br />
Bauxite<br />
Fertilizer<br />
Nickel<br />
Platinum<br />
Zinc<br />
Diamonds<br />
Other<br />
metals<br />
60<br />
59<br />
58<br />
1.0<br />
0.5 (0.3)<br />
Coal, copper and iron ore account for 63% of Top 40<br />
revenue (2009 - 60%) generated this year. Iron ore<br />
revenues increased by $35.8 billion in the year and<br />
represented 20% of total revenues, up from 15% in the<br />
prior year. <strong>The</strong> rise is due to higher prices and increased<br />
production volumes, with production up 16% on the back<br />
of expansion projects and the return to full capacity by<br />
Vale. Coal’s share of the total declined in 2010 due to the<br />
strength of iron ore.<br />
2010 Production<br />
Commodity<br />
(measure)<br />
Top 40<br />
production<br />
(million)<br />
Change from<br />
the prior year<br />
(%)<br />
Coal (tonnes) 1,499 1<br />
Copper (tonnes) 7 (4)<br />
Iron ore (tonnes) 716 16<br />
Gold (tonnes) 34 2<br />
Bauxite (tonnes) 40 10<br />
Potash (tonnes) 13 30<br />
Nickel (tonnes) 1 4<br />
Platinum (ounces) 4 0<br />
Zinc (tonnes) 3 0<br />
Diamonds (carats) 14 (1)<br />
Increases in production across the board are evidenced<br />
above, with only copper and diamonds showing declines.<br />
57<br />
56<br />
55<br />
2009<br />
1.8<br />
Iron ore<br />
Source: PwC Analysis.<br />
Bauxite<br />
Other<br />
Copper<br />
2010<br />
<strong>The</strong> graph above shows a comparison of total production<br />
of the Top 40 year-on-year, using one tonne of copper<br />
as an equivalent unit, based on 2010 closing prices.<br />
This methodology allows for a comparison of relative<br />
production across all commodities. <strong>The</strong> results show a 5%<br />
increase in overall production. This is more than global<br />
economic growth but less than the economic growth<br />
in the developing countries that have been the primary<br />
drivers for higher demand. <strong>The</strong> increase in production,<br />
led by iron ore, stems from large expansion projects<br />
coming on–line resulting in higher production across a<br />
number of commodities. For those that were willing and<br />
able to invest by continuing captial expansions during the<br />
global financial crisis, the payoff, in the form of increased<br />
production, is beginning to be seen.<br />
We have calculated the remaining mine life of the Top 40<br />
using reserves and 2010 production data. When converted<br />
into copper equivalent units at the end of 2010, the Top 40<br />
had a remaining mine life of 35 years. This mine life <strong>has</strong><br />
decreased by two years from 2009 as a result of production<br />
increasing by more than the additions to reserves.<br />
<strong>Mine</strong>–<strong>The</strong> <strong>game</strong> <strong>has</strong> <strong>changed</strong> 23
<strong>Mine</strong> <strong>2011</strong><br />
<strong>The</strong> <strong>game</strong> <strong>has</strong> <strong>changed</strong><br />
Share of total revenue by customer location<br />
% of revenue by customer location<br />
30%<br />
25%<br />
20%<br />
15%<br />
10%<br />
5%<br />
0%<br />
North America<br />
2009<br />
2010<br />
Source: PwC analysis.<br />
China<br />
Europe<br />
<strong>The</strong> above chart tells the tale of China’s influence on<br />
the mining industry and the dominant role that it plays<br />
in demand for commodities. On a percentage basis,<br />
China increased its share of revenue from 25% to 27%,<br />
whereas North America accounted for a smaller portion<br />
of revenues, providing further confirmation of the shift in<br />
the industry to emerging economies.<br />
Costs<br />
Total operating costs increased 12% over the prior year,<br />
with employee costs the driving factor. Despite a decrease<br />
in direct employment, employee benefits expense rose<br />
by 7% from the prior year, for those in the Top 10 that<br />
disclose employee numbers and personnel costs. <strong>The</strong><br />
actual increase for the same companies, when considered<br />
on a per employee basis, is 18%. <strong>The</strong> decrease in direct<br />
employment reflects a shift to contractor and other forms<br />
of labour. <strong>The</strong>re is an increasing scarcity of skilled labour<br />
in the industry, as expansion projects to capitalise on<br />
booming prices fully utilise the available human resource.<br />
With no let up in sight, these cost pressures will continue.<br />
Foreign currency fluctuations continue to create volatility<br />
in the results and played a role in the cost increase. <strong>The</strong> Top<br />
10 reported a negative impact of foreign currency changes<br />
on their operating costs, representing 18% of the total<br />
increase in operating expenses. In particular, movement of<br />
the Canadian dollar, Australian dollar and Brazilian real<br />
relative to the US dollar contributed to these losses.<br />
Working to partially offset the above increases were cost<br />
savings derived from increased efficiency in production<br />
processes reported by a number of companies. It is<br />
difficult to compare these reported achievements due to<br />
the lack of empirical evidence in market releases, lack<br />
of disclosures by some and inconsistencies in approach<br />
between companies.<br />
Income taxes<br />
While income tax expense increased by 65% from the prior<br />
year due to increased profitability, overall the effective<br />
tax rate declined from 35% to 26%. <strong>The</strong> lower effective<br />
tax rate is largely attributed to the impact of exchange<br />
rate fluctuations and limited ability to use tax losses in<br />
the prior year that were absent in 2010. This led to an<br />
unusually high effective tax rate in 2009, in particular for<br />
BHP Billiton and Vale. <strong>The</strong> rate of 26% returns to historical<br />
norms. While royalties are not consistently treated, these<br />
costs are typically not included in income taxes.<br />
Chilean mining clusters<br />
Accelerating the development of world-class suppliers<br />
In Chile, BHP Billiton and Codelco, alongside the Chilean<br />
government, aim to develop mining sector suppliers<br />
through a mining cluster program. This program seeks to<br />
build “world class” skills and capabilities in approximately<br />
250 local suppliers, in order to better support the growth<br />
of the mining industry within Chile and export supply<br />
services to mining projects around the world. By involving<br />
not only suppliers and mining companies, but also the<br />
government, universities and R&D centers, the industry is<br />
taking a collaborative approach to building capability.<br />
“<strong>The</strong> cluster program will help solve the mining<br />
industry´s problems and build a knowledge-based mining<br />
services sector. BHP Billiton is strongly committed to<br />
supporting and incubating these suppliers”<br />
Peter Beaven, President<br />
BHP Billiton Base Metals<br />
24 PwC
<strong>The</strong> talent race is back on!<br />
<strong>The</strong> PwC <strong>2011</strong> Annual CEO Survey shows that more<br />
than 83% of CEOs believe there is a need for change<br />
in the way they manage talent. Mining is no different<br />
from other industries in this respect, but <strong>has</strong> some<br />
particular challenges given the locations of operations<br />
and type of workforce it employs.<br />
<strong>The</strong>re is a growing mining presence in emerging markets,<br />
where there is a dual challenge of incentivisation of staff<br />
and talent mobility. Mining companies increasingly see<br />
international experience as an important credential<br />
for top performers and a necessity to support growing<br />
operations in developing countries.<br />
Joint ventures also present a challenge. <strong>The</strong> prevalence<br />
of joint ventures introduces additional complexity, as<br />
HR and compensation policies from JV participants<br />
can conflict. Disparities in compensation become more<br />
apparent, a particular issues for emerging market<br />
miners. <strong>The</strong>re is a real risk that for globally mobile<br />
staff, compensation will be increasingly set at the<br />
highest common denominator.<br />
A third issue occurs where companies that downsized<br />
during the global financial crisis are now hiring<br />
some of their ex-employees as contractors, paying<br />
significantly higher rates than previous in-house<br />
employees. <strong>The</strong> swift change in the environment to<br />
a growth p<strong>has</strong>e presents the question – should these<br />
contractors be put back on the payroll?<br />
Mining company returns—risk vs. reward<br />
<strong>The</strong> returns generated by the mining industry<br />
can be categorised in three notable forms:<br />
Returns to the company - in the form of<br />
net profits<br />
Payments to governments – primarily<br />
through taxes and royalties<br />
Payments to employees – primarily through<br />
salaries, wages, bonuses and other benefits<br />
Of the three forms, returns to mining<br />
companies inherently carry the most risk,<br />
followed by payments to governments which<br />
are somewhat linked to profitability. Payments<br />
to employees are the least risk-sensitive.<br />
When performance lags, employees and<br />
governments receive a relatively fixed return<br />
whilst mining companies receive little to no<br />
return. In contrast, in good years mining<br />
companies receive strong returns - a reward for<br />
the risk undertaken.<br />
<strong>The</strong> graph for this year’s Top 10 illustrates this<br />
reality. In 2009 during the financial crisis the<br />
government share decreased by only 2% and<br />
the share for employees increased by 5%, while<br />
companies took a significant hit.<br />
2005–2010 Average returns for the Top 10 ($ billion)<br />
8<br />
7<br />
6<br />
5<br />
4<br />
3<br />
2<br />
1<br />
0<br />
2005<br />
2006<br />
2007<br />
Company<br />
Source: PwC analysis.<br />
2008<br />
2009<br />
2010<br />
Government<br />
Employees<br />
Note: <strong>The</strong> graph above provide average returns, to the extent<br />
available, for those in the Top 10. <strong>The</strong> graph does not include nonincome<br />
based taxes. Payments to governments that are not based on<br />
profit create risk as mining companies generally continue to make<br />
such payments even in years of lower profits. According to PwC’s Total<br />
Tax Contribution studies, on average corporate income tax is less than<br />
50% of all the taxes and contributions made by mining companies.<br />
<strong>Mine</strong>–<strong>The</strong> <strong>game</strong> <strong>has</strong> <strong>changed</strong> 25
<strong>Mine</strong> <strong>2011</strong><br />
<strong>The</strong> <strong>game</strong> <strong>has</strong> <strong>changed</strong><br />
Cashflow statement<br />
Cashflow related to operating activities<br />
2010<br />
$ billion<br />
2009<br />
$ billion<br />
Change<br />
%<br />
Cash generated from operations 167 110 52<br />
Taxation paid (24) (20) 20<br />
Other (6) (4) 50<br />
Net operating cash flows 137 86 59<br />
Cashflow related to investing activities<br />
Purc<strong>has</strong>e of property, plant and equipment (67) (58) 16<br />
Purc<strong>has</strong>e of investments (24) (19) 26<br />
Sale of investments 8 5 60<br />
Exploration (6) (6) -<br />
Other net investment-related cash flows 10 1 900<br />
Net investing cash flows (79) (77) 3<br />
Cashflow related to financing activities<br />
Issue of shares 6 33 (82)<br />
Share buy backs (5) - -<br />
Increase in borrowings 35 69 (49)<br />
Repayment of borrowings (50) (76) (34)<br />
Dividends (22) (18) 22<br />
Other 1 - -<br />
Net financing cash flows (35) 8 (514)<br />
Net increase in cash and cash equivalents 23 17 13<br />
Cash and cash equivalents at beginning of the year 81 59<br />
Effect of foreign currency exchange rate changes<br />
on cash and cash equivalents<br />
1 5<br />
Cash and cash equivalents at end of the year 105 81<br />
26 PwC
Operating cashflow – how will it be spent?<br />
In 2010, the Top 40 rebounded from the effects of the<br />
global financial crisis with operating cash flows breaking<br />
through the $100 billion barrier again. Higher commodity<br />
prices and increased production contributed favourably to<br />
the $51 billion, or 59%, increase in operating cash flow.<br />
With cost containment and cash preservation no longer<br />
the number one issue for industry CEOs, the dilemma now<br />
for mining leaders is how to most effectively deploy the<br />
$105 billion cash on hand to ensure sustained success.<br />
Income taxes paid by the Top 40 increased by 20% this year.<br />
Taxes paid typically lag accounting profits. As such, we<br />
anticipate a substantial rise in income taxes paid in <strong>2011</strong>.<br />
<strong>The</strong> rise in income taxes paid is significant, especially<br />
when coupled with the Top 40’s total economic<br />
contribution to the government, including income and<br />
non-income based taxes, royalties, and infrastructure<br />
development.<br />
Investing cashflow – home is where the heart is<br />
As expected, the Top 40 continued to devote cash<br />
resources to purc<strong>has</strong>es of property, plant and equipment.<br />
<strong>The</strong> behaviour of the Top 40 indicates optimism about<br />
their own projects. Investments in organic growth<br />
opportunities including sustaining capital, represented<br />
85% of net investing cash flows.<br />
<strong>The</strong> Top 40 have announced expansion capital programs<br />
of $311 billion. We expect this trend to continue over the<br />
medium term.<br />
<strong>The</strong> deal market is waking up, with a 26% increase in<br />
cash payments for investments in 2010. While the volume<br />
of deals was up, the value still lags well below the record<br />
of 2007, as mega-deals become harder to close. For more<br />
detail on mining industry transactions, refer to our Mining<br />
Deals publication at www.pwc.com/mining.<br />
Exploration spend remains flat and relatively low amongst<br />
the Top 40. At just under $6 billion and only 8% of<br />
net investing cash flows, the Top 40 are not investing<br />
significantly in exploration activities, instead effectively<br />
outsourcing these activities to the junior sector. Given<br />
ongoing supply-side challenges, few new world-class<br />
projects, and those that have been identified largely being<br />
in remote, challenging-to-operate environments, the lack<br />
of expenditure on exploration remains surprising.<br />
Financing cashflow – it is better to give than<br />
to receive<br />
Financing cash flows turned in 2010, moving to a net<br />
outflow of $35 billion demonstrating the shift in fortunes.<br />
Capital raised decreased by 32%, coupled with a 22%<br />
increase in distributions to shareholders in light of strong<br />
operating results, contributed to the net cash financing<br />
outflows of $35 billion.<br />
<strong>The</strong> push for capital expenditure<br />
With record high commodity prices,<br />
top mining companies are looking<br />
to add capacity as quickly as<br />
possible. With mega-deals proving<br />
difficult to execute, in-house<br />
greenfield and expansion capital<br />
projects have become a top priority.<br />
In recent months the Top 40 have<br />
announced plans to invest $311<br />
billion in capital projects in the<br />
coming years, of which $120<br />
billion is scheduled for <strong>2011</strong>. <strong>The</strong>se<br />
announcements represent a major<br />
increase over the $67 billion spent by<br />
these same companies in 2010. <strong>The</strong><br />
increase is even more pronounced as<br />
the 2010 spend includes sustaining<br />
capital expenditures, which are<br />
generally not included in announced<br />
new projects.<br />
Interestingly, although many of the<br />
Top 40 companies have provided<br />
their capital plans for <strong>2011</strong>, details<br />
on which projects will be persued<br />
and at what expected cost is often<br />
not forthcoming.<br />
Supply and demand<br />
Capital projects in the mining<br />
industry often are slower to reach<br />
full output than companies initially<br />
predict. Unforeseen complexity can<br />
drive delays to new production,<br />
tightening metal supply against<br />
forecasts. This can ultimately lead<br />
to increasing prices.<br />
Can it even be done?<br />
<strong>The</strong> projects announced by the<br />
Top 40, in addition to a number<br />
of projects planned by other<br />
companies and in other industries,<br />
could push the world’s ability<br />
to deliver capital projects to the<br />
limits. So, the question remains,<br />
is there enough skilled labour,<br />
equipment, and material to deliver<br />
all of the projects that are planned?<br />
<strong>The</strong> likely answer is no and as<br />
constraints materialise, projects<br />
will likely be delayed and more<br />
marginal projects or those that<br />
cannot secure resources could be<br />
delayed or cancelled.<br />
<strong>Mine</strong>–<strong>The</strong> <strong>game</strong> <strong>has</strong> <strong>changed</strong> 27
<strong>Mine</strong> <strong>2011</strong><br />
<strong>The</strong> <strong>game</strong> <strong>has</strong> <strong>changed</strong><br />
Balance sheet<br />
2010<br />
$ billion<br />
2009<br />
$ billion<br />
Change<br />
%<br />
Current assets<br />
Cash 105 81 30<br />
Inventories 50 43 16<br />
Accounts receivable 51 37 38<br />
Other 36 41 (12)<br />
Total current assets 242 202 20<br />
Non-current assets<br />
Investment in associates and joint ventures 35 33 6<br />
Property, plant and equipment 511 436 17<br />
Goodwill and intangibles 91 75 21<br />
Other 64 52 23<br />
Total non-current assets 701 596 18<br />
Total assets 943 798 18<br />
Current liabilities<br />
Accounts payable 49 40 23<br />
Borrowings 21 20 5<br />
Other 56 42 33<br />
Total current liabilities 126 102 24<br />
Non-current liabilities<br />
Borrowings 130 143 (9)<br />
Other 131 112 17<br />
Total non-current liabilities 261 255 2<br />
Total equity 556 441 26<br />
Total equity and liabilities 943 798 18<br />
Ratios 2010 2009<br />
Gearing (%) 8 16<br />
Current (times) 1.92 1.98<br />
Quick (times) 1.52 1.56<br />
Net debt ($ billion) 46 82<br />
28 PwC
Disappearing debt<br />
With total assets increasing to $943 billion, the industry<br />
is poised to break through the $1 trillion mark in <strong>2011</strong>,<br />
as the Top 40 continues to grow in size and scale.<br />
Noteworthy is that these assets are funded almost<br />
entirely by equity, with net debt down to $46 billion and<br />
borrowings at only 16% of total assets. This shift also<br />
reflects the alternative sources of capital now available to<br />
the industry, as the new era <strong>has</strong> ushered in an increase in<br />
joint ventures, off-take funding and other arrangements.<br />
<strong>The</strong> strong cash position <strong>has</strong> left gearing at just 8%, amazing<br />
when considering that less than two years ago a number<br />
of companies were struggling to refinance short-term<br />
borrowings and many raised equity to help them get through<br />
the financial crisis. In 2010 70% of the Top 40 reduced their<br />
gearing, with 14 companies having no net debt.<br />
With the Top 40 planning to spend $311 billion on capital<br />
projects in the coming years, the industry <strong>has</strong> significant<br />
capacity to fund the growth and to add some debt without<br />
stressing the balance sheet too much.<br />
Some shareholders are already asking what companies are<br />
doing with excess cash and whether they should return it.<br />
Companies are already responding with significant share<br />
buy-backs launched by a number of companies in the first<br />
half of <strong>2011</strong>.<br />
Buy, Build, Distribute<br />
Cash on hand <strong>has</strong> increased 30% to $105 billion in<br />
2010, a remarkable achievement given the challenges<br />
experienced through the financial crisis. This position<br />
<strong>has</strong> been built with steady and consistent performance,<br />
despite the volatility experienced in market capitalisation<br />
over the past three years. <strong>The</strong> build-up of cash could be<br />
seen as a reflection of strong performance or equally as<br />
conservative balance sheet management. <strong>The</strong> question is:<br />
how will the cash be used in <strong>2011</strong>—buy, build, distribute?<br />
Or all of the above?<br />
Capital expenditure by commodity ($ billion)<br />
12<br />
10<br />
8<br />
6<br />
4<br />
2<br />
0<br />
Iron ore<br />
2009<br />
2010<br />
Coal<br />
Copper<br />
Source: PwC analysis.<br />
Gold<br />
Nickel<br />
Aluminium<br />
Fertiliser<br />
Platinum<br />
group<br />
minerals<br />
Diamonds<br />
Zinc<br />
Other<br />
metals<br />
Goodwill rises<br />
With stronger market conditions, impairment charges all<br />
but disappeared in 2010. Goodwill remains on balance<br />
sheets but is concentrated within a small number of<br />
companies, with Rio Tinto representing 32% and Xstrata<br />
14% of the total. <strong>The</strong> most notable increase in goodwill<br />
came from Kinross’ acquisition of Red Back Mining ($5<br />
billion goodwill) with Vale and Rio Tinto each also adding<br />
$1 billion. Of the total intangible asset balance of $91<br />
billion, goodwill comprised $47 billion.<br />
Customers<br />
Accounts receivable increased 38% on the prior year.<br />
With Days Sales Outstanding only increasing by two to<br />
43 days, the rise is more of a reflection of the increase in<br />
commodity prices on fourth quarter sales than decline in<br />
the cash collections from customers in the industry.<br />
Net assets increased 26% or $115 billion—staggering<br />
numbers particularly when similar growth was observed<br />
in 2009, increasing total equity by more than 50% in<br />
two years.<br />
Organic Growth<br />
<strong>The</strong> Top 40 continued to value organic growth as a means<br />
for expansion, with a 17% increase in plant, property and<br />
equipment. <strong>The</strong> graph below shows the capital expenditure<br />
on mining assets by commodity and the continuing focus<br />
on the largest three, iron ore, coal and copper.<br />
<strong>Mine</strong>–<strong>The</strong> <strong>game</strong> <strong>has</strong> <strong>changed</strong> 29
<strong>Mine</strong> <strong>2011</strong><br />
<strong>The</strong> <strong>game</strong> <strong>has</strong> <strong>changed</strong><br />
07<br />
Reserves<br />
30 PwC
Reported reserves<br />
Gold Platinum Copper Zinc Nickel Iron ore<br />
Metallurgical<br />
Coal<br />
<strong>The</strong>rmal<br />
Coal<br />
Bauxite<br />
Potash<br />
(million oz)<br />
(million tonnes)<br />
No. of<br />
companies<br />
15 5 19 7 5 7 12 12 3 2<br />
2009 reserves 582 211 271 40 19 14,939 11,449 67,822 1,177 746<br />
(Depletion) (34) (4) (7) (3) (1) (716) (226) (1,273) (40) (13)<br />
Other net<br />
addition/<br />
(reduction)<br />
71 3 36 3 - 1,278 336 831 (31) 25<br />
2010 reserves 619 210 300 40 18 15,501 11,559 67,380 1,106 758<br />
Change (%) 6% (1%) 11% 0% (4%) 4% 1% (1%) (6%) 2%<br />
Remaining life<br />
(years)<br />
18 51 41 12 21 22 51 53 27 57<br />
Successful conversion<br />
In some commodities mine life was extended in 2010, but<br />
overall our analysis shows that on a copper equivalent<br />
tonnes basis, the industry’s remaining mine life decreased<br />
by two years to 35. This demonstrates that while the Top<br />
40 experienced exploration success, it was not as much as<br />
the increase in production during the year.<br />
Gold exploration gains<br />
PwC’s annual Global Gold Price survey for 2010 again<br />
highlighted the use of higher gold prices in reserve<br />
calculations which lead to lower gold cut-off grades. <strong>The</strong><br />
average gold price used in the calculation increased from<br />
$974 per ounce in 2009 to $1,227 per ounce in 2010. <strong>The</strong><br />
surging gold prices have made higher cost mines<br />
economically feasible. Furthermore, successful<br />
exploration results throughout the year have also pushed<br />
gold reserves higher, such as the gold contained at Oyu<br />
Tolgoi in Mongolia, Goldcorp’s South American and<br />
Canadian projects and Kinross’ projects in Mauritania<br />
and South America.<br />
Copper in focus<br />
Increasing long-term price assumptions following the<br />
run up in the copper price fueled a uniform increase in<br />
copper reserves across the Top 40. <strong>The</strong> increased copper<br />
reserves were primarily attributable to Ivanhoe and Rio<br />
Tinto’s massive Oyu Tolgoi project in Mongolia as well as<br />
Freeport McMoRan’s addition of copper reserves at its<br />
North American properties. New reserves have<br />
significantly exceeded depletion of ore as production was<br />
down, resulting in an extension of the life of the copper<br />
mines by about eight years over 2009.<br />
Pressure on zinc and nickel<br />
Zinc and nickel reserves remained at about 2009 levels<br />
as exploration programs have not discovered significant<br />
new ore bodies in the last few years. <strong>The</strong> remaining zinc<br />
life of Top 40 companies <strong>has</strong> decreased from 13 years at<br />
the end of 2009 to 12 years and nickel <strong>has</strong> declined to 21<br />
years – the shortest remaining lives of all commodities.<br />
We note that a number of major zinc producers are not<br />
currently included in the Top 40, such as Vedanta<br />
Resources plc and Minmetals Resources Limited.<br />
Pay dirt<br />
<strong>The</strong> huge iron ore investments by the majors in<br />
expanding their operations to meet ever growing<br />
demand <strong>has</strong> hit pay dirt in 2010 with a significant<br />
increase in reserves leading to overall growth in<br />
remaining mine life to 22 years. Significant additions<br />
were recorded by all major iron ore players.<br />
<strong>Mine</strong>–<strong>The</strong> <strong>game</strong> <strong>has</strong> <strong>changed</strong> 31
<strong>Mine</strong> <strong>2011</strong><br />
<strong>The</strong> <strong>game</strong> <strong>has</strong> <strong>changed</strong><br />
Coal keeps rising<br />
With global steel production increasing by 17% in 2010,<br />
according to the World Steel Association, metallurgical<br />
coal was in high demand and production increased<br />
lockstep with steel. Similar to iron ore, prices showed<br />
some volatility mid-year, generally increasing during<br />
the year to close strongly, but still below record highs<br />
seen in mid-2008. Anglo American added the most<br />
significant new reserves at its Grosvenor project in<br />
Australia.<br />
Production of thermal coal was stable, with additions<br />
offsetting production. New reserves were reported by<br />
BHP Billiton (due in part to the resource conversion at<br />
Mt Arthur), Xstrata (whose reserves increased due to<br />
reclassification from resources in Rolleston West and<br />
approval of the Bulga project) and China Shenhua (due<br />
to new drilling at Shendong <strong>Mine</strong>s). <strong>The</strong>se additions for<br />
the Top 40 were slightly offset by Rio Tinto’s divestiture<br />
of its North American coal assets.<br />
Bauxite challenges<br />
Production of bauxite was relatively stable year on year.<br />
However due to the changes in Brazilian environmental<br />
laws, BHP Billiton and Rio Tinto have reduced part of<br />
their bauxite ore reserves. <strong>The</strong>se resources will be<br />
reclassified back to reserves once new license approval<br />
<strong>has</strong> been granted. This change reflects the impact of the<br />
challenging operating environment in many countries<br />
due to the heightened focus on the mining industry.<br />
Exploration expenditure<br />
After a severe drop in exploration spend last year, 2010<br />
saw a moderate increase to just below $6 billion by the<br />
Top 40. In our analysis we noted that the focus of the<br />
Top 40 remained on brownfield exploration. With purse<br />
strings remaining tight some companies spending<br />
remained at only 50% of previous levels however plans<br />
for further increases in <strong>2011</strong> and 2012 have been<br />
announced by many. According to Metals Economics<br />
Group’s World Exploration Trends <strong>2011</strong> the total global<br />
spend reached $12.1 billion, up from $8.4 billion in<br />
2009. <strong>The</strong> Top 40, therefore, accounted for less than half<br />
of the total spend, showing the continued importance of<br />
the junior sector to worldwide exploration.<br />
Gold and base metals dominated 2010 exploration<br />
expenditure, comprising almost 85% of the total,<br />
according to Metals Economics Group:<br />
“In 2010, global economic fundamentals kept the spotlight<br />
on gold, and historically high prices prompted gold<br />
explorers to increase their aggregate budget by $1.9<br />
billion. This increase lifted planned spending on the yellow<br />
metal to $5.4 billion and its share of the total budget to<br />
51% - the first time since 1999 that Gold accounted for<br />
more than half of the total planned spending.”<br />
32 PwC
Exploration expenditure<br />
2010 Worldwide exploration budget by commodity<br />
$14<br />
3.5<br />
Nonferrous exploration (US$ bil.)<br />
$12<br />
$10<br />
$8<br />
$6<br />
$4<br />
$2<br />
3.0<br />
2.5<br />
2.0<br />
1.5<br />
1.0<br />
0.5<br />
Annual indexed metals price (1993=1)<br />
2%<br />
3%<br />
33%<br />
11%<br />
51%<br />
$0<br />
93 94 95 96 97 98 99 00 01 02 03 04 05 06 07 08 09 10<br />
Nonferrous exploration total<br />
Uranium exploration total<br />
Annual indexed metals price<br />
Source: Metals Economics Group: World Exploration Trends <strong>2011</strong>.<br />
0.0<br />
Gold<br />
Base metals<br />
Diamonds<br />
PGM<br />
Other<br />
Source: Metals Economics Group: World Exploration Trends <strong>2011</strong>.<br />
<strong>Mine</strong>–<strong>The</strong> <strong>game</strong> <strong>has</strong> <strong>changed</strong> 33
08<br />
What’s mine<br />
is mine<br />
In today’s world governments<br />
in many of the traditional and<br />
emerging mining countries are<br />
looking at reforms to their mining<br />
codes, reviewing their views on<br />
sustainability and refreshing their<br />
approach to royalties and taxation.<br />
At the same time non-government<br />
stakeholders’ influence is growing.<br />
Naturally this <strong>has</strong> focused attention<br />
on the drivers for this activity and<br />
what this all means to a miner’s<br />
licence to operate.<br />
With these issues in mind, mining<br />
executives operating around the<br />
world face increased demands when<br />
assessing new and emerging markets<br />
for investments, acquisitions or new<br />
projects. In the attached article, the<br />
geopolitical risk company Eurasia<br />
Group have highlighted several<br />
examples of where governments have<br />
<strong>changed</strong> policy. It is clear that there<br />
are a number of different motivations<br />
at play in these territories and<br />
mining companies have to become<br />
increasingly adept in dealing with<br />
the influencers behind changes in<br />
regulations.<br />
<strong>The</strong> questions around who pays<br />
for resource development, who<br />
benefits and how these benefits<br />
are distributed remain. This is not<br />
new for miners or for authorities<br />
who have always had to balance<br />
the elements of control over mines<br />
and resources with the ability to<br />
sustainably develop assets in the<br />
investment climate. What <strong>has</strong><br />
emerged recently is a greater voice<br />
from stakeholders on all sides<br />
to challenge whether there is a<br />
balanced, equitable outcome for all<br />
parties and a question to miners, can<br />
you prove your worth?<br />
Across the industry there are a<br />
multitude of examples of activity<br />
where miners are doing just this,<br />
from Anglo American’s Zimele<br />
programme for local procurement<br />
through to Vale’s partnership<br />
with the Earth Institute for the<br />
development of sustainability goals<br />
for international foreign direct<br />
investment. <strong>The</strong> trend is clear and<br />
it will continue, with regulations<br />
around traceability of products,<br />
human rights, carbon emissions,<br />
energy consumption, biodiversity<br />
management and water usage, to<br />
name but a few, all playing a part<br />
in the story. Each issue comes with<br />
a number of focused groups of<br />
stakeholders keen to ensure their<br />
opinions are heard.<br />
It is interesting how the mining story<br />
<strong>has</strong> been told and how integration<br />
into a country’s industrial supply<br />
chain is playing a greater role in<br />
investor presentations and speeches.<br />
<strong>The</strong> scale of mining projects <strong>has</strong> been<br />
increasing as mineral grades are<br />
challenged and projects have to look<br />
to new, often more remote locations<br />
requiring infrastructure, to expand.<br />
Infrastructure is not only the obvious<br />
rail, port and power networks but also<br />
the human infrastructure, such as<br />
medical healthcare and community<br />
support programs. <strong>The</strong>re are already<br />
many examples where miners are<br />
working with local partners further<br />
along the supply chain, which is<br />
often not fully described in the story<br />
of the total economic impact that<br />
a miner generates. It is here that<br />
the collaboration between private<br />
34 PwC
By Divya Reddy, <strong>The</strong> Eurasia Group<br />
As the global economy emerges from the financial crisis,<br />
governments are reassessing their economic priorities<br />
with an overarching goal of maximising economic<br />
growth and addressing budget deficits. In this context,<br />
many governments are considering or actioning a more<br />
interventionist approach to the mining sector, particularly in<br />
light of a strong outlook for commodities demand and weak<br />
budgetary outlooks in a number of minerals-rich countries.<br />
Operations are also receiving heightened attention at the<br />
local level and as such miners are required to be mindful of<br />
community and environmental obligations as well.<br />
Resource nationalism: On the heels of stimulus spending<br />
to counter the effects of the financial crisis, governments<br />
worldwide accrued budget deficits that they will now<br />
seek to plug as they look ahead to longer term economic<br />
growth and fiscal stability. Importantly, while political<br />
risk is traditionally considered in a developing country<br />
context, resource nationalism in the form of taxation and<br />
royalty revisions is also gaining ground in industrialised<br />
countries. In Australia, the government appears likely to<br />
pass the <strong>Mine</strong>rals Resource Rent Tax on iron ore and coal<br />
companies in 2012, although the scope was significantly<br />
moderated from an earlier proposal due to successful<br />
industry lobbying. At the same time, a rise in populist<br />
rhetoric in the run-up to this year’s elections in Peru led<br />
to all major candidates supporting increased taxes on<br />
the mining sector. A victory by Nationalist candidate,<br />
Ollanta Humala, would increase the likelihood that mining<br />
companies will be required to pay higher taxes in Peru.<br />
Elsewhere, resource nationalistic policies are being driven by<br />
industrial policy priorities. For example, Brazil’s upcoming<br />
mining reform, likely to pass in 2012, is designed to align<br />
mining investments to the country’s industrial policy goals.<br />
Along with royalty hikes, the reform will impose tighter<br />
investment requirements and introduce tax mechanisms to<br />
incentivise the industrialisation of minerals domestically.<br />
Similarly in India, the federal government in February raised<br />
iron ore export taxes with an eye to expanding domestic<br />
steel production, while a number of state governments are<br />
trying to impose export taxes for similar reasons.<br />
State capitalism: <strong>The</strong> promotion of national champions <strong>has</strong><br />
become a growing trend in the mining industry. As mining<br />
companies increasingly find themselves competing against<br />
state-owned or state-backed companies, governments may<br />
take a more statist approach to their mining sectors and<br />
promote national champions. In Russia, a long-standing<br />
battle for control over Norilsk Nickel will over time likely<br />
give way to Kremlin intervention to create the foundation of<br />
a metals national champion. In South Africa, an important<br />
near-term priority for the government is the development of a<br />
state-owned mining company, the African Exploration Mining<br />
and Finance Corporation. In the near-term, the outfit poses a<br />
limited competitive threat to established players, but reflects<br />
the government’s increasing involvement in the sector.<br />
Sustainability/community relations: Local opposition<br />
to mining projects on environmental or social grounds<br />
<strong>has</strong> led to a number of recent shutdowns of mines by<br />
generally pro-mining regimes. In Guatemala, human rights<br />
accusations led the government to order the shutdown<br />
of the Marlin gold mine, while in Panama, President<br />
Ricardo Martinelli overturned passage of a new mining<br />
code that would have promoted investment in the sector<br />
following a series of protests by indigenous communities.<br />
Canadian company Greystar is also facing environmental<br />
opposition to developing its copper mine in Colombia, and<br />
in the Philippines the South Cotabato local government<br />
<strong>has</strong> banned open pit mining preventing the development<br />
of Xstrata’s giant Tampakan copper-gold project. Local<br />
security risks can also challenge mine operations, as miners<br />
in Cote d’Ivoire and Mexico are currently experiencing.<br />
Government stability/transparency: Tumultuous or<br />
murky political environments can also have significant<br />
impacts on mining companies. For instance, in Kyrgyzstan,<br />
although the parliament’s approval of Almazbek Atambayev<br />
as Prime Minister in December 2010, followed by the<br />
establishment of a cabinet, were positive steps toward<br />
restoring political order in the country, the majority<br />
coalition is likely to be unstable over time, given the<br />
divergent political views of its member parties. Frontier<br />
markets also tend to be more vulnerable to general<br />
government instability, particularly around elections. For<br />
example, ahead of a 7 November 2010 presidential run-off<br />
vote, mounting tensions and violent clashes in Guinea cast<br />
a large shadow over the future of mining operations, which<br />
depend, in part, on President Alpha Condé’s ability to secure<br />
a smooth political transition from military to civilian rule.<br />
sector and society, along with the<br />
historic relationship with public<br />
sector and policy intervention, needs<br />
to continue to evolve. Where there<br />
<strong>has</strong> been successful collaborations,<br />
these should form key stories to tell,<br />
to ensure that the equitable outcome<br />
message is clear.<br />
Looking to the future, with a greater<br />
focus on sustainability, will miners<br />
be able to address stakeholder<br />
issues and ultimately influence<br />
governments to manage issues<br />
of resource nationalism, state<br />
capitalism, community relations and<br />
transparency? What is perhaps clear<br />
is whilst it is a judgement call for<br />
companies as to where they invest<br />
and how to manage their relative<br />
appetites for risk, when operating<br />
in a country the relationships with<br />
all stakeholders that they have in<br />
that country will be scrutinised<br />
increasingly on the global newswires<br />
and social media sites. It will be<br />
their actions and behaviours being<br />
analysed as much as financial<br />
results and balance sheets. <strong>The</strong><br />
interplay of corporate and society in<br />
developing opinion is greater than<br />
ever and along with a greater need<br />
to address regulatory and increased<br />
stakeholder power, companies have<br />
a real opportunity to help the debate<br />
around resource development.<br />
<strong>Mine</strong>–<strong>The</strong> <strong>game</strong> <strong>has</strong> <strong>changed</strong> 35
09<br />
<strong>The</strong> golden<br />
rules<br />
36 PwC
<strong>The</strong> price of gold always receives a lot<br />
of attention and this was definitely<br />
true during 2010, when it increased<br />
for the tenth consecutive year to<br />
$1,421 per ounce, up 23% year on<br />
year. As the price continues to rise to<br />
new highs in the first part of <strong>2011</strong>, the<br />
question is; what will happen next?<br />
Because gold is indestructible and not<br />
consumed in the way other<br />
commodities are, it is not as influenced<br />
by typical supply and demand factors<br />
but rather as a means for storing<br />
wealth. <strong>The</strong>re are a number of other<br />
macro-economic factors that are<br />
keeping prices at the current level<br />
and which could continue to drive<br />
prices even higher, including the<br />
European sovereign debt crisis, unrest<br />
in the Middle East and increased<br />
central bank buying of gold.<br />
As gold is priced in US dollars,<br />
changes in the value of the dollar<br />
influence the price of gold. <strong>The</strong> US<br />
dollar remained weak in 2010, partly<br />
as a result of U.S. monetary policy,<br />
such as the US Federal Reserve’s<br />
second round of quantitative easing.<br />
With gold utilised as an alternative<br />
‘currency’ to the US dollar, this <strong>has</strong> the<br />
effect of driving up the price of gold.<br />
Gold ETFs experienced substantial<br />
growth as investors looked to such<br />
funds to either speculate, or as an<br />
alternative to US treasury bills or<br />
money market funds, as the US dollar<br />
depreciated. <strong>The</strong> total holdings of<br />
gold through ETFs reached a high of<br />
approximately 70 million ounces of<br />
gold, more than double total gold<br />
production of the Top 40 in 2010.<br />
Growth in emerging countries also<br />
affects the price of gold – through<br />
increased purc<strong>has</strong>es of gold by their<br />
central banks, as well as their citizens,<br />
as wealth increases. This is<br />
highlighted by the People’s Bank of<br />
China encouraging the people of<br />
China to purc<strong>has</strong>e gold as a hedge<br />
against inflation in their Financial<br />
Markets Review in March <strong>2011</strong> and the<br />
Central Bank of the Russian Federation<br />
purc<strong>has</strong>ing 140 tonnes of gold in 2010,<br />
an increase of 21% over 2009.<br />
Overall there was a significant shift in<br />
demand in 2010 from the official<br />
sector, with central banks becoming<br />
net buyers of the yellow metal for the<br />
first time in two decades.<br />
Since there is substantially less gold<br />
available than US dollars, small shifts<br />
from U.S. dollars to gold can cause a<br />
considerable increase in demand. At<br />
the end of 2010, preliminary figures<br />
from the International Monetary<br />
Fund’s (IMF) Currency Composition<br />
of Official Foreign Exchange Reserves<br />
indicate that emerging and<br />
developing economies that report to<br />
the IMF hold $1.4 trillion of US<br />
dollars in their Official Foreign<br />
Exchange Reserves. Even a 5% shift in<br />
US dollar holdings to gold by these<br />
countries would represent a massive<br />
50 million ounce increase in demand<br />
for gold that is comparable to 71% of<br />
total investment in ETF’s at the end of<br />
2010 and would significantly affect<br />
gold prices.<br />
As a result of high gold prices and the<br />
fact that gold companies attract the<br />
‘gold premium’, resulting in the use of<br />
higher multiples than base metal<br />
companies, unique transactions can<br />
be considered to obtain this premium.<br />
One such example is a base metals<br />
company that either sells or spins out<br />
to its shareholders its gold assets if it<br />
is thought that the assets are not<br />
attracting the gold premium.<br />
Another way to unlock this premium<br />
is through a transaction with a gold<br />
streaming or royalty company. Gold<br />
streaming companies enter into<br />
streaming transactions which are<br />
contracts to purc<strong>has</strong>e gold production<br />
from other companies, often those for<br />
which the gold production is a<br />
byproduct. In this instance, the<br />
stream company will gain the benefit<br />
of the gold premium which the base<br />
metals producer was not able to.<br />
Given the shortage of world class<br />
deposits that contain only gold, larger<br />
gold companies, in their quest to<br />
replace resources, often consider<br />
acquiring properties with substantial<br />
copper along with gold. In time, this<br />
may change the dynamics associated<br />
with the gold premium.<br />
<strong>Mine</strong>–<strong>The</strong> <strong>game</strong> <strong>has</strong> <strong>changed</strong> 37
<strong>Mine</strong> <strong>2011</strong><br />
<strong>The</strong> <strong>game</strong> <strong>has</strong> <strong>changed</strong><br />
10<br />
Glossary<br />
Current ratio<br />
EBITDA<br />
Adjusted EBITDA<br />
PBIT<br />
PBT<br />
EBITDA margin<br />
Adjusted EBITDA margin<br />
Gearing ratio<br />
GFC<br />
Market capitalisation<br />
Net Borrowings<br />
Quick ratio<br />
Net profit margin<br />
Return on capital employed<br />
(“ROCE”)<br />
Return on equity (“ROE”)<br />
SWFs<br />
Top three<br />
Top four<br />
Top 10<br />
Top 40<br />
TSR<br />
Current assets / Current liabilities<br />
Earnings before interest, tax, depreciation and amortisation.<br />
EBITDA adjusted to exclude impairment charges. A measure<br />
that is close to the underlying cash earning stream of the<br />
company before servicing the capital base.<br />
Profit before interest and tax<br />
Profit before tax<br />
EBITDA / Revenue<br />
Adjusted EBITDA / Revenue<br />
Net borrowings / Net borrowings plus shareholders’ equity<br />
Global Financial Crisis<br />
<strong>The</strong> market value of the equity of a company, calculated as the<br />
share price multiplied by the number of shares outstanding<br />
Borrowings less cash<br />
(Current assets less Inventory) / Current liabilities<br />
Net profit / Revenue<br />
Net profit / Average property plant and equipment plus<br />
current assets less current liabilities<br />
Net profit / Average shareholders’ equity<br />
Sovereign Wealth Funds<br />
BHP Billiton, Vale and Rio Tinto<br />
BHP Billiton, Vale, Rio Tinto and China Shenhua<br />
BHP Billiton, Vale, Rio Tinto, China Shenhua, Xstrata, Anglo<br />
American, Freeport-McMoran, Barrick Gold, Potash Corp,<br />
Coal India.<br />
40 of the world’s largest mining companies<br />
Total shareholder return: as measured by dividends and<br />
capital gain in a given period over the opening share price.<br />
38 PwC
11<br />
Top 40 companies analysed<br />
Name Country ** Year end<br />
Agnico-Eagle <strong>Mine</strong>s Limited (*) Canada 31-Dec<br />
Anglo American plc UK 31-Dec<br />
AngloGold Ashanti Limited South Africa 31-Dec<br />
Antofagasta plc UK 31-Dec<br />
Barrick Gold Corporation Canada 31-Dec<br />
BHP Billiton Limited / BHP Billiton plc Australia / UK 30-Jun<br />
Cameco Corporation Canada 31-Dec<br />
China Coal Energy Company Limited Hong Kong 31-Dec<br />
China Shenhua Energy Company Limited Hong Kong 31-Dec<br />
Coal India Limited (*) India 31-Mar<br />
Compania de Minas Buenaventura SA Peru 31-Dec<br />
Consol Energy Inc. United States 31-Dec<br />
Eurasian Natural Resources Corporation PLC UK 31-Dec<br />
Fortescue Metals Group Limited Australia 30-Jun<br />
Freeport-McMoRan Copper & Gold Inc. United States 31-Dec<br />
Goldcorp Inc. Canada 31-Dec<br />
Gold Fields Limited South Africa 30-Jun<br />
Grupo Mexico S.A. de CV Mexico 31-Dec<br />
Impala Platinum Holdings Limited South Africa 30-Jun<br />
Industrias Penoles S.A.B De CV (*) Mexico 31-Dec<br />
Ivanhoe <strong>Mine</strong>s Limited Canada 31-Dec<br />
Jiangxi Copper Company Limited Hong Kong 31-Dec<br />
Kazakhmys Plc UK 31-Dec<br />
KGHM Polska Miedz SA (*) Poland 31-Dec<br />
Kinross Gold Corporation Canada 31-Dec<br />
MMC Norilsk Nickel Russia 31-Dec<br />
National <strong>Mine</strong>ral Development Corporation Limited India 31-Mar<br />
Newcrest Mining Limited Australia 30-Jun<br />
Newmont Mining Corporation United States 31-Dec<br />
Peabody Energy Corporation United States 31-Dec<br />
Potash Corporation of Saskatchewan Inc. Canada 31-Dec<br />
Rio Tinto plc / Rio Tinto Limited UK / Australia 31-Dec<br />
Shandong Gold Mining Co., Ltd (*) China 31-Dec<br />
Shanxi Xishan Coal and Electricity Power Company Limited China 31-Dec<br />
Silver Wheaton Corp. (*) Canada 31-Dec<br />
Teck Resources Limited Canada 31-Dec<br />
<strong>The</strong> Mosaic Company United States 31-May<br />
Vale SA Brazil 31-Dec<br />
Xstrata plc UK 31-Dec<br />
Yanzhou Coal Mining Company Ltd (*) Hong Kong 31-Dec<br />
(*) Refer to companies which were not included in 2009 analysis.<br />
(**) Refers to the country of primary listing where the shares are publicly traded.<br />
<strong>Mine</strong>–<strong>The</strong> <strong>game</strong> <strong>has</strong> <strong>changed</strong> 39
<strong>Mine</strong> <strong>2011</strong><br />
<strong>The</strong> <strong>game</strong> <strong>has</strong> <strong>changed</strong><br />
12<br />
Explanatory notes for aggregated financial information<br />
We have analysed 40 of the largest<br />
listed mining companies by market<br />
capitalisation. Our analysis includes<br />
major companies in all parts of the<br />
world whose primary business is<br />
assessed to be mining.<br />
<strong>The</strong> results aggregated in this report<br />
have been sourced from the latest<br />
publicly available information,<br />
primarily annual reports and<br />
financial reports available to<br />
shareholders. Where 2010<br />
information was unavailable at the<br />
time of data collation, these<br />
companies have been excluded.<br />
Companies have different year-ends<br />
and report under different accounting<br />
regimes, including International<br />
Financial Reporting Standards<br />
(IFRS), US Generally Accepted<br />
Accounting Principles (US GAAP),<br />
Canadian GAAP, and others.<br />
All figures in this publication are<br />
reported in US dollars, except when<br />
specifically stated. <strong>The</strong> results of<br />
companies that report in currencies<br />
other than the US dollar have been<br />
translated at the US dollar exchange<br />
rate for the respective year.<br />
Some diversified companies<br />
undertake part of their activities<br />
outside the mining industry, such as<br />
the petroleum business of BHP<br />
Billiton and parts of the Rio Tinto<br />
aluminium business. No attempt <strong>has</strong><br />
been made to exclude such nonmining<br />
activities from the aggregated<br />
financial information.<br />
Entities that are controlled by others<br />
in the Top 40 and consolidated into<br />
their results have been excluded, even<br />
when minority stakes are listed.<br />
Information <strong>has</strong> been aggregated for<br />
the financial years of individual<br />
companies and no adjustments have<br />
been made to take into account<br />
different reporting requirements and<br />
year-ends. As such, the financial<br />
information shown for 2010 covers<br />
reporting periods from 1 April 2009<br />
to 31 December 2010, with each<br />
company’s results included for the<br />
12-month financial reporting period<br />
that falls into this timeframe.<br />
40 PwC
13<br />
Key contributors to <strong>Mine</strong><br />
1 Firman Sababalat, Indonesia<br />
2 Krzysztof Gmur, Poland<br />
1<br />
2<br />
4<br />
7 9<br />
3 5 6 8 10 11<br />
3 Hallie Caywood, United States of America<br />
4 Ben Gargett, Australia<br />
5 K. Praveen Kumar, India<br />
6 Lana Kirk, Canada<br />
7 Christopher Reeves, United Kingdom<br />
8 Roberto Baptista, Brazil<br />
9 Stefan de Klerk, South Africa<br />
10 John Matheson, China<br />
11 Eric Ichikawa, Brazil<br />
Not pictured:<br />
Jill Wang, China<br />
Global Mining Leadership Team<br />
<strong>Mine</strong>–<strong>The</strong> <strong>game</strong> <strong>has</strong> <strong>changed</strong> 41
<strong>Mine</strong> <strong>2011</strong><br />
<strong>The</strong> <strong>game</strong> <strong>has</strong> <strong>changed</strong><br />
14<br />
Contacting PwC<br />
Visit our website:<br />
www.pwc.com/mining<br />
PwC (www.pwc.com) provides<br />
industry-focused assurance, tax and<br />
advisory services to build public trust<br />
and enhance value for its clients and<br />
their stakeholders. More than<br />
161,000 people in 154 countries work<br />
collaboratively using connected<br />
thinking to develop fresh perspectives<br />
and practical advice.<br />
PwC is a leading adviser to the global<br />
mining industry, working with a wide<br />
variety of explorers, producers and<br />
related service providers to ensure we<br />
meet the challenges of the global<br />
mining industry into the future.<br />
Our strength in serving the global<br />
mining industry comes from our<br />
skills, our experience, and our<br />
seamless global network of dedicated<br />
professionals who focus their time on<br />
understanding the industry and<br />
working on solutions to mining<br />
industry issues.<br />
For more information on this<br />
publication or how PwC can assist<br />
you in managing value and reporting,<br />
please speak to your current PwC<br />
contact or telephone/ e-mail the<br />
individuals below who will put you in<br />
contact with the right person.<br />
Global Mining Leadership Team<br />
Global Mining Leader and Australia<br />
Tim Goldsmith, Melbourne<br />
Telephone: +61.3.8603.2016<br />
Email : tim.goldsmith@au.pwc.com<br />
Africa<br />
Hein Boegman, Johannesburg<br />
Telephone: +27.11.797.4335<br />
Email : hein.boegman@za.pwc.com<br />
Canada<br />
John Gravelle, Toronto<br />
Telephone +1.416.869.8727<br />
E-mail: john.gravelle@ca.pwc.com<br />
China<br />
Ken Su, Beijing<br />
Telephone: +86.10.6533.7290<br />
E-mail: ken.x.su@cn.pwc.com<br />
India<br />
Kameswara Rao, Hyderabad<br />
Telephone: +91.40.6624.6688<br />
Email: kameswara.rao@in.pwc.com<br />
Indonesia<br />
Sacha Winzenried, Jakarta<br />
Telephone: +62.21.5289.0968<br />
Email: sacha.winzenried@id.pwc.com<br />
Latin America<br />
Ronaldo Valino, Rio de Janeiro<br />
Telephone: +55.21.3232.6139<br />
E-mail: ronaldo.valino@br.pwc.com<br />
Russia and Central and<br />
Eastern Europe<br />
John Campbell, Moscow<br />
Telephone: +7.495.967.6279<br />
E-mail: john.c.campbell@ru.pwc.com<br />
United Kingdom<br />
Jason Burkitt, London<br />
Telephone: +44.20.7213.2515<br />
E-mail: jason.e.burkitt@uk.pwc.com<br />
United States<br />
Steve Ralbovsky, Phoenix<br />
Telephone: +1.602.364.8193<br />
E-mail: steve.ralbovsky@us.pwc.com<br />
Knowledge Manager<br />
Ben Gargett, Melbourne<br />
Telephone: +61.3.8603.2539<br />
Email: benjamin.gargett@au.pwc.com<br />
42 PwC
15<br />
PwC mining publications<br />
Country <strong>Mine</strong> publications<br />
Besides the Global <strong>Mine</strong> publication PwC prepares a number of Country<br />
<strong>Mine</strong> Publications which focus on analysis of trends in the mining industry<br />
in particular regions.<br />
Aussie mine—Rise and Shine :: November 2010<br />
PwC’s annual review of trends in the mid-tier Australian mining<br />
industry. This report focuses on the annual results of the largest 50<br />
mining companies listed on the Australian Stock Exchange with a<br />
market capitalisation of less than $5 billion at 30 June 2010.<br />
Contact Tim Goldsmith, Melbourne<br />
Telephone: +61.3.8603.2016<br />
Email: tim.goldsmith@au.pwc.com<br />
South Africa <strong>Mine</strong>—Review of trends in the South<br />
African mining industry :: November 2010<br />
This second edition of SA <strong>Mine</strong> focuses on the state of the<br />
mining sector in South Africa. It aggregates the financial<br />
results of mining companies with a primary listing on<br />
the Johannesburg Stock Exchange (JSE) and large mining<br />
companies with a secondary listing on the JSE whose main<br />
operations are in Africa at 30 June 2010.<br />
Contact Hein Boegman, Johannesburg<br />
Telephone: +27.11.797.4335<br />
Email: hein.boegman@za.pwc.com<br />
Junior mine - Trends in the TSX :: October 2010<br />
PwC Canada’s review of trends in the mining industry through<br />
analysis of the top 100 mining companies on the TSX Venture<br />
Exchange, based on market capitalisation at 30 June 2010.<br />
Contact John Gravelle, Toronto<br />
Telephone +1.416.869.8727<br />
E-mail: john.gravelle@ca.pwc.com<br />
Metals and Mining in Russia and CIS :: April 2010<br />
This inaugural edition of Metals & Mining in Russia and CIS<br />
focuses on the state of the mining sector in this region and<br />
the major trends in its development. It analyses the financial<br />
results of 20 major mining companies in Russia, Ukraine and<br />
Kazakhstan.<br />
Contact John Campbell, Moscow<br />
Telephone: +7.495.967.6279<br />
E-mail: john.c.campbell@ru.pwc.com<br />
<strong>Mine</strong>–<strong>The</strong> <strong>game</strong> <strong>has</strong> <strong>changed</strong> 43
<strong>Mine</strong> <strong>2011</strong><br />
<strong>The</strong> <strong>game</strong> <strong>has</strong> <strong>changed</strong><br />
Other PwC Mining Publications<br />
Our commitment to the industry goes beyond our services. As industry leaders, we<br />
are globally recognised for our broad knowledge of the mining industry and the<br />
laws that govern it.<br />
Set out on this page are examples of recent mining thought leadership publications.<br />
Global mining deals 2010 – You Can’t Always Get What<br />
You Want :: March <strong>2011</strong><br />
It’s likely that Mick Jagger and Keith Richards had other things<br />
on their minds while crafting “You Can’t Always Get What<br />
You Want”, the Rolling Stones’ 1969 classic, but we can’t think<br />
of a more fitting theme for mining M&A in 2010 and, more<br />
importantly, for the decades ahead. <strong>The</strong> bottom line is that,<br />
with the world’s population estimated to reach 8.3 billion by<br />
2030 amid fears of a fleeting supply of resources, there may<br />
not be enough to go around. Someone, somewhere, may be<br />
disappointed.<br />
With this in mind, Mining Deals 2010 revisits mining M&A in<br />
2010 and looks at anticipated trends for M&A in <strong>2011</strong>. Our report<br />
sets out the winners, losers and those waiting in the wings.<br />
Contact Tim Goldsmith, Melbourne<br />
Telephone: +61.3.8603.2016<br />
Email : tim.goldsmith@au.pwc.com<br />
John Gravelle, Toronto<br />
Telephone +1.416.869.8727<br />
E-mail: john.gravelle@ca.pwc.com<br />
As good as gold? Global perspectives on the<br />
rising price of gold: 2010 Global Gold Price<br />
Survey Report :: December 2010<br />
Annually, PwC surveys gold mining companies from around<br />
the world. We spoke with 44 companies, asking them questions<br />
varying from when do you think the price of gold will peak, to,<br />
what gold price are you applying to your reserves in 2010?<br />
This year we took an even deeper look into the gold sector,<br />
noting trends around the relationship between the price of gold<br />
and M&A activity, hedging strategies, the investment market’s<br />
increased attractiveness toward junior mines involved in gold,<br />
struggling global currencies and countries’ increased interest in<br />
gold. As the price of gold seeks to challenge its high in 1980, the<br />
gold sector is in the midst of an exciting period of time. What<br />
will your company do to capitalize on the price of gold?<br />
Contact John Gravelle, Toronto<br />
Telephone +1.416.869.8727<br />
E-mail: john.gravelle@ca.pwc.com<br />
44 PwC
Global mining tax comparison: Income taxes, mining<br />
taxes and mining royalties :: December 2010<br />
This publication is an analysis of the taxes in mining countries<br />
around the world, focusing on income taxes, mining related<br />
taxes and royalties applicable in that country.<br />
Contact Steve Ralbovsky, Phoenix<br />
Telephone: +1.602.364.8193<br />
Email: steve.ralbovsky@us.pwc.com<br />
Financial reporting in the mining industry<br />
This provides a comprehensive analysis of financial reporting<br />
in the global mining industry. It sets out the major accounting<br />
practices adopted by the mining industry under IFRS in respect<br />
of issues of particular relevance to the mining sector. We<br />
are currently updating this publication to address all recent<br />
changes and developments in IFRS and industry practice.<br />
Contact Jason Burkitt, London<br />
Telephone: +44.20.7213.2515<br />
E-mail: jason.e.burkitt@uk.pwc.com<br />
Debbie Smith, Melbourne<br />
Telephone: +61.3.8603.2249<br />
Email : debbie.smith@au.pwc.com<br />
Optimizing extended mining operations through<br />
value driver modeling :: November 2010<br />
<strong>The</strong> global financial crisis brought cost management back into<br />
focus for many mining companies. This publication seeks to<br />
demonstrate that robust modeling of operational cost and<br />
value drivers across the extended life of the mining operation<br />
is a key requirement for maximising value, regardless of the<br />
economic cycle.<br />
Contact Tim Goldsmith, Melbourne<br />
Telephone: +61.3.8603.2016<br />
Email: tim.goldsmith@au.pwc.com<br />
Brian Gillespie<br />
Telephone: +61.7.3257.5656<br />
Email: brian.gillespie@au.pwc.com<br />
<strong>Mine</strong>–<strong>The</strong> <strong>game</strong> <strong>has</strong> <strong>changed</strong> 45
<strong>Mine</strong> <strong>2011</strong><br />
<strong>The</strong> <strong>game</strong> <strong>has</strong> <strong>changed</strong><br />
Sustainable cost reduction in the mining sector ::<br />
September 2010<br />
As the mining industry emerges from the Global financial<br />
crisis, many companies are already outlining plans for<br />
moderate to aggressive growth over the short to medium<br />
term. While production volumes will need to grow to meet an<br />
expected upswing in commodities demand, one of the largest<br />
opportunities for shareholder value creation is operating and<br />
capital cost reduction.<br />
This publication highlights leading practices to achieve<br />
sustainable cost reductions in mining operations. It<br />
also describes an effective approach to improve capital<br />
productivity, which focuses on rigorously challenging project<br />
economics and detailed design solutions during the early<br />
stages of a mining project.<br />
Contact John Gravelle, Toronto<br />
Telephone +1.416.869.8727<br />
E-mail: john.gravelle@ca.pwc.com<br />
Arturo Lopez<br />
Telephone +1.416.941.8219<br />
E-mail: arturo.j.lopez@ca.pwc.com<br />
Total Tax Contribution - A study of the economic<br />
contribution mining companies make to public<br />
finances :: May 2010<br />
<strong>The</strong> taxes and other contributions that mining companies<br />
pay to government is an important element in the creation of<br />
prosperity and stability in the countries in which they operate.<br />
However, the full extent of this contribution is not always<br />
recognized. Using the PwC Total Tax Contribution framework,<br />
this second study for the mining sector aims to bring greater<br />
transparency to the wider economic contribution that mining<br />
companies make to public finances. <strong>The</strong> study is larger<br />
than the original study and includes 22 mining companies<br />
operating in 20 different jurisdictions.<br />
Contact Steve Ralbovsky, Phoenix<br />
Telephone: +1.602.364.8193<br />
Email: steve.ralbovsky@us.pwc.com<br />
Susan Symons, London<br />
Tel: +44.0.20.7804.6744<br />
Email: susan.symons@uk.pwc.com<br />
46 PwC
pwc.com/mining<br />
This publication <strong>has</strong> been prepared for general guidance on matters of interest only, and does not constitute professional advice. You should not act upon the information contained in this publication without<br />
obtaining specific professional advice. No representation or warranty (express or implied) is given as to the accuracy or completeness of the information contained in this publication, and, to the extent<br />
permitted by law, PricewaterhouseCoopers LLP, its members, employees and agents accept no liability, and disclaim all responsibility, for the consequences of you or anyone else acting, or refraining to act, in<br />
reliance on the information contained in this publication or for any decision based on it.<br />
© <strong>2011</strong> PricewaterhouseCoopers LLP. All rights reserved. “PricewaterhouseCoopers” refers to PricewaterhouseCoopers LLP (US), a Delaware limited liability partnership, or, as the context requires, the<br />
PricewaterhouseCoopers global network or other member firms of the network, each of which is a separate and independent legal entity. This document is for general information purposes only, and should not<br />
be used as a substitute for consultation with professional advisors. DH-11-0266 JS