Practice Final Exam â STCC204 The following are the ... - Statistics
Practice Final Exam â STCC204 The following are the ... - Statistics
Practice Final Exam â STCC204 The following are the ... - Statistics

Create successful ePaper yourself
Turn your PDF publications into a flip-book with our unique Google optimized e-Paper software.
17. A food company uses filling machines to package 12 ounce boxes of a certain type of breakfast cereal. <strong>The</strong><br />
variability in this process is due to chance causes only. This process is said to be<br />
a. changable<br />
d. in control<br />
b. assignable<br />
e. None of <strong>the</strong> above.<br />
c. out of control<br />
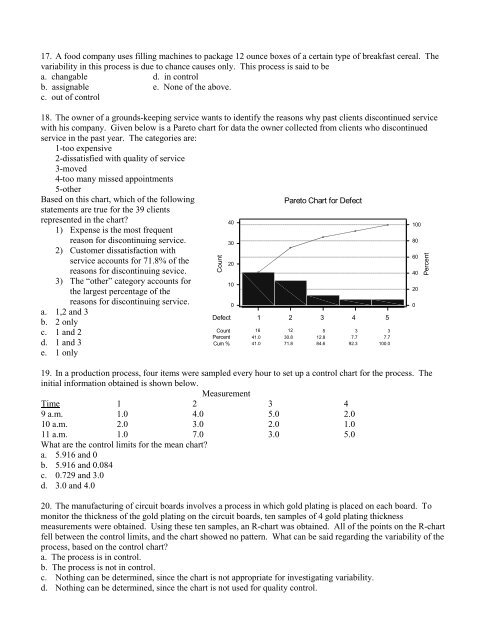
18. <strong>The</strong> owner of a grounds-keeping service wants to identify <strong>the</strong> reasons why past clients discontinued service<br />
with his company. Given below is a P<strong>are</strong>to chart for data <strong>the</strong> owner collected from clients who discontinued<br />
service in <strong>the</strong> past year. <strong>The</strong> categories <strong>are</strong>:<br />
1-too expensive<br />
2-dissatisfied with quality of service<br />
3-moved<br />
4-too many missed appointments<br />
5-o<strong>the</strong>r<br />
Based on this chart, which of <strong>the</strong> <strong>following</strong><br />
statements <strong>are</strong> true for <strong>the</strong> 39 clients<br />
represented in <strong>the</strong> chart?<br />
1) Expense is <strong>the</strong> most frequent<br />
reason for discontinuing service.<br />
2) Customer dissatisfaction with<br />
service accounts for 71.8% of <strong>the</strong><br />
reasons for discontinuing sevice.<br />
3) <strong>The</strong> “o<strong>the</strong>r” category accounts for<br />
<strong>the</strong> largest percentage of <strong>the</strong><br />
reasons for discontinuing service.<br />
a. 1,2 and 3<br />
b. 2 only<br />
c. 1 and 2<br />
d. 1 and 3<br />
e. 1 only<br />
Count<br />
40<br />
30<br />
20<br />
10<br />
0<br />
Defect 1 2 3 4 5<br />
Count<br />
Percent<br />
Cum %<br />
P<strong>are</strong>to Chart for Defect<br />
16 12 5 3 3<br />
41.0 30.8 12.8 7.7 7.7<br />
41.0 71.8 84.6 92.3 100.0<br />
19. In a production process, four items were sampled every hour to set up a control chart for <strong>the</strong> process. <strong>The</strong><br />
initial information obtained is shown below.<br />
Measurement<br />
Time 1 2 3 4<br />
9 a.m. 1.0 4.0 5.0 2.0<br />
10 a.m. 2.0 3.0 2.0 1.0<br />
11 a.m. 1.0 7.0 3.0 5.0<br />
What <strong>are</strong> <strong>the</strong> control limits for <strong>the</strong> mean chart?<br />
a. 5.916 and 0<br />
b. 5.916 and 0.084<br />
c. 0.729 and 3.0<br />
d. 3.0 and 4.0<br />
20. <strong>The</strong> manufacturing of circuit boards involves a process in which gold plating is placed on each board. To<br />
monitor <strong>the</strong> thickness of <strong>the</strong> gold plating on <strong>the</strong> circuit boards, ten samples of 4 gold plating thickness<br />
measurements were obtained. Using <strong>the</strong>se ten samples, an R-chart was obtained. All of <strong>the</strong> points on <strong>the</strong> R-chart<br />
fell between <strong>the</strong> control limits, and <strong>the</strong> chart showed no pattern. What can be said regarding <strong>the</strong> variability of <strong>the</strong><br />
process, based on <strong>the</strong> control chart?<br />
a. <strong>The</strong> process is in control.<br />
b. <strong>The</strong> process is not in control.<br />
c. Nothing can be determined, since <strong>the</strong> chart is not appropriate for investigating variability.<br />
d. Nothing can be determined, since <strong>the</strong> chart is not used for quality control.<br />
100<br />
80<br />
60<br />
40<br />
20<br />
0<br />
Percent