Analysis of Musty Odors using SPME-GC/MS - Shimadzu
Analysis of Musty Odors using SPME-GC/MS - Shimadzu
Analysis of Musty Odors using SPME-GC/MS - Shimadzu

Create successful ePaper yourself
Turn your PDF publications into a flip-book with our unique Google optimized e-Paper software.
SHIMADZU APPLICATION NEWS<br />
● GASCHROMATOGRAPHY MASS SPECTROMETRY<br />
LA146-E024<br />
No.M209<br />
<strong>Analysis</strong> <strong>of</strong> <strong>Musty</strong> <strong>Odors</strong> <strong>using</strong> <strong>SPME</strong>-<strong>GC</strong>/<strong>MS</strong><br />
Japan’s tap water has a solid reputation for its safety.<br />
However, water supplies that are taken from surface<br />
water sources, such as dams, lakes and rivers, may<br />
generate musty odors during the summer. As a<br />
countermeasure, carbon treatment is being used. The<br />
substances ca<strong>using</strong> the musty odor are 2-methylisoborneol<br />
(2-MIB) and geosmin, produced by algae<br />
and actinomyces. The odor threshold values for these<br />
substances are extremely low, in the order <strong>of</strong> several<br />
ng/L, so pretreatment is required to concentrate<br />
samples. In the Japanese goverment’s drinking water<br />
examination, the solid phase extraction <strong>GC</strong>/<strong>MS</strong> and<br />
the purge & trap <strong>GC</strong>/<strong>MS</strong> methods had been stipulated,<br />
and, in 2001, the headspace <strong>GC</strong>/<strong>MS</strong> method was<br />
added. However, the solid phase extraction <strong>GC</strong>/<strong>MS</strong><br />
has disadvantages such as time-consuming and<br />
complex extraction procedures and large consumption<br />
<strong>of</strong> organic solvents. As for the purge & trap <strong>GC</strong>/<strong>MS</strong><br />
method, the analysis system is expensive and<br />
maintenance is difficult.<br />
Solid phase microextraction (<strong>SPME</strong>) is a pretreatment<br />
method that extracts organic compounds from the<br />
headspace <strong>of</strong> liquid or solid samples, concentrates<br />
them, thermally desorb them in the <strong>GC</strong> injector, and<br />
introduces them into the column. This pretreatment<br />
method is attracting attention because it does not<br />
require organic solvents, is fully automated and<br />
operation is easy.<br />
■ Analytical Conditions<br />
Autosampler : AOC 5000 (SHIMADZU)<br />
<strong>SPME</strong> Fiber : PD<strong>MS</strong>/DVB 65µm(SUPELCO)<br />
Instrument : <strong>GC</strong><strong>MS</strong>-QP2010(SHIMADZU)<br />
<strong>GC</strong> Column : DB-5(J&W, 30m×0.25mm I.D. df=0.25µm)<br />
AOC-5000<br />
sample amount<br />
Incubat Temp.<br />
Desorb Time<br />
Pre Inc Time<br />
Extract Time<br />
<strong>GC</strong><br />
Injection Temp.<br />
Column Temp.<br />
Carrier Gas<br />
Injection Method<br />
<strong>MS</strong><br />
Interface Temp.<br />
Ionsource Temp.<br />
Monitor Ion<br />
: 10mL+NaCl3g<br />
: 80˚C<br />
: 3min<br />
: 5min<br />
: 30min (headspace)<br />
: 230˚C<br />
: 40˚C(3min)-15˚C/min-250˚C(3.0min)<br />
: 100kPa<br />
: Splitless (Sampling Time : 3min)<br />
: 250˚C<br />
: 200˚C<br />
: 2-MIB : 95, 107 Geosmin : 112, 182<br />
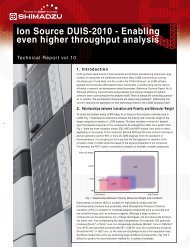
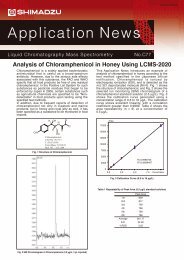
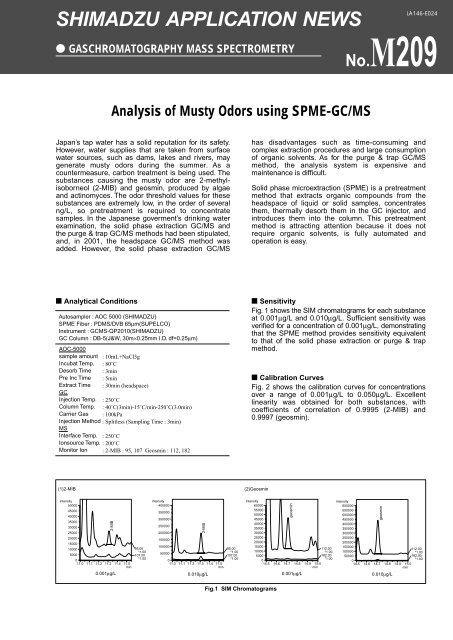
■ Sensitivity<br />
Fig. 1 shows the SIM chromatograms for each substance<br />
at 0.001µg/L and 0.010µg/L. Sufficient sensitivity was<br />
verified for a concentration <strong>of</strong> 0.001µg/L, demonstrating<br />
that the <strong>SPME</strong> method provides sensitivity equivalent<br />
to that <strong>of</strong> the solid phase extraction or purge & trap<br />
method.<br />
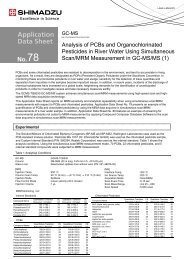
■ Calibration Curves<br />
Fig. 2 shows the calibration curves for concentrations<br />
over a range <strong>of</strong> 0.001µg/L to 0.050µg/L. Excellent<br />
linearity was obtained for both substances, with<br />
coefficients <strong>of</strong> correlation <strong>of</strong> 0.9995 (2-MIB) and<br />
0.9997 (geosmin).<br />
(1)2-MIB<br />
(2)Geosmin<br />
intensity<br />
50000<br />
45000<br />
40000<br />
35000<br />
30000<br />
25000<br />
20000<br />
15000<br />
10000<br />
5000<br />
2-MIB<br />
0<br />
11.0 11.1 11.2 11.3 11.4 11.5<br />
0.001µg/L<br />
min<br />
95.00<br />
*1.00<br />
107.00<br />
*1.00<br />
intensity<br />
400000<br />
350000<br />
300000<br />
250000<br />
200000<br />
150000<br />
100000<br />
50000<br />
2-MIB<br />
0<br />
11.0 11.1 11.2 11.3 11.4 11.5<br />
min<br />
0.010µg/L<br />
95.00<br />
*1.00<br />
107.00<br />
*1.00<br />
intensity<br />
60000<br />
55000<br />
50000<br />
45000<br />
40000<br />
35000<br />
30000<br />
25000<br />
20000<br />
15000<br />
10000<br />
5000<br />
geosmin<br />
0<br />
14.5 14.6 14.7 14.8 14.9 15.0<br />
min<br />
0.001µg/L<br />
112.00<br />
*1.00<br />
182.00<br />
*1.00<br />
intensity<br />
600000<br />
550000<br />
500000<br />
450000<br />
400000<br />
350000<br />
300000<br />
250000<br />
200000<br />
150000<br />
100000<br />
50000<br />
geosmin<br />
0<br />
14.5 14.6 14.7 14.8 14.9 15.0<br />
min<br />
0.010µg/L<br />
112.00<br />
*1.00<br />
182.00<br />
*1.00<br />
Fig.1 SIM Chromatograms
No.M209<br />
(1) 2-MIB<br />
ID#:1 m/z:95.00 Compound Name:2-MIB<br />
f(x)=22364490.302279*x+5991.570697<br />
Correlation Coefficient (R)=0.999499<br />
[*10^6] #<br />
1<br />
1<br />
2<br />
3<br />
4<br />
Concentration(µg/L)<br />
0.001<br />
0.010<br />
0.020<br />
0.050<br />
Area<br />
26133<br />
246730<br />
434120<br />
1128506<br />
(2) Geosmin<br />
ID#:2 m/z:112.00 Compound Name:Geosmin<br />
f(x)=64559563.075706*x-17585.304252<br />
Correlation Coefficient (R)=0.999714<br />
[*10^6] #<br />
1<br />
3<br />
2<br />
3<br />
4<br />
Concentration(µg/L)<br />
0.001<br />
0.010<br />
0.020<br />
0.050<br />
Area<br />
66289<br />
641253<br />
1224401<br />
3227040<br />
5<br />
[*10^-2]<br />
5<br />
[*10^-2]<br />
Fig.2 Calibration Curves<br />
■ Reproducibility<br />
In order to check reproducibility, a low-concentration<br />
sample (0.001µg/L) was analyzed five times. Table 1<br />
shows the results. Pretreatment conditions such as the<br />
temperature and time were controlled by the<br />
autosampler, achieving a excellent reproducibility with<br />
a CV value at 7%.<br />
(1) 2-MIB<br />
Measurement <strong>of</strong> Blank After Injecting 0.050 µg/L Sample<br />
11 12<br />
min<br />
Measurement at 0.001 µg/L<br />
95.00<br />
*1.00<br />
107.00<br />
*1.00<br />
Table 1 Reproducibility<br />
2-MIB<br />
Geosmin<br />
Data 1<br />
23993<br />
69827<br />
Data 2<br />
24463<br />
67942<br />
Data 3<br />
25919<br />
68361<br />
Data 4<br />
21435<br />
58156<br />
Data 5<br />
26133<br />
66289<br />
CV (%)<br />
7.7<br />
7.0<br />
11 12<br />
min<br />
95.00<br />
*1.00<br />
107.00<br />
*1.00<br />
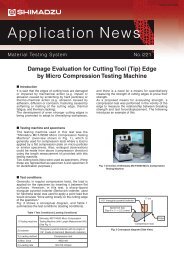
■ Carry Over<br />
In order to check sample carry over, blank water was<br />
measured after injecting a high concentration sample<br />
(0.050µg/L). In Fig. 3, results are compared for the<br />
blank water and low concentration sample (0.001<br />
µg/L). The results show that the carry over is below the<br />
lower detection limit.<br />
(2) Geosmin<br />
Measurement <strong>of</strong> Blank After Injecting 0.050µg/L Sample<br />
14 15<br />
Measurement at 0.001µg/L<br />
min<br />
112.00<br />
*1.00<br />
182.00<br />
*1.00<br />
■ Conclusion<br />
In this Application News, the <strong>SPME</strong>-<strong>GC</strong>/<strong>MS</strong> method<br />
was applied to measure the musty odor in water. The<br />
results showed good sensitivity and quantitation<br />
capability. Although the Drinking Water Examination<br />
Method does not accept the <strong>SPME</strong>-<strong>GC</strong>/<strong>MS</strong> method for<br />
analyzing musty odors, it has been confirmed that this<br />
method is effective.<br />
14 15<br />
min<br />
112.00<br />
*1.00<br />
182.00<br />
*1.00<br />
Fig.3 Data Comparison<br />
SHIMADZU CORPORATION. International Marketing Division<br />
3. Kanda-Nishikicho 1-chome, Chiyoda-ku, Tokyo 101-8448, Japan Phone: 81(3)3219-5641 Fax. 81(3)3219-5710<br />
Cable Add.:SHIMADZU TOKYO<br />
Printed in Japan 3100-02429-10A-IK