An Integrated Data Analysis Suite and Programming ... - TOBIAS-lib
An Integrated Data Analysis Suite and Programming ... - TOBIAS-lib
An Integrated Data Analysis Suite and Programming ... - TOBIAS-lib
Create successful ePaper yourself
Turn your PDF publications into a flip-book with our unique Google optimized e-Paper software.
2.7. ROBUST DETECTION OF CHIP-SEQ ENRICHMENT 47<br />
therefore conservative in the sense that the true number of non-duplicated reads per position<br />
will be underestimated. In contrast to imposing a static limit on the number of reads accepted<br />
at each position, the adaptive heuristic still allows to discriminate dierent levels of extreme<br />
enrichment as well as peak calling in presence of deep background coverage.<br />
2.7.3 Detection Phase<br />
The ChIP-Seq procedure enriches for short DNA fragments with above average anity to the<br />
protein of interest. One or both ends of these fragments are subsequently sequenced, allowing<br />
detection of its origin on the reference genome assembly. In the following, the enriched DNA<br />
fragments subjected to sequencing will be referred to as inserts, whereas the sequenced ends<br />
of the fragments will be referred to as reads. The number of inserts putatively overlapping a<br />
position will be termed insert depth, <strong>and</strong> the number of reads overlapping the position read depth.<br />
The primary peak detection phase, resembling that of MACS [104] (section 1.5.6), is realized<br />
as a sliding window analysis of insert depth. A window of xed, user-selectable width is shifted<br />
along the reference sequence in single base steps. In each step, the algorithm calculates the<br />
average depth of insert coverage over the current window. In the case of paired-end sequencing,<br />
insert depth is calculated from the ranges dened by read pairs. For single end sequencing, each<br />
read is extended in 3 ′ direction to match the estimated average insert size. To exclude regions<br />
not accessible to the sequencing experiment, positions with sequencing depth zero are ignored,<br />
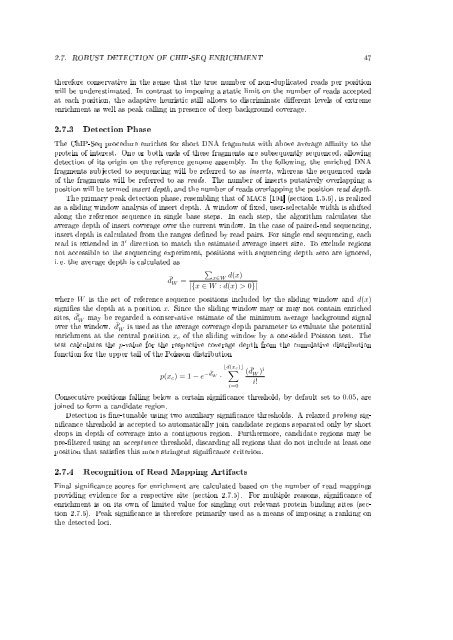
i. e. the average depth is calculated as<br />
∑<br />
¯d ′ x∈W<br />
W =<br />
d(x)<br />
|{x ∈ W : d(x) > 0}|<br />
where W is the set of reference sequence positions included by the sliding window <strong>and</strong> d(x)<br />
signies the depth at a position x. Since the sliding window may or may not contain enriched<br />
sites, ¯d′ W may be regarded a conservative estimate of the minimum average background signal<br />
over the window. ¯d′ W is used as the average coverage depth parameter to evaluate the potential<br />
enrichment at the central position x c of the sliding window by a one-sided Poisson test. The<br />
test calculates the p-value for the respective coverage depth from the cumulative distribution<br />
function for the upper tail of the Poisson distribution<br />
⌊d(x<br />
p(x c ) = 1 − e − ¯d ∑ c)⌋<br />
′<br />
W ·<br />
i=0<br />
( ¯d ′ W )i<br />
i!<br />
Consecutive positions falling below a certain signicance threshold, by default set to 0.05, are<br />
joined to form a c<strong>and</strong>idate region.<br />
Detection is ne-tunable using two auxiliary signicance thresholds. A relaxed probing signicance<br />
threshold is accepted to automatically join c<strong>and</strong>idate regions separated only by short<br />
drops in depth of coverage into a contiguous region. Furthermore, c<strong>and</strong>idate regions may be<br />
pre-ltered using an acceptance threshold, discarding all regions that do not include at least one<br />
position that satises this more stringent signicance criterion.<br />
2.7.4 Recognition of Read Mapping Artifacts<br />
Final signicance scores for enrichment are calculated based on the number of read mappings<br />
providing evidence for a respective site (section 2.7.5). For multiple reasons, signicance of<br />
enrichment is on its own of limited value for singling out relevant protein binding sites (section<br />
2.7.6). Peak signicance is therefore primarily used as a means of imposing a ranking on<br />
the detected loci.


