

An Integrated Data Analysis Suite and Programming ... - TOBIAS-lib
An Integrated Data Analysis Suite and Programming ... - TOBIAS-lib
An Integrated Data Analysis Suite and Programming ... - TOBIAS-lib

You also want an ePaper? Increase the reach of your titles
YUMPU automatically turns print PDFs into web optimized ePapers that Google loves.
56 CHAPTER 2. A HIGH-THROUGHPUT DNA SEQUENCING DATA ANALYSIS SUITE<br />
Depth of Coverage [# Reads]<br />
0 5 10 15 20 25<br />
Median Depth of Coverage<br />
Depth Inner Quartiles<br />
Average Depth ±SD<br />
2:1 2:10000001 3:200001 3:10200001 3:20200001<br />
Position [bp]<br />
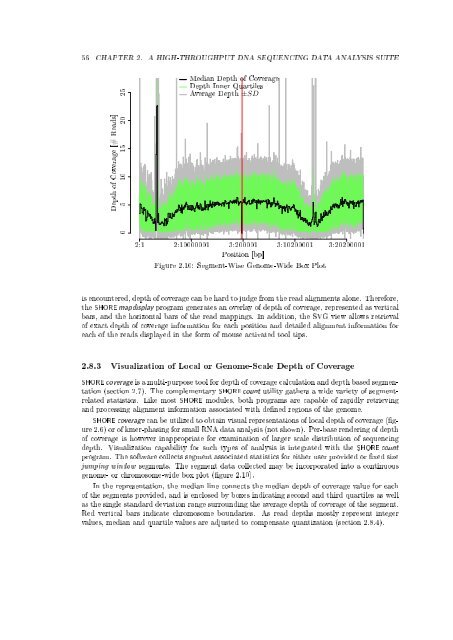
Figure 2.10: Segment-Wise Genome-Wide Box Plot<br />
is encountered, depth of coverage can be hard to judge from the read alignments alone. Therefore,<br />
the SHORE mapdisplay program generates an overlay of depth of coverage, represented as vertical<br />
bars, <strong>and</strong> the horizontal bars of the read mappings. In addition, the SVG view allows retrieval<br />
of exact depth of coverage information for each position <strong>and</strong> detailed alignment information for<br />
each of the reads displayed in the form of mouse activated tool tips.<br />
2.8.3 Visualization of Local or Genome-Scale Depth of Coverage<br />
SHORE coverage is a multi-purpose tool for depth of coverage calculation <strong>and</strong> depth based segmentation<br />
(section 2.7). The complementary SHORE count utility gathers a wide variety of segmentrelated<br />
statistics. Like most SHORE modules, both programs are capable of rapidly retrieving<br />
<strong>and</strong> processing alignment information associated with dened regions of the genome.<br />
SHORE coverage can be utilized to obtain visual representations of local depth of coverage (gure<br />
2.6) or of kmer-phasing for small RNA data analysis (not shown). Per-base rendering of depth<br />
of coverage is however inappropriate for examination of larger scale distribution of sequencing<br />
depth. Visualization capability for such types of analysis is integrated with the SHORE count<br />
program. The software collects segment associated statistics for either user provided or xed size<br />
jumping window segments. The segment data collected may be incorporated into a continuous<br />
genome- or chromosome-wide box plot (gure 2.10).<br />
In the representation, the median line connects the median depth of coverage value for each<br />
of the segments provided, <strong>and</strong> is enclosed by boxes indicating second <strong>and</strong> third quartiles as well<br />
as the single st<strong>and</strong>ard deviation range surrounding the average depth of coverage of the segment.<br />
Red vertical bars indicate chromosome boundaries. As read depths mostly represent integer<br />
values, median <strong>and</strong> quartile values are adjusted to compensate quantization (section 2.8.4).


