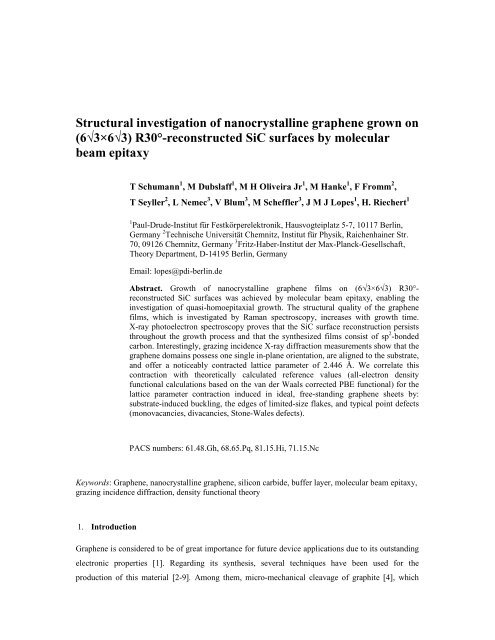
Structural investigation of nanocrystalline graphene grown on
Structural investigation of nanocrystalline graphene grown on
Structural investigation of nanocrystalline graphene grown on

You also want an ePaper? Increase the reach of your titles
YUMPU automatically turns print PDFs into web optimized ePapers that Google loves.
<str<strong>on</strong>g>Structural</str<strong>on</strong>g> <str<strong>on</strong>g>investigati<strong>on</strong></str<strong>on</strong>g> <str<strong>on</strong>g>of</str<strong>on</strong>g> <str<strong>on</strong>g>nanocrystalline</str<strong>on</strong>g> <str<strong>on</strong>g>graphene</str<strong>on</strong>g> <str<strong>on</strong>g>grown</str<strong>on</strong>g> <strong>on</strong><br />
(6√3×6√3) R30°-rec<strong>on</strong>structed SiC surfaces by molecular<br />
beam epitaxy<br />
T Schumann 1 , M Dubslaff 1 , M H Oliveira Jr 1 , M Hanke 1 , F Fromm 2 ,<br />
T Seyller 2 , L Nemec 3 , V Blum 3 , M Scheffler 3 , J M J Lopes 1 , H. Riechert 1<br />
1 Paul-Drude-Institut für Festkörperelektr<strong>on</strong>ik, Hausvogteiplatz 5-7, 10117 Berlin,<br />
Germany 2 Technische Universität Chemnitz, Institut für Physik, Raichenhainer Str.<br />
70, 09126 Chemnitz, Germany 3 Fritz-Haber-Institut der Max-Planck-Gesellschaft,<br />
Theory Department, D-14195 Berlin, Germany<br />
Email: lopes@pdi-berlin.de<br />
Abstract. Growth <str<strong>on</strong>g>of</str<strong>on</strong>g> <str<strong>on</strong>g>nanocrystalline</str<strong>on</strong>g> <str<strong>on</strong>g>graphene</str<strong>on</strong>g> films <strong>on</strong> (6√3×6√3) R30°rec<strong>on</strong>structed<br />
SiC surfaces was achieved by molecular beam epitaxy, enabling the<br />
<str<strong>on</strong>g>investigati<strong>on</strong></str<strong>on</strong>g> <str<strong>on</strong>g>of</str<strong>on</strong>g> quasi-homoepitaxial growth. The structural quality <str<strong>on</strong>g>of</str<strong>on</strong>g> the <str<strong>on</strong>g>graphene</str<strong>on</strong>g><br />
films, which is investigated by Raman spectroscopy, increases with growth time.<br />
X-ray photoelectr<strong>on</strong> spectroscopy proves that the SiC surface rec<strong>on</strong>structi<strong>on</strong> persists<br />
throughout the growth process and that the synthesized films c<strong>on</strong>sist <str<strong>on</strong>g>of</str<strong>on</strong>g> sp 2 -b<strong>on</strong>ded<br />
carb<strong>on</strong>. Interestingly, grazing incidence X-ray diffracti<strong>on</strong> measurements show that the<br />
<str<strong>on</strong>g>graphene</str<strong>on</strong>g> domains possess <strong>on</strong>e single in-plane orientati<strong>on</strong>, are aligned to the substrate,<br />
and <str<strong>on</strong>g>of</str<strong>on</strong>g>fer a noticeably c<strong>on</strong>tracted lattice parameter <str<strong>on</strong>g>of</str<strong>on</strong>g> 2.446 Å. We correlate this<br />
c<strong>on</strong>tracti<strong>on</strong> with theoretically calculated reference values (all-electr<strong>on</strong> density<br />
functi<strong>on</strong>al calculati<strong>on</strong>s based <strong>on</strong> the van der Waals corrected PBE functi<strong>on</strong>al) for the<br />
lattice parameter c<strong>on</strong>tracti<strong>on</strong> induced in ideal, free-standing <str<strong>on</strong>g>graphene</str<strong>on</strong>g> sheets by:<br />
substrate-induced buckling, the edges <str<strong>on</strong>g>of</str<strong>on</strong>g> limited-size flakes, and typical point defects<br />
(m<strong>on</strong>ovacancies, divacancies, St<strong>on</strong>e-Wales defects).<br />
PACS numbers: 61.48.Gh, 68.65.Pq, 81.15.Hi, 71.15.Nc<br />
Keywords: Graphene, <str<strong>on</strong>g>nanocrystalline</str<strong>on</strong>g> <str<strong>on</strong>g>graphene</str<strong>on</strong>g>, silic<strong>on</strong> carbide, buffer layer, molecular beam epitaxy,<br />
grazing incidence diffracti<strong>on</strong>, density functi<strong>on</strong>al theory<br />
1. Introducti<strong>on</strong><br />
Graphene is c<strong>on</strong>sidered to be <str<strong>on</strong>g>of</str<strong>on</strong>g> great importance for future device applicati<strong>on</strong>s due to its outstanding<br />
electr<strong>on</strong>ic properties [1]. Regarding its synthesis, several techniques have been used for the<br />
producti<strong>on</strong> <str<strong>on</strong>g>of</str<strong>on</strong>g> this material [2-9]. Am<strong>on</strong>g them, micro-mechanical cleavage <str<strong>on</strong>g>of</str<strong>on</strong>g> graphite [4], which
allows for the preparati<strong>on</strong> <str<strong>on</strong>g>of</str<strong>on</strong>g> flakes with different numbers <str<strong>on</strong>g>of</str<strong>on</strong>g> <str<strong>on</strong>g>graphene</str<strong>on</strong>g> layers and high structural<br />
quality, is certainly the most popular. However, in spite <str<strong>on</strong>g>of</str<strong>on</strong>g> being very useful for the preparati<strong>on</strong> <str<strong>on</strong>g>of</str<strong>on</strong>g><br />
<str<strong>on</strong>g>graphene</str<strong>on</strong>g> aiming at basic research, this method is unsuitable for industrial applicati<strong>on</strong>s. On the other<br />
hand, techniques such as surface thermal decompositi<strong>on</strong> <str<strong>on</strong>g>of</str<strong>on</strong>g> SiC [5,6] and chemical vapor depositi<strong>on</strong><br />
(CVD) <strong>on</strong> metallic templates [7,8] are promising due to their capability <str<strong>on</strong>g>of</str<strong>on</strong>g> achieving large-area<br />
synthesis. Despite this advantage, they also have inherent drawbacks. With Si depleti<strong>on</strong> <strong>on</strong> SiC it is<br />
possible to produce <str<strong>on</strong>g>graphene</str<strong>on</strong>g> <str<strong>on</strong>g>of</str<strong>on</strong>g> high structural quality <strong>on</strong> both polar hexag<strong>on</strong>al faces <str<strong>on</strong>g>of</str<strong>on</strong>g> SiC. On the<br />
Si-polar face m<strong>on</strong>olayer <str<strong>on</strong>g>graphene</str<strong>on</strong>g> films are thermodynamically stable [9] and can be realized <strong>on</strong> a<br />
wafer scale [6], but the synthesis <str<strong>on</strong>g>of</str<strong>on</strong>g> homogeneous bi- or few-layer <str<strong>on</strong>g>graphene</str<strong>on</strong>g> is still a challenge. For<br />
the C-polar face, a precise c<strong>on</strong>trol <str<strong>on</strong>g>of</str<strong>on</strong>g> the number <str<strong>on</strong>g>of</str<strong>on</strong>g> <str<strong>on</strong>g>grown</str<strong>on</strong>g> layers is difficult to be achieved [10]. By<br />
employing CVD, m<strong>on</strong>olayer <str<strong>on</strong>g>graphene</str<strong>on</strong>g> <strong>on</strong> metals can be routinely fabricated. However, the growth <str<strong>on</strong>g>of</str<strong>on</strong>g><br />
c<strong>on</strong>tinuous few-layer <str<strong>on</strong>g>graphene</str<strong>on</strong>g> has not been dem<strong>on</strong>strated so far. Besides, the required post-synthesis<br />
transfer to a (semi-)insulating substrate <str<strong>on</strong>g>of</str<strong>on</strong>g>ten introduces structural defects in the <str<strong>on</strong>g>graphene</str<strong>on</strong>g> layer,<br />
which may degrade the electr<strong>on</strong>ic properties <str<strong>on</strong>g>of</str<strong>on</strong>g> the material and might therefore limit its technological<br />
applicati<strong>on</strong>.<br />
Molecular beam epitaxy (MBE) is a technique that shows potential to overcome those<br />
drawbacks. It is widely used for the growth <str<strong>on</strong>g>of</str<strong>on</strong>g> high-quality semic<strong>on</strong>ductor films as well as<br />
heterostructures <strong>on</strong> a large variety <str<strong>on</strong>g>of</str<strong>on</strong>g> templates at moderate temperatures (
We here investigate the MBE growth <str<strong>on</strong>g>of</str<strong>on</strong>g> <str<strong>on</strong>g>graphene</str<strong>on</strong>g> <strong>on</strong> the so-called buffer layer (BL) <strong>on</strong> SiC.<br />
This is a (6√3×6√3) R30°-rec<strong>on</strong>structed (0001) surface <str<strong>on</strong>g>of</str<strong>on</strong>g> hexag<strong>on</strong>al SiC, which is isomorphic to<br />
<str<strong>on</strong>g>graphene</str<strong>on</strong>g> (i.e. it possesses similar crystal structure and lattice c<strong>on</strong>stant [22]) but has about 30% <str<strong>on</strong>g>of</str<strong>on</strong>g> its<br />
atoms covalently bound to the SiC substrate [23]. Therefore, due to its similarity to a m<strong>on</strong>olayer <str<strong>on</strong>g>of</str<strong>on</strong>g><br />
<str<strong>on</strong>g>graphene</str<strong>on</strong>g>, we can employ the BL as a template to investigate the quasi-homoepitaxy <str<strong>on</strong>g>of</str<strong>on</strong>g> <str<strong>on</strong>g>graphene</str<strong>on</strong>g> by<br />
MBE. A c<strong>on</strong>siderable advantage <str<strong>on</strong>g>of</str<strong>on</strong>g> using it as a template instead <str<strong>on</strong>g>of</str<strong>on</strong>g> epitaxial m<strong>on</strong>olayer <str<strong>on</strong>g>graphene</str<strong>on</strong>g> is<br />
that results (eg. obtained by Raman spectroscopy) originating from the substrate and from the MBEprepared<br />
<str<strong>on</strong>g>graphene</str<strong>on</strong>g> may be separated in an intuitive way. We dem<strong>on</strong>strate the synthesis <str<strong>on</strong>g>of</str<strong>on</strong>g><br />
<str<strong>on</strong>g>nanocrystalline</str<strong>on</strong>g> <str<strong>on</strong>g>graphene</str<strong>on</strong>g> films whose properties were investigated by atomic force microscopy<br />
(AFM), Raman spectroscopy, X-ray photoelectr<strong>on</strong> spectroscopy (XPS), and synchrotr<strong>on</strong> grazing<br />
incidence X-ray diffracti<strong>on</strong> (GID). Most strikingly, with the latter technique it is observed that the<br />
<str<strong>on</strong>g>graphene</str<strong>on</strong>g> layers grow planar and, despite its <str<strong>on</strong>g>nanocrystalline</str<strong>on</strong>g> nature, possess an in-plane alignment to<br />
the BL/SiC(0001) substrate. In additi<strong>on</strong>, the lattice parameter <str<strong>on</strong>g>of</str<strong>on</strong>g> the MBE-<str<strong>on</strong>g>grown</str<strong>on</strong>g> <str<strong>on</strong>g>graphene</str<strong>on</strong>g> is<br />
measurably c<strong>on</strong>tracted compared to what is expected for a <str<strong>on</strong>g>graphene</str<strong>on</strong>g> plane. For comparis<strong>on</strong>, we<br />
include theoretical values (density-functi<strong>on</strong>al theory; for details see below) for the expected<br />
magnitude <str<strong>on</strong>g>of</str<strong>on</strong>g> a c<strong>on</strong>tracti<strong>on</strong> <str<strong>on</strong>g>of</str<strong>on</strong>g> <str<strong>on</strong>g>graphene</str<strong>on</strong>g> due to a substrate induced buckling or the presence <str<strong>on</strong>g>of</str<strong>on</strong>g> zero- or<br />
<strong>on</strong>e-dimensi<strong>on</strong>al defects.<br />
2. Experimental details<br />
The substrates were prepared in an inductively heated furnace system. First, n-type 6H-SiC(0001)<br />
substrates with a size <str<strong>on</strong>g>of</str<strong>on</strong>g> 1x1cm 2 were chemically cleaned in n-butylacetate, acet<strong>on</strong>e, and methanol<br />
under ultras<strong>on</strong>icati<strong>on</strong>. Afterward, they were loaded into the furnace and etched at 1400 °C for 15 min<br />
in an Ar/H 2 (95/5 vol. %) atmosphere <str<strong>on</strong>g>of</str<strong>on</strong>g> 900 mbar and a flux <str<strong>on</strong>g>of</str<strong>on</strong>g> 500 standard cubic centimeter per<br />
minute (sccm). The etching was performed in order to obtain a stepped SiC surface and removes<br />
scratches and irregularities. The (6√3×6√3) R30° BL was formed <strong>on</strong> the SiC(0001) surface by<br />
thermally treating the samples in the same system at a temperature <str<strong>on</strong>g>of</str<strong>on</strong>g> 1450 °C for 15 min in an Ar<br />
atmosphere <str<strong>on</strong>g>of</str<strong>on</strong>g> 900 mbar and a flux <str<strong>on</strong>g>of</str<strong>on</strong>g> 100 sccm, similar to what has been proposed by Ostler et al.<br />
[24]. Note that at these c<strong>on</strong>diti<strong>on</strong>s the formati<strong>on</strong> <str<strong>on</strong>g>of</str<strong>on</strong>g> m<strong>on</strong>olayer <str<strong>on</strong>g>graphene</str<strong>on</strong>g> inclusi<strong>on</strong>s close to surface<br />
step edges [25] could be str<strong>on</strong>gly suppressed (as verified by Raman spectroscopy). For the MBE<br />
experiments, the backside <str<strong>on</strong>g>of</str<strong>on</strong>g> the substrates was covered with 1 µm thick Ti in order to enable c<strong>on</strong>tactfree<br />
radiative heating in vacuum. Subsequently, the substrates were loaded into a preparati<strong>on</strong> chamber<br />
and degassed in ultra-high-vacuum (UHV) at 350 ºC for 30 min prior to the transfer to the growth<br />
chamber by means <str<strong>on</strong>g>of</str<strong>on</strong>g> a load-lock system. The <str<strong>on</strong>g>graphene</str<strong>on</strong>g> synthesis was carried out in a MBE system in<br />
UHV with a base pressure <str<strong>on</strong>g>of</str<strong>on</strong>g> ~3x10 -10 mbar. Atomic carb<strong>on</strong> was used as a precursor, which is<br />
provided by a current-heated filament made <str<strong>on</strong>g>of</str<strong>on</strong>g> HOPG (MBE Komp<strong>on</strong>enten GmbH). The growth was<br />
performed at a substrate temperature T S <str<strong>on</strong>g>of</str<strong>on</strong>g> 950 °C (calibrated with a pyrometer) with growth times
(∆t) varying between 30 and 240 min. The MBE-prepared samples, as well as pristine substrates [i.e.<br />
BL <strong>on</strong> SiC(0001)], were investigated by n<strong>on</strong>-c<strong>on</strong>tact tapping-mode AFM, Raman spectroscopy with a<br />
spatial resoluti<strong>on</strong> <str<strong>on</strong>g>of</str<strong>on</strong>g> 1 µm and an excitati<strong>on</strong> wavelength <str<strong>on</strong>g>of</str<strong>on</strong>g> 482.5 nm, and XPS using a<br />
m<strong>on</strong>ochromated Al Kα x-ray source. For the latter analysis, prior to the measurements the samples<br />
were annealed at 350 °C for 20 min in UHV in order to remove surface c<strong>on</strong>taminants. Additi<strong>on</strong>ally,<br />
GID measurements were performed at the ID10 beamline <str<strong>on</strong>g>of</str<strong>on</strong>g> the European Synchrotr<strong>on</strong> Radiati<strong>on</strong><br />
Facility (ESRF) with a phot<strong>on</strong> energy <str<strong>on</strong>g>of</str<strong>on</strong>g> 10 keV (∆E/E=10 -4 ). The primary intensity was amounted to<br />
10 14 counts per sec<strong>on</strong>d (cps) at a beam size <str<strong>on</strong>g>of</str<strong>on</strong>g> 100 µm (horiz<strong>on</strong>tal) times 1 mm (vertical) with a<br />
vertically mounted sample and an angle <str<strong>on</strong>g>of</str<strong>on</strong>g> incidence <str<strong>on</strong>g>of</str<strong>on</strong>g> 0.15°.<br />
3. Results and discussi<strong>on</strong><br />
AFM images <str<strong>on</strong>g>of</str<strong>on</strong>g> the substrate and the MBE-<str<strong>on</strong>g>grown</str<strong>on</strong>g> samples are presented in figure 1. Figure 1a shows<br />
the topology <str<strong>on</strong>g>of</str<strong>on</strong>g> a (6√3×6√3) R30°-rec<strong>on</strong>structed SiC surface. Fig 1 (b)-(d) show the surfaces <str<strong>on</strong>g>of</str<strong>on</strong>g><br />
samples after MBE growth, primarily taken <strong>on</strong> a single terrace. In each case, the substrate temperature<br />
was 950 °C with growth times <str<strong>on</strong>g>of</str<strong>on</strong>g> (b) 60 min, (c) 120 min and (d) 240 min. The initial BL-covered<br />
substrate surface c<strong>on</strong>sists <str<strong>on</strong>g>of</str<strong>on</strong>g> atomically smooth terraces (5-10 µm wide) with steps between them<br />
whose heights are 5-10 nm. This overall morphology persists throughout the MBE growth. No further<br />
step bunching or surface graphitizati<strong>on</strong> due to surface thermal decompositi<strong>on</strong> (as c<strong>on</strong>firmed by Raman<br />
spectroscopy) occurs. The surface roughness measured <strong>on</strong> several single terraces increases after MBE<br />
growth (from ~0.8 Å for a pristine BL sample), reaching a root mean square (rms) value <str<strong>on</strong>g>of</str<strong>on</strong>g> ~1.3 Å for<br />
∆t = 120 min and ~3.4 Å for ∆t = 240 min. No surface segregati<strong>on</strong> or island formati<strong>on</strong> is observed<br />
after MBE growth. This indicates that, despite the increased roughness, the MBE-prepared <str<strong>on</strong>g>graphene</str<strong>on</strong>g><br />
layers grow essentially planar <strong>on</strong> top <str<strong>on</strong>g>of</str<strong>on</strong>g> the BL. Note that AFM measurements performed <strong>on</strong> several<br />
surface terraces <str<strong>on</strong>g>of</str<strong>on</strong>g> different samples reveal that no wrinkles or nan<str<strong>on</strong>g>of</str<strong>on</strong>g>ins exist <strong>on</strong> the surface, which is<br />
opposite to what has been observed in <str<strong>on</strong>g>graphene</str<strong>on</strong>g> <str<strong>on</strong>g>grown</str<strong>on</strong>g> by MBE directly <strong>on</strong> epitaxial <str<strong>on</strong>g>graphene</str<strong>on</strong>g> using<br />
cracked ethanol as precursor [26].<br />
Raman measurements performed <strong>on</strong> the center <str<strong>on</strong>g>of</str<strong>on</strong>g> the surface terraces, for samples <str<strong>on</strong>g>grown</str<strong>on</strong>g> at a<br />
temperature <str<strong>on</strong>g>of</str<strong>on</strong>g> 950°C and ∆t between 30 and 240 min, are displayed in figure 2a. Note that the<br />
displayed spectra corresp<strong>on</strong>d to what is obtained after subtracting the SiC- and BL-related background<br />
signals from the raw data. They show the typical <str<strong>on</strong>g>graphene</str<strong>on</strong>g>-related Raman features, namely the defectinduced<br />
D- and D'- lines at ~1380 and ~1610 cm -1 , the normal E 2g mode (aka G-line) at ~1590 cm -1 ,<br />
the double-res<strong>on</strong>ant 2D-line at ~2720 cm -1 , and the sec<strong>on</strong>d order line D+G at ~2970 cm -1 [27].
Figure 1. Atomic force microscopy surface images <str<strong>on</strong>g>of</str<strong>on</strong>g> (a) a BL-covered SiC(0001)<br />
and MBE-<str<strong>on</strong>g>grown</str<strong>on</strong>g> <str<strong>on</strong>g>graphene</str<strong>on</strong>g> films prepared at a substrate temperature <str<strong>on</strong>g>of</str<strong>on</strong>g> 950 °C for<br />
growth times <str<strong>on</strong>g>of</str<strong>on</strong>g> (b) 60 min, (c) 120 min and (d) 240 min.<br />
It is observed that, by increasing growth time, the intensity <str<strong>on</strong>g>of</str<strong>on</strong>g> the <str<strong>on</strong>g>graphene</str<strong>on</strong>g> signal increases<br />
while the peak widths decrease. Especially the double res<strong>on</strong>ant 2D-peak becomes clearly visible for<br />
growth times over 120 min. The full widths at half maximum (FWHM) obtained from the fittings <str<strong>on</strong>g>of</str<strong>on</strong>g><br />
the D, G and 2D peaks, are presented figure 2(b). Overall, the widths decrease m<strong>on</strong>ot<strong>on</strong>ically with<br />
growth time, corresp<strong>on</strong>ding to an increase in structural order <str<strong>on</strong>g>of</str<strong>on</strong>g> the <str<strong>on</strong>g>grown</str<strong>on</strong>g> <str<strong>on</strong>g>graphene</str<strong>on</strong>g> [28]. Only the G-<br />
line FWHM <str<strong>on</strong>g>of</str<strong>on</strong>g> the layer <str<strong>on</strong>g>grown</str<strong>on</strong>g> for 30 minutes, appears as an excepti<strong>on</strong>. This might be due to the fact<br />
that the surface coverage for this film is very low (less than 0.4 ML - see XPS results below).<br />
C<strong>on</strong>sequently, the Raman signal intensity is also very low, which may result in a n<strong>on</strong>-ideal subtracti<strong>on</strong><br />
<str<strong>on</strong>g>of</str<strong>on</strong>g> the SiC- and BL- related backgrounds. In figure 2(c), the intensity ratio (I 2D /I G ) between the 2Dand<br />
the G-line versus growth time is displayed. It increases m<strong>on</strong>ot<strong>on</strong>ically, c<strong>on</strong>firming that the<br />
fracti<strong>on</strong> <str<strong>on</strong>g>of</str<strong>on</strong>g> sp 2 -b<strong>on</strong>ded carb<strong>on</strong> atoms arranged in the <str<strong>on</strong>g>graphene</str<strong>on</strong>g> h<strong>on</strong>eycomb lattice increases with<br />
growth time [28]. The average lateral size (L a ) <str<strong>on</strong>g>of</str<strong>on</strong>g> the <str<strong>on</strong>g>graphene</str<strong>on</strong>g> domains can be determined by taking<br />
into account the width <str<strong>on</strong>g>of</str<strong>on</strong>g> the Raman peaks [29]. For the present case, L a increases from ~5-7 nm for<br />
∆t = 30 min to ~15-20 nm for ∆t = 240 min. These values can be taken as a lower limit for the actual<br />
crystallite sizes, since the model provided by Cançado et al. [29] c<strong>on</strong>sider as defects <strong>on</strong>ly domain<br />
boundaries and not point-like defects (such as vacancies) located within the <str<strong>on</strong>g>graphene</str<strong>on</strong>g> domains. For a<br />
more detailed discussi<strong>on</strong> see Refs. [13,30].
Figure 2. (a) Raman spectra and best fitting curves (the blue <strong>on</strong>es are single<br />
Lorentzians; the red <strong>on</strong>es are the sum <str<strong>on</strong>g>of</str<strong>on</strong>g> them) <str<strong>on</strong>g>of</str<strong>on</strong>g> samples prepared at T S =950 °C with<br />
growth times as indicated in the plot. The spectra background originated from SiC, as<br />
well as that from the BL were removed. The spectra are shifted al<strong>on</strong>g the vertical axis<br />
for better visibility. (b) Full width at half maximum (FWHM) <str<strong>on</strong>g>of</str<strong>on</strong>g> the D-, G- and 2D<br />
lines as a functi<strong>on</strong> <str<strong>on</strong>g>of</str<strong>on</strong>g> growth time. (c) Ratio between the intensities <str<strong>on</strong>g>of</str<strong>on</strong>g> the 2D- and G-<br />
lines as a functi<strong>on</strong> <str<strong>on</strong>g>of</str<strong>on</strong>g> growth time.<br />
XPS measurements were performed in order to determine the number <str<strong>on</strong>g>of</str<strong>on</strong>g> <str<strong>on</strong>g>graphene</str<strong>on</strong>g> layers<br />
<str<strong>on</strong>g>grown</str<strong>on</strong>g> by MBE as well as their b<strong>on</strong>ding ng features. A representative measurement <str<strong>on</strong>g>of</str<strong>on</strong>g> the C1s core level<br />
spectrum is presented in figure 3 for the <str<strong>on</strong>g>graphene</str<strong>on</strong>g> film <str<strong>on</strong>g>grown</str<strong>on</strong>g> <strong>on</strong> the BL/SiC(0001) template for<br />
60 min. Two comp<strong>on</strong>ents <str<strong>on</strong>g>of</str<strong>on</strong>g> the spectrum are related to the BL (S 1 at ~284.70 eV and S 2 at ~285.35<br />
eV). The lower energy comp<strong>on</strong>ent S 1 is due to the covalent b<strong>on</strong>ding between the BL and the SiC,<br />
while S 2 arises due to the sp 2 -b<strong>on</strong>ded carb<strong>on</strong> within the BL [23]. This shows that the BL remains<br />
unaltered during MBE growth even for the l<strong>on</strong>gest employed growth time, as also observed by Raman<br />
spectroscopy (not shown). It also reveals the absence <str<strong>on</strong>g>of</str<strong>on</strong>g> str<strong>on</strong>g interacti<strong>on</strong> (i.e. via covalent b<strong>on</strong>ding)<br />
between the BL and the uppermost MBE-<str<strong>on</strong>g>grown</str<strong>on</strong>g> <str<strong>on</strong>g>graphene</str<strong>on</strong>g>. The comp<strong>on</strong>ent corresp<strong>on</strong>ding to the SiC<br />
bulk is seen at ~ 283.61 eV, while the <strong>on</strong>e at ~284.61 eV is due to carb<strong>on</strong> in the sp 2 b<strong>on</strong>ding<br />
c<strong>on</strong>figurati<strong>on</strong> forming the MBE-<str<strong>on</strong>g>graphene</str<strong>on</strong>g>.<br />
From the intensity ratio between the SiC and <str<strong>on</strong>g>graphene</str<strong>on</strong>g><br />
comp<strong>on</strong>ents (taking into account the existence <str<strong>on</strong>g>of</str<strong>on</strong>g> the BL as well), the thickness <str<strong>on</strong>g>of</str<strong>on</strong>g> the MBE films<br />
could be deduced. It m<strong>on</strong>ot<strong>on</strong>ically increases from ~0.4 m<strong>on</strong>olayers (ML) for ∆t t = 60 min to
1.5 ML for ∆t = 240 min. Hence, more than 120 min are needed to form <strong>on</strong>e complete ML. Finally, it<br />
is observed that the <str<strong>on</strong>g>graphene</str<strong>on</strong>g> peak in the C1s spectrum is shifted to higher binding energies with<br />
respect to the neutral positi<strong>on</strong> (284.45 eV). This means that the layer is n-type doped, similar to what<br />
is measured for m<strong>on</strong>olayer <str<strong>on</strong>g>graphene</str<strong>on</strong>g> produced by surface graphitizati<strong>on</strong> <strong>on</strong> SiC(0001) [31]. However,<br />
the shift <str<strong>on</strong>g>of</str<strong>on</strong>g> ~ 0.15eV observed in the present case is smaller than the values observed for those<br />
samples (~0.3 eV), indicating a reduced amount <str<strong>on</strong>g>of</str<strong>on</strong>g> intrinsic doping in the MBE-<str<strong>on</strong>g>grown</str<strong>on</strong>g> <str<strong>on</strong>g>graphene</str<strong>on</strong>g>. In<br />
some samples, a comp<strong>on</strong>ent related to C-O b<strong>on</strong>ds is found, which indicates that a small amount <str<strong>on</strong>g>of</str<strong>on</strong>g><br />
oxygen is incorporated in the films, probably during the MBE growth process.<br />
Figure 3. C1s core level spectrum <str<strong>on</strong>g>of</str<strong>on</strong>g> a MBE <str<strong>on</strong>g>grown</str<strong>on</strong>g> <str<strong>on</strong>g>graphene</str<strong>on</strong>g> film <strong>on</strong> a BL/SiC(0001)<br />
template. ∆t is 60 min in this case. There are two c<strong>on</strong>tributi<strong>on</strong>s related to the BL (S 1<br />
and S 2 ), a third <strong>on</strong>e related to the SiC bulk, and a fourth <strong>on</strong>e related to the MBE<str<strong>on</strong>g>grown</str<strong>on</strong>g><br />
<str<strong>on</strong>g>graphene</str<strong>on</strong>g> layer.<br />
GID measurements were performed in order to obtain informati<strong>on</strong> about the structure as well as<br />
epitaxial orientati<strong>on</strong> <str<strong>on</strong>g>of</str<strong>on</strong>g> the MBE-<str<strong>on</strong>g>grown</str<strong>on</strong>g> layers. The GID measurements were performed for the clean<br />
"BL" substrate phase as well as for the sample after ∆t = 240 min, where it is certain (as determined<br />
by XPS) that at least <strong>on</strong>e full <str<strong>on</strong>g>graphene</str<strong>on</strong>g> m<strong>on</strong>olayer has formed. Using this technique, the angle <str<strong>on</strong>g>of</str<strong>on</strong>g> x-ray<br />
incidence (0.15°) is slightly smaller than the critical angle <str<strong>on</strong>g>of</str<strong>on</strong>g> total reflecti<strong>on</strong> (0.21°). In that case GID<br />
may serve as an extremely surface sensitive tool, since the x-ray wave-field decays exp<strong>on</strong>entially<br />
within the sample [32]. This enables <str<strong>on</strong>g>investigati<strong>on</strong></str<strong>on</strong>g>s <strong>on</strong> m<strong>on</strong>o- and few-layer <str<strong>on</strong>g>graphene</str<strong>on</strong>g> films. With<br />
GID, the lattice planes orthog<strong>on</strong>al to the sample surface are analyzed by diffracti<strong>on</strong> and informati<strong>on</strong><br />
about in-plane lattice parameters and the in-plane orientati<strong>on</strong> can be obtained. By rotating the sample<br />
with respect to the incident beam, a so-called angular scan is performed. This scan provides a curved<br />
line q a in reciprocal space where every point <strong>on</strong> the curve has the same distance to the origin (00.0).<br />
By varying the azimuthal angle <str<strong>on</strong>g>of</str<strong>on</strong>g> detecti<strong>on</strong> and rotating the sample in a 2:1 ratio, we obtain a radial
scan al<strong>on</strong>g q r , which corresp<strong>on</strong>ds to the length <str<strong>on</strong>g>of</str<strong>on</strong>g> the scattering vector [see figure 4(b)]. In our<br />
experiment we measured reciprocal space maps (RSM) by a combinati<strong>on</strong> <str<strong>on</strong>g>of</str<strong>on</strong>g> angular and radial scans.<br />
This is presented in figure 4(a). The axes are scaled to the reciprocal lattice units (rlu) <str<strong>on</strong>g>of</str<strong>on</strong>g> the<br />
SiC substrate. The reflecti<strong>on</strong>s associated with SiC, BL, and <str<strong>on</strong>g>graphene</str<strong>on</strong>g> appear at the same angular<br />
positi<strong>on</strong>s, revealing that the <str<strong>on</strong>g>graphene</str<strong>on</strong>g> film and the BL are in-plane aligned with the substrate. In<br />
additi<strong>on</strong>, the domains possess the same orientati<strong>on</strong>, since a distributi<strong>on</strong> <str<strong>on</strong>g>of</str<strong>on</strong>g> many randomly oriented<br />
domains would lead to a diffracti<strong>on</strong> ring at the same radial positi<strong>on</strong> in reciprocal space. This result is<br />
the opposite <str<strong>on</strong>g>of</str<strong>on</strong>g> what has been measured for <str<strong>on</strong>g>nanocrystalline</str<strong>on</strong>g> <str<strong>on</strong>g>graphene</str<strong>on</strong>g> <str<strong>on</strong>g>grown</str<strong>on</strong>g> by MBE (using cracked<br />
ethanol as a C precursor) <strong>on</strong> epitaxial <str<strong>on</strong>g>graphene</str<strong>on</strong>g> <strong>on</strong> SiC [14]. In that work, samples analyzed by<br />
reflecti<strong>on</strong> high energy electr<strong>on</strong> diffracti<strong>on</strong> (RHEED) appeared to indicate that the <str<strong>on</strong>g>graphene</str<strong>on</strong>g> domains<br />
formed after MBE growth are not aligned to the underlying epitaxial <str<strong>on</strong>g>graphene</str<strong>on</strong>g> and SiC substrate. The<br />
present GID result also c<strong>on</strong>tradicts the noti<strong>on</strong> that <str<strong>on</strong>g>graphene</str<strong>on</strong>g> synthesized by MBE should generally be<br />
composed <str<strong>on</strong>g>of</str<strong>on</strong>g> nanocrystals that are randomly aligned compared to the substrate [12,15]. In order to<br />
examine a larger angular range we performed line scans with an azimuthal sample rotati<strong>on</strong> <str<strong>on</strong>g>of</str<strong>on</strong>g> 130°<br />
(not shown here). Therein, <strong>on</strong>ly <str<strong>on</strong>g>graphene</str<strong>on</strong>g> (and BL) peaks with a separati<strong>on</strong> <str<strong>on</strong>g>of</str<strong>on</strong>g> 60° emerge with an<br />
intensity that is two orders <str<strong>on</strong>g>of</str<strong>on</strong>g> magnitude higher than the background signal. The fact that the <str<strong>on</strong>g>graphene</str<strong>on</strong>g><br />
films possess <strong>on</strong>ly <strong>on</strong>e crystallographic orientati<strong>on</strong> raises questi<strong>on</strong>s about the limited size <str<strong>on</strong>g>of</str<strong>on</strong>g> the<br />
domains (limited to a few tens <str<strong>on</strong>g>of</str<strong>on</strong>g> nm, as determined by Raman spectroscopy). In fact, the scan in<br />
angular directi<strong>on</strong> over the <str<strong>on</strong>g>graphene</str<strong>on</strong>g> peak reveals a FWHM <str<strong>on</strong>g>of</str<strong>on</strong>g> ~0.5 %, revealing hence a narrow<br />
distributi<strong>on</strong> in the rotati<strong>on</strong>al alignment. This might already be enough to hinder coalescence <str<strong>on</strong>g>of</str<strong>on</strong>g><br />
neighbor islands. Furthermore, due to the relatively low growth temperatures (950 °C), an ineffective<br />
healing <str<strong>on</strong>g>of</str<strong>on</strong>g> defects in the grain boundary regi<strong>on</strong>s, which possibly c<strong>on</strong>tain even localized amorphous<br />
structures, may also be a factor impeding coalescence.<br />
The inset in Fig 4(a) shows the RSM with higher resoluti<strong>on</strong> around the <str<strong>on</strong>g>graphene</str<strong>on</strong>g> (11.0)<br />
reflecti<strong>on</strong>. A splitting in two comp<strong>on</strong>ents can be observed. One <str<strong>on</strong>g>of</str<strong>on</strong>g> the two reflecti<strong>on</strong>s corresp<strong>on</strong>ds to<br />
<str<strong>on</strong>g>graphene</str<strong>on</strong>g> and <strong>on</strong>e to the BL. In figure 4(b) a line scan in radial directi<strong>on</strong> over the split peak is shown.<br />
For comparative purposes a scan <str<strong>on</strong>g>of</str<strong>on</strong>g> a bare BL/SiC sample is also added therein. By comparing these<br />
two scans the R1 peak can unambiguously be attributed to the underlying BL. The <str<strong>on</strong>g>graphene</str<strong>on</strong>g> reflecti<strong>on</strong><br />
[labeled R2 in figure 4(b)] is clearly shifted towards higher q r in comparis<strong>on</strong> to the BL reflecti<strong>on</strong>,<br />
which stands for a smaller lattice parameter in the analyzed in-plane directi<strong>on</strong>. The lattice parameters<br />
derived from figure 4(b) are 2.446 Å and 2.464 Å for the MBE-<str<strong>on</strong>g>grown</str<strong>on</strong>g> <str<strong>on</strong>g>graphene</str<strong>on</strong>g> and the BL,<br />
respectively. This yields a relative mismatch <str<strong>on</strong>g>of</str<strong>on</strong>g> ~0.7%. Interestingly, the lattice parameter <str<strong>on</strong>g>of</str<strong>on</strong>g> the<br />
MBE-<str<strong>on</strong>g>grown</str<strong>on</strong>g> <str<strong>on</strong>g>graphene</str<strong>on</strong>g> is about 0.6% smaller in comparis<strong>on</strong> to the standard lattice parameter <str<strong>on</strong>g>of</str<strong>on</strong>g><br />
graphite (2.461 Å) [33].
(a)<br />
1.0<br />
1.5<br />
-K hex [rlu]<br />
0.5<br />
d<br />
G(10.0)<br />
1.0 1.5<br />
0<br />
q r = 1.25 rlu<br />
SiC(2 1.0)<br />
=2.13 A<br />
G(10.0)<br />
d<br />
G(11.0)<br />
=1.23 A<br />
2.0 H hex [rlu]<br />
q = 2.17 rlu<br />
r<br />
q r<br />
0.1 rlu<br />
2.0<br />
SiC(2 2.0)<br />
G(11.0)<br />
2.48 2.46 2.44 2.42 a [A]<br />
1.24 1.23 1.22 1.21 1.20<br />
Intensity [cps]<br />
10 3 ∆d ||<br />
10 2<br />
10 1<br />
(b)<br />
S1<br />
R1<br />
R2<br />
S2<br />
Graphene/<br />
Buffer layer<br />
10 0<br />
∆q r<br />
Buffer layer<br />
q [rlu]<br />
2.14 2.15 2.16 2.17 2.18 2.19 2.20 2.21 2.22<br />
r<br />
Figure 4. (a) Reciprocal space map <str<strong>on</strong>g>of</str<strong>on</strong>g> MBE-<str<strong>on</strong>g>grown</str<strong>on</strong>g> <str<strong>on</strong>g>nanocrystalline</str<strong>on</strong>g> <str<strong>on</strong>g>graphene</str<strong>on</strong>g> <strong>on</strong> a<br />
BL/SiC(0001) template. The inset shows a higher resoluti<strong>on</strong> map around the <str<strong>on</strong>g>graphene</str<strong>on</strong>g><br />
(11.0) reflecti<strong>on</strong>, revealing a splitting into a BL and a <str<strong>on</strong>g>graphene</str<strong>on</strong>g> reflecti<strong>on</strong>. (b)Radial<br />
scan al<strong>on</strong>g the <str<strong>on</strong>g>graphene</str<strong>on</strong>g> (11.0) directi<strong>on</strong>. The red curve shows a measurement <strong>on</strong><br />
MBE <str<strong>on</strong>g>grown</str<strong>on</strong>g> <str<strong>on</strong>g>graphene</str<strong>on</strong>g>, the black curve presents an according scan <strong>on</strong> a bare BL<br />
sample. The peak positi<strong>on</strong>s <str<strong>on</strong>g>of</str<strong>on</strong>g> the BL (R1) and <str<strong>on</strong>g>graphene</str<strong>on</strong>g> (R2) reflecti<strong>on</strong>s are<br />
indicated by the shaded area.<br />
There are several potential reas<strong>on</strong>s that could cause such a c<strong>on</strong>tracti<strong>on</strong>, am<strong>on</strong>g them: (i) the<br />
c<strong>on</strong>tracti<strong>on</strong> could be related to the different linear thermal expansi<strong>on</strong> coefficients <str<strong>on</strong>g>of</str<strong>on</strong>g> <str<strong>on</strong>g>graphene</str<strong>on</strong>g> and SiC<br />
[34,35]. Based <strong>on</strong> this difference, Ferralis et al. [34] estimated that a compressive strain in <str<strong>on</strong>g>graphene</str<strong>on</strong>g><br />
<str<strong>on</strong>g>of</str<strong>on</strong>g> up to ~ 0.8% can arise up<strong>on</strong> sample cooling down to room temperature, since SiC c<strong>on</strong>tracts during<br />
cooling while <str<strong>on</strong>g>graphene</str<strong>on</strong>g> expands. (ii) The str<strong>on</strong>g corrugati<strong>on</strong> <str<strong>on</strong>g>of</str<strong>on</strong>g> the BL, product <str<strong>on</strong>g>of</str<strong>on</strong>g> its partial covalent<br />
b<strong>on</strong>ding to the SiC [22], could c<strong>on</strong>tribute to the apparent c<strong>on</strong>tracti<strong>on</strong> <str<strong>on</strong>g>of</str<strong>on</strong>g> the (2D projected) lattice<br />
parameter <str<strong>on</strong>g>of</str<strong>on</strong>g> the uppermost <str<strong>on</strong>g>nanocrystalline</str<strong>on</strong>g> <str<strong>on</strong>g>graphene</str<strong>on</strong>g>, despite the existent epitaxial relati<strong>on</strong> between<br />
them. Indeed, recent first-principles calculati<strong>on</strong>s [9] quantify this corrugati<strong>on</strong> <str<strong>on</strong>g>of</str<strong>on</strong>g> epitaxial m<strong>on</strong>olayer<br />
<str<strong>on</strong>g>graphene</str<strong>on</strong>g> films <strong>on</strong> the BL to be approximately 0.4 Å (top to bottom atom in a <str<strong>on</strong>g>graphene</str<strong>on</strong>g> plane<br />
commensurate with a (6√3×6√3) R30° mesh <str<strong>on</strong>g>of</str<strong>on</strong>g> the SiC substrate below). (iii) A lateral c<strong>on</strong>tracti<strong>on</strong> <str<strong>on</strong>g>of</str<strong>on</strong>g><br />
<str<strong>on</strong>g>graphene</str<strong>on</strong>g> could also occur due to the intrinsic presence <str<strong>on</strong>g>of</str<strong>on</strong>g> defects and domain boundaries in the<br />
<str<strong>on</strong>g>nanocrystalline</str<strong>on</strong>g> film. In fact, the str<strong>on</strong>g D peak in the Raman signal for ∆t = 240 min as well as the<br />
small-scale structures seen in the AFM image (see figure 1(d)) would all allow for the presence <str<strong>on</strong>g>of</str<strong>on</strong>g>
zero- or <strong>on</strong>e-dimensi<strong>on</strong>al defects in the films. We estimate the <str<strong>on</strong>g>graphene</str<strong>on</strong>g> film c<strong>on</strong>tracti<strong>on</strong> that would<br />
result from specific defect types and densities by DFT below.<br />
Regarding point (i), strain up to 0.4 % has been inferred by Raman spectroscopy for epitaxial<br />
m<strong>on</strong>olayer <str<strong>on</strong>g>graphene</str<strong>on</strong>g> <str<strong>on</strong>g>grown</str<strong>on</strong>g> by surface thermal decompositi<strong>on</strong> <strong>on</strong> SiC(0001) [36]. A similar<br />
c<strong>on</strong>tracti<strong>on</strong> was directly linked to substrate thermal c<strong>on</strong>tracti<strong>on</strong> in a recent study <str<strong>on</strong>g>of</str<strong>on</strong>g> near-perfect CVD<str<strong>on</strong>g>grown</str<strong>on</strong>g><br />
<str<strong>on</strong>g>graphene</str<strong>on</strong>g> <strong>on</strong> Ir(111) [33]. However, the c<strong>on</strong>tracti<strong>on</strong> observed by us extends to a significantly<br />
smaller lattice parameter than that found in Refs. [33,36]. In a perfect <str<strong>on</strong>g>graphene</str<strong>on</strong>g> plane, we would<br />
expect the c<strong>on</strong>tracti<strong>on</strong> observed by us to induce the formati<strong>on</strong> <str<strong>on</strong>g>of</str<strong>on</strong>g> wrinkles/nan<str<strong>on</strong>g>of</str<strong>on</strong>g>ins for strain relief,<br />
but we observe no such wrinkles in our <str<strong>on</strong>g>graphene</str<strong>on</strong>g> films, according to AFM analysis.<br />
To estimate the possible c<strong>on</strong>tributi<strong>on</strong>s <str<strong>on</strong>g>of</str<strong>on</strong>g> (ii) and (iii), we performed density-functi<strong>on</strong>al theory<br />
(DFT) calculati<strong>on</strong>s <str<strong>on</strong>g>of</str<strong>on</strong>g> isolated <str<strong>on</strong>g>graphene</str<strong>on</strong>g> sheets. The calculati<strong>on</strong>s were performed using the allelectr<strong>on</strong>,<br />
localized basis set code FHI-aims ("tight" settings) [37] and the PBE functi<strong>on</strong>al [38] with a<br />
correcti<strong>on</strong> for van der Waals (vdW) effects, PBE+vdW [39]. At this level <str<strong>on</strong>g>of</str<strong>on</strong>g> theory, the lattice<br />
parameter <str<strong>on</strong>g>of</str<strong>on</strong>g> a perfect, infinite periodic flat <str<strong>on</strong>g>graphene</str<strong>on</strong>g> sheet is a=2.463 Å. The calculated value for<br />
m<strong>on</strong>olayer <str<strong>on</strong>g>graphene</str<strong>on</strong>g> <strong>on</strong> SiC is practically the same (within 0.1%). We note that, while we include the<br />
vdW correcti<strong>on</strong> for c<strong>on</strong>sistency with earlier work [9], it has no str<strong>on</strong>g effect <strong>on</strong> the in-plane lattice<br />
parameters <str<strong>on</strong>g>of</str<strong>on</strong>g> interest here. Even when just using <strong>on</strong>ly the PBE functi<strong>on</strong>al, a=2.467 Å for a perfect<br />
<str<strong>on</strong>g>graphene</str<strong>on</strong>g> sheet. Bey<strong>on</strong>d the original vdW correcti<strong>on</strong> <str<strong>on</strong>g>of</str<strong>on</strong>g> Tkatchenko and Scheffler [39], the strength <str<strong>on</strong>g>of</str<strong>on</strong>g><br />
effective interatomic C 6 coefficients that describe the van der Waals interacti<strong>on</strong> in carb<strong>on</strong>-based<br />
nanostructures may vary c<strong>on</strong>siderably with the structure [40] and could significantly change out-<str<strong>on</strong>g>of</str<strong>on</strong>g><br />
plane interacti<strong>on</strong>s with a <str<strong>on</strong>g>graphene</str<strong>on</strong>g> sheet. However, their effect will still be small <strong>on</strong> the energy scale<br />
<str<strong>on</strong>g>of</str<strong>on</strong>g> interest for the in-plane lattice parameter, which is dominated by the covalent interacti<strong>on</strong>s that are<br />
described by the PBE functi<strong>on</strong>al itself.<br />
To estimate the influence <str<strong>on</strong>g>of</str<strong>on</strong>g> the possible substrate-induced corrugati<strong>on</strong> [point (ii) above], we<br />
proceed as follows. We take the fully relaxed structure <str<strong>on</strong>g>of</str<strong>on</strong>g> a <str<strong>on</strong>g>graphene</str<strong>on</strong>g> sheet with a (13x13) supercell<br />
situated <strong>on</strong> top <str<strong>on</strong>g>of</str<strong>on</strong>g> the "BL", as determined in Ref. [9]; its calculated maximal corrugati<strong>on</strong><br />
perpendicular to the surface (top to bottom atom) amounts to 0.41 Å. The MBE-<str<strong>on</strong>g>grown</str<strong>on</strong>g> <str<strong>on</strong>g>graphene</str<strong>on</strong>g> <strong>on</strong><br />
the BL should show the same approximate corrugati<strong>on</strong>. If this corrugati<strong>on</strong> led to significant stress in<br />
the plane, a perfect <str<strong>on</strong>g>graphene</str<strong>on</strong>g> sheet with the same (fixed) z corrugati<strong>on</strong> should experience the same<br />
stress and should thus c<strong>on</strong>tract. In fact, however, relaxing all in-plane coordinates and lattice<br />
parameters <str<strong>on</strong>g>of</str<strong>on</strong>g> such a <str<strong>on</strong>g>graphene</str<strong>on</strong>g> plane with fixed z corrugati<strong>on</strong> leads to a surface area that corresp<strong>on</strong>ds<br />
to an effective <str<strong>on</strong>g>graphene</str<strong>on</strong>g> lattice parameter <str<strong>on</strong>g>of</str<strong>on</strong>g> a=2.462 Å, i.e., the calculated c<strong>on</strong>tracti<strong>on</strong> is less than<br />
0.05 %.<br />
Finally, we address the potential impact <str<strong>on</strong>g>of</str<strong>on</strong>g> different types <str<strong>on</strong>g>of</str<strong>on</strong>g> defects <strong>on</strong> the in-plane lattice<br />
parameter. Coming to <strong>on</strong>e dimensi<strong>on</strong>al defect types (domain boundaries) first, figure 5 shows the<br />
development <str<strong>on</strong>g>of</str<strong>on</strong>g> the effective lattice parameter <str<strong>on</strong>g>of</str<strong>on</strong>g> finite-size <str<strong>on</strong>g>graphene</str<strong>on</strong>g> flakes as a functi<strong>on</strong> <str<strong>on</strong>g>of</str<strong>on</strong>g> flake<br />
size. The effective lattice parameter is calculated by fully relaxing the flat <str<strong>on</strong>g>graphene</str<strong>on</strong>g> flakes, then taking
the average <str<strong>on</strong>g>of</str<strong>on</strong>g> all C-C nearest-neighbor neighbor b<strong>on</strong>d distances in the flake and c<strong>on</strong>verting this value to the<br />
equivalent lattice parameter <str<strong>on</strong>g>of</str<strong>on</strong>g> a perfect h<strong>on</strong>eycomb mesh. Two different types <str<strong>on</strong>g>of</str<strong>on</strong>g> flakes are<br />
c<strong>on</strong>sidered, i.e., those with a H-saturated boundary and those with no capping atoms at the boundary.<br />
A significant c<strong>on</strong>tracti<strong>on</strong> <str<strong>on</strong>g>of</str<strong>on</strong>g> the effective lattice parameter results in either case. To approach the GID-<br />
observed lattice parameter <str<strong>on</strong>g>of</str<strong>on</strong>g> 2.446 Å (figure 4) by this effect al<strong>on</strong>e, the equivalent saturated flakes<br />
would have to be extremely small (less than 0.7 nm in diameter). The equivalent unsaturated flakes,<br />
however, could be significantly larger: 1.7 nm even if they were perfect otherwise. With increasing<br />
flake size, the net c<strong>on</strong>tracti<strong>on</strong> decreases rapidly for larger sizes.<br />
Figure 5. (a) Calculated (DFT-PBE+vdW) effective lattice parameter (average C-C<br />
b<strong>on</strong>d length) in a series <str<strong>on</strong>g>of</str<strong>on</strong>g> fully relaxed <str<strong>on</strong>g>graphene</str<strong>on</strong>g> flakes <str<strong>on</strong>g>of</str<strong>on</strong>g> finite size with (squares)<br />
and without (circles) hydrogen terminati<strong>on</strong> at the edges. The hydrogen-terminated<br />
flakes are shown in the inset. The lattice parameter <str<strong>on</strong>g>of</str<strong>on</strong>g> a flat, strain-free, periodic<br />
<str<strong>on</strong>g>graphene</str<strong>on</strong>g> sheet calculated in DFT-PBE+vdW is indicated by a dashed line. (b)<br />
Diameter (maximum C-C C distance) <str<strong>on</strong>g>of</str<strong>on</strong>g> the flakes used in Subfigure (a).<br />
Localized zero-dimensi<strong>on</strong>al (point-like) defects can also lead to strain and corrugati<strong>on</strong> in<br />
<str<strong>on</strong>g>graphene</str<strong>on</strong>g> sheets [41,42]. Figure 6 gives quantitative predicti<strong>on</strong>s for the strain, corrugati<strong>on</strong> and net area<br />
change <str<strong>on</strong>g>of</str<strong>on</strong>g> a periodic <str<strong>on</strong>g>graphene</str<strong>on</strong>g> sheet (all calculati<strong>on</strong>s: DFT-PBE+vdW, reciprocal sampling equivalent<br />
to 20×20 or denser with respect to the primitive unit cell, residual forces and stresses below 0.001<br />
eV/Å after complete, stress-tensor tensor based relaxati<strong>on</strong> <str<strong>on</strong>g>of</str<strong>on</strong>g> 2D unit cells, and 50 Å vacuum thickness<br />
between <str<strong>on</strong>g>graphene</str<strong>on</strong>g> sheets in z directi<strong>on</strong>) with well-defined arrays <str<strong>on</strong>g>of</str<strong>on</strong>g> specific comm<strong>on</strong> defect types:<br />
m<strong>on</strong>ovacancies, divacancies, and the St<strong>on</strong>e-Wales defect (for a recent review, c<strong>on</strong>sider, e.g., Ref.<br />
[41]).
Figure 6. Top: Calculated fully relaxed (atomic positi<strong>on</strong>s and unit cell) structure <str<strong>on</strong>g>of</str<strong>on</strong>g> a<br />
<str<strong>on</strong>g>graphene</str<strong>on</strong>g> sheet with a (10×10) periodic arrangement <str<strong>on</strong>g>of</str<strong>on</strong>g> 5-8-5 5 divacancy defects<br />
(atoms highlighted in green). The in-plane supercell and surface normal are indicated<br />
by thin lines. Bottom: DFT-PBE+vdW calculated effective lateral lattice parameter<br />
a eff (in Å), the top-to-bottom corrugati<strong>on</strong> ∆z top-bottom (in Å) and effective area lost<br />
(gained) per defect, ∆A defect (in Å 2 ) <str<strong>on</strong>g>of</str<strong>on</strong>g> different defect types and periodicities in an<br />
ideal, free-standing <str<strong>on</strong>g>graphene</str<strong>on</strong>g> sheet.<br />
M<strong>on</strong>ovacancies are perhaps the most studied point defect type in <str<strong>on</strong>g>graphene</str<strong>on</strong>g> (e.g., Refs. [42-44]<br />
and many references therein). In particular, the relati<strong>on</strong> between theoretically imposed isotropic strain<br />
and m<strong>on</strong>ovacancy properties such as corrugati<strong>on</strong> and spin polarizati<strong>on</strong> has been the subject <str<strong>on</strong>g>of</str<strong>on</strong>g> a<br />
recent, exhaustive study [42]. We here c<strong>on</strong>sider <strong>on</strong>ly the fully relaxed, stress-free local optimum<br />
structures as calculated by DFT-PBE+vdW.<br />
Figure 6 shows that m<strong>on</strong>ovacancies would be associated<br />
with significant strain and corrugati<strong>on</strong>s <str<strong>on</strong>g>of</str<strong>on</strong>g> perfect <str<strong>on</strong>g>graphene</str<strong>on</strong>g> sheets if no spin polarizati<strong>on</strong> were<br />
included. However, m<strong>on</strong>ovacancies are in fact paramagnetic defects that carry a significant local<br />
moment in DFT-PBE+vdW. This leads to a slight reducti<strong>on</strong> <str<strong>on</strong>g>of</str<strong>on</strong>g> the compressive strain compared to a<br />
perfect <str<strong>on</strong>g>graphene</str<strong>on</strong>g> sheet, and thus also to a reducti<strong>on</strong> <str<strong>on</strong>g>of</str<strong>on</strong>g> the overall distorti<strong>on</strong> (buckling <str<strong>on</strong>g>of</str<strong>on</strong>g> the<br />
m<strong>on</strong>ovacancy and corrugati<strong>on</strong> <str<strong>on</strong>g>of</str<strong>on</strong>g> the sheet). Even with 2% m<strong>on</strong>ovacancies [modelled by a (5×5)<br />
periodicity in figure 6], m<strong>on</strong>ovacancies ovacancies al<strong>on</strong>e would not yet lead to the full strain seen in the GID<br />
experiments above.<br />
Am<strong>on</strong>g the other possible point defect types in <str<strong>on</strong>g>graphene</str<strong>on</strong>g>, divacancies are in fact<br />
thermodynamically more stable than m<strong>on</strong>ovacancies [41,45], a tendency that is even enhanced by<br />
compressive strain [46]. The calculated results for divacancies with corrugati<strong>on</strong> shown in figure 6<br />
were obtained by starting from the fully relaxed, n<strong>on</strong>-spinpolarized m<strong>on</strong>ovacancy geometries and
emoving the most str<strong>on</strong>gly buckled atom (in z directi<strong>on</strong>) in the m<strong>on</strong>ovacancy. As can be seen in the<br />
table and the structure <str<strong>on</strong>g>of</str<strong>on</strong>g> the (10×10) divacancy defect in figure 6, this procedure leads to very<br />
significant strains and buckling in a free-standing <str<strong>on</strong>g>graphene</str<strong>on</strong>g> sheet. The sheet curvatures seen at the<br />
defect locati<strong>on</strong>s follow the trend described in the literature [41]. It is also obvious that such defects<br />
could easily explain the GID-observed lateral lattice parameter reducti<strong>on</strong> even for relatively low<br />
defect c<strong>on</strong>centrati<strong>on</strong>s [(10×10) case]. In fact, significant corrugati<strong>on</strong>s <str<strong>on</strong>g>of</str<strong>on</strong>g> this kind are seen in<br />
atomically resolved STM images <str<strong>on</strong>g>of</str<strong>on</strong>g> defects generated in HOPG by i<strong>on</strong> implantati<strong>on</strong> (e.g., figure 1 in<br />
Ref. [47]). However, even if a divacancy were completely flat, the associated strain would still be<br />
significant. For comparis<strong>on</strong>, figure 6 also includes the case <str<strong>on</strong>g>of</str<strong>on</strong>g> a flat, (7×7) periodic divacancy, which<br />
is a local structure optimum about 0.1 eV higher in energy than the corrugated divacancy<br />
arrangement. Even at this defect density, divacancies would be sufficient to explain the observed<br />
strain. Finally, we also include the case <str<strong>on</strong>g>of</str<strong>on</strong>g> the St<strong>on</strong>e-Wales defect, which results from the rotati<strong>on</strong> <str<strong>on</strong>g>of</str<strong>on</strong>g> a<br />
single C-C b<strong>on</strong>d, but the number <str<strong>on</strong>g>of</str<strong>on</strong>g> C atoms remains unchanged. Here, a slight expansi<strong>on</strong>, not<br />
compressi<strong>on</strong>, <str<strong>on</strong>g>of</str<strong>on</strong>g> the overall lattice parameter would result.<br />
Idealized theoretical defects and boundaries are certainly just approximati<strong>on</strong>s to the<br />
experimental reality <str<strong>on</strong>g>of</str<strong>on</strong>g> MBE-<str<strong>on</strong>g>grown</str<strong>on</strong>g> <str<strong>on</strong>g>nanocrystalline</str<strong>on</strong>g> <str<strong>on</strong>g>graphene</str<strong>on</strong>g> films such as those seen in the AFM<br />
image <str<strong>on</strong>g>of</str<strong>on</strong>g> figure 1(d). If defects left over from the growth process really do play a role, the<br />
morphology <str<strong>on</strong>g>of</str<strong>on</strong>g> such films would likely be characterized by a combinati<strong>on</strong> <str<strong>on</strong>g>of</str<strong>on</strong>g> the defect types<br />
c<strong>on</strong>sidered here, as well as others. It thus seems qualitatively plausible that the strain induced by<br />
defects may indeed significantly c<strong>on</strong>tribute to the overall lattice parameter c<strong>on</strong>tracti<strong>on</strong> that we observe<br />
in GID. Eliminating the potential for metastable defects will be important to achieve large-scale<br />
homogeneous electr<strong>on</strong>ic properties <str<strong>on</strong>g>of</str<strong>on</strong>g> epitaxially MBE-<str<strong>on</strong>g>grown</str<strong>on</strong>g> sheets. On the other hand, c<strong>on</strong>trolling<br />
the nature and c<strong>on</strong>centrati<strong>on</strong> <str<strong>on</strong>g>of</str<strong>on</strong>g> defects in a <str<strong>on</strong>g>graphene</str<strong>on</strong>g> sheet during growth may be a promising path<br />
towards strain-engineered <str<strong>on</strong>g>graphene</str<strong>on</strong>g> films.<br />
4. C<strong>on</strong>clusi<strong>on</strong>s<br />
Nanocrystalline <str<strong>on</strong>g>graphene</str<strong>on</strong>g> layers synthesized by MBE <strong>on</strong> (6√3×6√3) R30°-rec<strong>on</strong>structed SiC surfaces<br />
were investigated. Raman spectroscopy measurements indicate an improvement in the structural<br />
quality with increasing growth time. The average size <str<strong>on</strong>g>of</str<strong>on</strong>g> the <str<strong>on</strong>g>graphene</str<strong>on</strong>g> domains exceeds 15 nm for<br />
layers <str<strong>on</strong>g>grown</str<strong>on</strong>g> for 240 min. The (6√3×6√3) R30° BL persists throughout the growth process as<br />
c<strong>on</strong>firmed by XPS measurements, which also reveals that the upper-most MBE-<str<strong>on</strong>g>grown</str<strong>on</strong>g> <str<strong>on</strong>g>graphene</str<strong>on</strong>g><br />
layers c<strong>on</strong>sist <str<strong>on</strong>g>of</str<strong>on</strong>g> sp 2 -b<strong>on</strong>ded carb<strong>on</strong> and thus seems to weakly interact with the underlying BLcovered<br />
substrate. Strikingly, GID measurements reveal that the <str<strong>on</strong>g>graphene</str<strong>on</strong>g> domains are in-plane<br />
aligned to the underlying template and have the same orientati<strong>on</strong>. Therefore, despite its<br />
<str<strong>on</strong>g>nanocrystalline</str<strong>on</strong>g> nature, the layer possesses an epitaxial relati<strong>on</strong> to the substrate. In additi<strong>on</strong>, GID also<br />
shows that the lattice parameter is str<strong>on</strong>gly c<strong>on</strong>tracted. By a first-principles approach for isolated
<str<strong>on</strong>g>graphene</str<strong>on</strong>g> sheets, we derive reference values for the lattice parameter c<strong>on</strong>tracti<strong>on</strong> expected from (i) a<br />
possible substrate-induced buckling, (ii) the edges associated with finite carb<strong>on</strong> flakes (hydrogensaturated<br />
or unsaturated), and (iii) m<strong>on</strong>ovacancies, divacancies and St<strong>on</strong>e-Wales defects in periodic<br />
supercell arrangements in hypothetical, infinite-periodic <str<strong>on</strong>g>graphene</str<strong>on</strong>g> sheets. The calculati<strong>on</strong>s<br />
dem<strong>on</strong>strate that a lattice parameter c<strong>on</strong>tracti<strong>on</strong> will arise from all defects except for the St<strong>on</strong>e-Wales<br />
defect. The largest c<strong>on</strong>tracti<strong>on</strong> is associated with the divacancy, which also induces a significant<br />
buckling in free-standing <str<strong>on</strong>g>graphene</str<strong>on</strong>g> sheets. A low c<strong>on</strong>centrati<strong>on</strong> <str<strong>on</strong>g>of</str<strong>on</strong>g> defects is thus <strong>on</strong>e possible<br />
explanati<strong>on</strong> for the observed c<strong>on</strong>tracti<strong>on</strong>.<br />
Finally, the present results also dem<strong>on</strong>strate the feasibility <str<strong>on</strong>g>of</str<strong>on</strong>g> using MBE as an alternative<br />
method for the c<strong>on</strong>trolled synthesis <str<strong>on</strong>g>of</str<strong>on</strong>g> <str<strong>on</strong>g>graphene</str<strong>on</strong>g> layers directly <strong>on</strong> an insulating substrate.<br />
Nevertheless, it is also clear that the growth c<strong>on</strong>diti<strong>on</strong>s (e.g. substrate temperature) have to be<br />
optimized in order to allow the preparati<strong>on</strong> <str<strong>on</strong>g>of</str<strong>on</strong>g> layers with higher structural quality, i.e. domains<br />
exceeding hundreds <str<strong>on</strong>g>of</str<strong>on</strong>g> nanometers in size and lower defect c<strong>on</strong>centrati<strong>on</strong>.<br />
5. Acknowledgment<br />
The authors would like to thank K. Biermann for the critical reading <str<strong>on</strong>g>of</str<strong>on</strong>g> the manuscript; H.-P.<br />
Schönherr, M. Höricke, and C. Herrmann for technical support. The authors thank the ESRF for<br />
providing beamtime during project SI-2449 and Roberto Nervo for this support during the<br />
experiment. This work was supported by the European Uni<strong>on</strong> within the project C<strong>on</strong>ceptGraphene<br />
(Grant Number 257829).<br />
6. References<br />
[1] Kim K, Choi J-Y, Kim T, Cho S-H and Chung H-J 2011 Nature 479 338<br />
[2] Stankovich S, Dikin D A, Piner R D, Kohlhaas K A, Kleinhammes A, Jia Y, Wu Y, Nguyen S T<br />
and Ru<str<strong>on</strong>g>of</str<strong>on</strong>g>f R S 2007 Carb<strong>on</strong> 45 1558<br />
[3] Kosynkin D V, Higginbotham A L, Sinitskii A, Lomeda J R, Dimiev A, Price B K and Tour J M<br />
2009 Nature 458 872<br />
[4] Novoselov K S, Geim A K, Morozov S V, Jiang D, Zhang Y, Dub<strong>on</strong>os S V, Grigorieva I V and<br />
Firsov A A 2004 Science 306 666<br />
[5] De Heer W A, Berger C, Ruan M, Sprinkle M, Li X, Hu Y, Zhang B, Hankins<strong>on</strong> J and C<strong>on</strong>rad E<br />
2011 Proc. <str<strong>on</strong>g>of</str<strong>on</strong>g> the Natl. Acad. Sci. USA 108 16900<br />
[6] Emtsev K V, Bostwick A, Horn K, Jobst J, Kellogg G L, Ley L, JMcChesney J L, Ohta T,<br />
Reshanov S A, Röhrl J, Rotenberg E, Schmid A K, Waldmann D, Weber H B and Seyller T<br />
2009 Nat. Mater. 8 203<br />
[7] Sutter P W, Flege J-I and Sutter E 2008 Nat. Mater. 7 406
[8] Reina A, Jia X, Ho J, Nezich D, S<strong>on</strong> H, Bulovic V, Dresselhaus M S and K<strong>on</strong>g J 2009 Nano Lett.<br />
9 30<br />
[9] Nemec L, Blum V, Rinke P and Scheffler M 2013 Phys. Rev. Lett. 111 065502.<br />
[10] Srivastava N, He G, Mende P C, Feenstra R M and Sun Y 2012 J. Phys. D: Appl. Phys. 45<br />
154001<br />
[11] Hashimoto M, Trampert A, Herfort J and Ploog K H 2011 J. Vac. Sci. Technol., B 25(4) 1453<br />
[12] Jerng S K, Yu D S, Kim Y S, Ryou J, H<strong>on</strong>g S, Kim C, Yo<strong>on</strong> S, Efetov D K, Kim P and Chun S<br />
H 2011 J. Phys. Chem. C 115 4491<br />
[13] Oliveira Jr. M H, Schumann T, Gargallo R, Fromm F, Seyller T, Ramsteiner M, Trampert A,<br />
Geelhaar J, Lopes J M J and Riechert H 2013 Carb<strong>on</strong> 56 339<br />
[14] Maeda F and Hibino H 2010 Jpn. J. Appl. Phys. 49 04DH13<br />
[15] Wurstbauer U, Schiros T, Jaye C, Plaut A S, He R, Rigosi A, Gutiérrez C, Fischer D, Pfeiffer L<br />
N, Pasupathy A N, Pinczuk A and Garcia J M 2012 Carb<strong>on</strong> 50 4822<br />
[16] Garcia J M, Wurstbauer U, Levy A, Pfeiffer L N, Pinczuk A, Plaut A S, Wang L, Dean C R,<br />
Buizza R, Van Der Zande A, H<strong>on</strong>e J, Watanabe K and Taniguchi T 2012 Solid State Commun.<br />
152 975<br />
[17] Al-Temimy A, Riedl C, Starke U 2009 Appl. Phys. Lett. 95 231907<br />
[18] Moreau E, Godey S, Ferrer F J, Vignaud D, Wallart X, Avila J, Asensio M C, Bournel F and<br />
Gallet J-J 2010 Appl. Phys. Lett. 97 241907<br />
[19] Maeda F and Hibino H 2010 Physica Status Solidi (B) 247 916<br />
[20] Hackley J, Ali D, DiPasquale J, Demaree J D and Richards<strong>on</strong> C J K 2009 Appl. Phys. Lett. 95<br />
133114<br />
[21] Lippert G, Dabrowski J, Yamamoto Y, Herziger F, Maultzsch J, Lemme M C, Mehr W and<br />
Lupina G 2013 Carb<strong>on</strong> 52 40<br />
[22] Goler S, Coletti C, Piazza V, Pingue P, Colangelo F, Pellegrini V, Emtsev K V, Forti S, Starke<br />
U, Beltram F and Heun S 2013 Carb<strong>on</strong> 51 249<br />
[23] Emtsev K V, Speck F, Seyller T, Ley L and Riley J 2008 Phys. Rev. B 77 1<br />
[24] Ostler M, Speck F, Gick M and Seyller T 2010 Phys. Status Solidi B 247 2929<br />
[25] Fromm F, Oliveira Jr. M H, Molina-Sanchez A, Hundhausen M, Lopes J M J, Riechert H,<br />
Wirtz L and Seyller T 2013 New J. Phys. 15 043031<br />
[26] Maeda F and Hibino H 2011 J. Phys. D: Appl. Phys. 44<br />
[27] Malard L M, Pimenta M A, Dresselhaus G and Dresselhaus M S 2009 Phys. Rep. 473 51<br />
[28] Ferrari A C 2007 Solid State Commun. 143 47<br />
[29] Cançado L G, Jorio A and Pimenta M 2007 Phys. Rev. B 76 064304<br />
[30] Eckmann A, Felten A, Mishchenko A, Britnell L, Krupke R, Novoselov K S and Casiraghi C<br />
2012 Nano Lett. 12 3925
[31] Oliveira Jr. M H, Schumann T, Fromm F, Koch R, Ostler M, Ramsteiner M, Seyller T, Lopes J<br />
M J and Riechert H 2013 Carb<strong>on</strong> 52 83<br />
[32] Robins<strong>on</strong> I K and Tweet D J 1992 Rep. Prog. Phys. 55 599<br />
[33] Hattab H, N’Diaye A T, Wall D, Klein C, Jnawali G, Coraux J, Busse C, van Gastel R, Poelsema<br />
B, Michely T, Meyer zu Heringdorf F-J and Horn-v<strong>on</strong> Hoegen M 2012 Nano Lett. 12 678<br />
[34] Ferralis N, Maboudian R and Carraro C 2008 Phys. Rev. Lett. 101 156801<br />
[35] Röhrl J, Hundhausen M, Emtsev K V, Seyller Th, Graupner R and Ley L 2008 Appl. Phys. Lett.<br />
92 201918<br />
[36] Schmidt D A, Ohta T and Beechem T E 2011 Phys. Rev. B 84 235422<br />
[37] Blum V, Gehrke R, Hanke F, Havu P, Havu V, Ren X, Reuter K and Scheffler M 2008 Comput.<br />
Phys. Commun. 180 2175<br />
[38] Perdew J P, Burke K and Ernzerh<str<strong>on</strong>g>of</str<strong>on</strong>g> M 1997 Phys. Rev. Lett. 78 1396<br />
[39] Tkatchenko A and Scheffler M 2009 Phys. Rev. Lett. 102 073005<br />
[40] Gobre V and Tkatchenko A 2013 submitted to Nat. Commun. (Preprint at: http://th.fhiberlin.mpg.de/site/uploads/Publicati<strong>on</strong>s/paper2_20130524.pdf)<br />
[41] Carlss<strong>on</strong> J M, "Simulati<strong>on</strong>s <str<strong>on</strong>g>of</str<strong>on</strong>g> the <str<strong>on</strong>g>Structural</str<strong>on</strong>g> and Chemical Properties <str<strong>on</strong>g>of</str<strong>on</strong>g> Nanoporous Carb<strong>on</strong>",<br />
in: L. Colombo and A. Fasolino (eds.), "Computer-Based Modeling <str<strong>on</strong>g>of</str<strong>on</strong>g> Novel Carb<strong>on</strong> Systems<br />
and Their Properties", Series: "Carb<strong>on</strong> Materials: Chemistry and Physics 3", Springer<br />
Science+Business Media B.V. 2010, pp. 79-128.<br />
[42] Santos E J G, Riik<strong>on</strong>en S, Sanchez-Portal D and Ayuela A 2012 J. Phys. Chem. C 116 7602<br />
[43] Roberts<strong>on</strong> A W, M<strong>on</strong>tanari B, He K, Allen C S, Wu Y A, Harris<strong>on</strong> N M, Kirkland A I and<br />
Warner J H 2013 ACS Nano 7(5) 4495.<br />
[44] Araujo P T, Terr<strong>on</strong>es M and Dresselhaus M S 2012 Mater. Today 15 98<br />
[45] Carlss<strong>on</strong> J M and Scheffler M 2006 Phys. Rev. Lett. 96 046806<br />
[46] Carlss<strong>on</strong> J 2013 private communicati<strong>on</strong><br />
[47] Lucchese M M, Stavale F, Martins Ferreira E H, Vilani C, Moutinho M V O, Capaz R B, Achete<br />
C A and Jorio A 2010 Carb<strong>on</strong> 48 1592