PDF (6M) - Isaac Newton Group of Telescopes - Instituto de ...
PDF (6M) - Isaac Newton Group of Telescopes - Instituto de ...
PDF (6M) - Isaac Newton Group of Telescopes - Instituto de ...

You also want an ePaper? Increase the reach of your titles
YUMPU automatically turns print PDFs into web optimized ePapers that Google loves.
THE MEDIUM-RESOLUTION INT LIBRARY<br />
OF EMPIRICAL SPECTRA<br />
A project aimed at improving the existing tools for<br />
extracting stellar population information using the optical<br />
region <strong>of</strong> composite spectra was started by a team <strong>of</strong><br />
astronomers mainly using the IDS spectrograph on the<br />
INT. Although the main motivation <strong>of</strong> this work was to use<br />
this new calibration to study the stellar content <strong>of</strong> galaxies<br />
using spectra <strong>of</strong> unresolved stellar populations, it was<br />
anticipated that the material could also be useful in other<br />
areas <strong>of</strong> astronomy.<br />
This inclu<strong>de</strong>d a new stellar library (MILES – the Mediumresolution<br />
<strong>Isaac</strong> <strong>Newton</strong> telescope Library <strong>of</strong> Empirical<br />
Spectra), a set <strong>of</strong> homogeneous atmospheric parameters,<br />
a re<strong>de</strong>finition and recalibration <strong>of</strong> spectral-line indices,<br />
empirical fitting functions <strong>de</strong>scribing the behaviour <strong>of</strong><br />
indices with stellar parameters, and stellar population<br />
mo<strong>de</strong>l predictions.<br />
A comprehensive spectral library with medium-to-high<br />
resolution and a good coverage <strong>of</strong> the<br />
Hertzsprung–Russell (HR) diagram is an essential tool in<br />
several areas <strong>of</strong> astronomy. In particular, this is one <strong>of</strong> the<br />
most important ingredients <strong>of</strong> stellar population synthesis,<br />
providing the behaviour <strong>of</strong> individual stellar spectra as a<br />
function <strong>of</strong> temperature, gravity and chemical abundances.<br />
Unfortunately, the empirical libraries inclu<strong>de</strong>d in this kind <strong>of</strong><br />
mo<strong>de</strong>ls up to now, contained few stars with non-solar<br />
metallicity, compromising the accuracy <strong>of</strong> predictions at<br />
low and high metallicity. This problem has usually been<br />
partially solved by using empirical fitting functions,<br />
polynomials that relate the stellar atmospheric parameters<br />
(T eff<br />
, log g, and [Fe/H]) to measured equivalent widths.<br />
These functions allow the inclusion <strong>of</strong> any star required by<br />
the mo<strong>de</strong>l (but within the stellar atmospheric parameter<br />
ranges covered by the functions), using a smooth<br />
interpolation.<br />
difficult to achieve in practice, due to the wavelength<strong>de</strong>pen<strong>de</strong>nt<br />
flux losses caused by differential refraction<br />
when a narrow slit is used in or<strong>de</strong>r to obtain a fair spectral<br />
resolution.<br />
Another important caveat in the interpretation <strong>of</strong> the<br />
composite spectrum <strong>of</strong> a given galaxy is the difficulty <strong>of</strong><br />
disentangling the effects <strong>of</strong> age and metallicity. Due to<br />
blending effects, this problem is worsened when working at<br />
low spectral resolution, as is the case when low-resolution<br />
stellar libraries are used. There are a few studies that have<br />
attempted to inclu<strong>de</strong> spectral features at higher resolution.<br />
However, predicting such high-dispersion SEDs is very<br />
difficult owing to the unavailability <strong>of</strong> a library with the<br />
required input spectra.<br />
Whilst the new generation <strong>of</strong> large telescopes are already<br />
gathering high-quality spectra for low- and high-redshift<br />
galaxies, the stellar population mo<strong>de</strong>ls suffer from a lack <strong>of</strong><br />
extensive empirical stellar libraries to successfully interpret<br />
the observational data. At the moment, the available stellar<br />
libraries have important shortcomings, such as a small<br />
number <strong>of</strong> stars, poor coverage <strong>of</strong> atmospheric<br />
parameters, narrow spectral ranges, low-resolution and<br />
non-flux-calibrated response curves.<br />
The MILES library overcomes some <strong>of</strong> the limitations <strong>of</strong> the<br />
previous libraries. The new library covers the spectral<br />
range 3525–7500 Å at spectral resolution <strong>of</strong> 2.3 Å [full<br />
width at half-maximum (FWHM)]. The spectra <strong>of</strong> 985 stars<br />
with metallicities ranging from [Fe/H]~ –2.7 to +1.0 and a<br />
wi<strong>de</strong> range <strong>of</strong> temperatures were obtained using the IDS<br />
spectrograph on the INT over a total <strong>of</strong> 25 nights in 5<br />
different runs.<br />
However, the new generation <strong>of</strong> stellar population mo<strong>de</strong>ls<br />
go beyond the prediction <strong>of</strong> individual features for a simple<br />
stellar population, and they attempt to synthesise full<br />
spectral energy distributions (SEDs). In this case, the<br />
fitting functions cannot be used, and a library <strong>of</strong> stars<br />
covering the full range <strong>of</strong> atmospheric parameters in an<br />
ample and homogeneous way was urgently <strong>de</strong>man<strong>de</strong>d.<br />
Moreover, although the evolutionary synthesis co<strong>de</strong>s do<br />
not require absolute fluxes, the different stellar spectra<br />
must be properly flux calibrated in a relative sense so that<br />
the whole SED can be mo<strong>de</strong>lled. This, however, is quite<br />
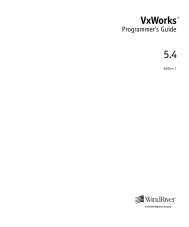
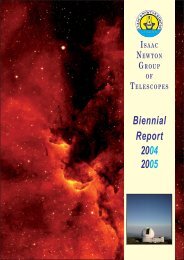
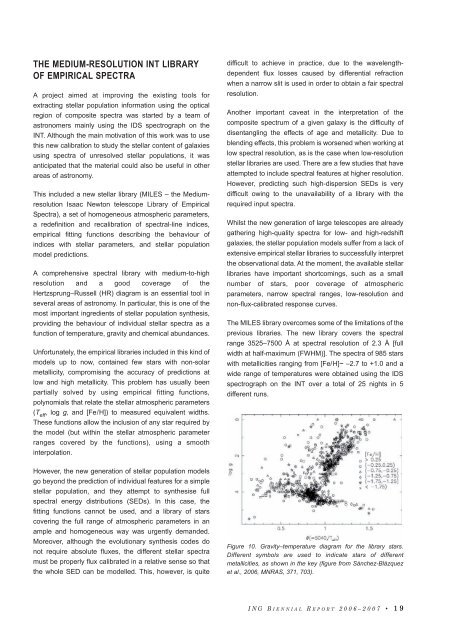
Figure 10. Gravity–temperature diagram for the library stars.<br />
Different symbols are used to indicate stars <strong>of</strong> different<br />
metallicities, as shown in the key (figure from Sánchez-Blázquez<br />
et al., 2006, MNRAS, 371, 703).<br />
ING BIENNIAL R EPORT 2006–2007 • 19