Elio D'Amato presentation - Australian Investors Association
Elio D'Amato presentation - Australian Investors Association
Elio D'Amato presentation - Australian Investors Association

Create successful ePaper yourself
Turn your PDF publications into a flip-book with our unique Google optimized e-Paper software.
Fundamental Analysis –<br />
The bottom up approach<br />
<strong>Elio</strong> D’Amato<br />
Chief Executive Officer<br />
AIA Conference - Sydney<br />
1 September 2011
Important information<br />
This <strong>presentation</strong> is provided for educational purposes only and has been prepared<br />
without taking into account your personal circumstances, and you should therefore<br />
consider its appropriateness in light of your objectives, financial situation and needs,<br />
before acting on it. Investments can go up and down.<br />
Information in this <strong>presentation</strong> is current as at date of <strong>presentation</strong> unless otherwise<br />
stated. However, please bear in mind that shares or other investments may go up or<br />
down in value, that past performance may not be repeated and that such information is<br />
no guarantee of future performance.<br />
For further ‘Important Information’ (e.g. relating to the Lincoln <strong>Australian</strong> Share Fund,<br />
Testimonials, Disclosures of Interest and other disclaimers), please refer to the<br />
“Important Information” section at the end of this <strong>presentation</strong>.
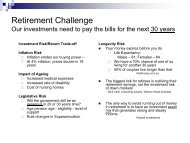
How do you ‘fundamental’?<br />
Two approaches:<br />
• Top down<br />
• Start with the big picture (e.g. favourable markets)<br />
• Drill down multiple levels to individual stock<br />
selection that meets all the above criteria<br />
• Bottom up<br />
• Assess quality companies first and foremost<br />
• Consider broader factors secondary to core<br />
company’s business<br />
3
Bottom up analysis<br />
“The key to investing is not assessing how much<br />
an industry is going to affect society, or how<br />
much it will grow, but rather determining the<br />
competitive advantage of any given company<br />
and, above all, the durability of that advantage.”<br />
Warren Buffett<br />
4
Bottom up analysis<br />
• So how do we apply this analysis?<br />
• Financial Health – examine the financial structure of<br />
the business<br />
• Performance – consider management’s historical<br />
performance and its drivers<br />
• Company assessment – understand how the<br />
business works, the sector it operates within and<br />
assess its future going forward<br />
• Valuation – quantify the value of the company,<br />
accommodating for growth prospects going forward<br />
5
Financial Health<br />
6
Understanding financial statements<br />
To be able to assess the Financial Health of<br />
a company, it is first necessary to<br />
understand the different financial statements<br />
• Profit and Loss statement<br />
• Balance Sheet<br />
• Cash Flow statement<br />
7
Profit and Loss statement<br />
• The Profit and Loss statement (P&L) is also referred<br />
to as the ‘Income Statement’<br />
• It gives a summary of a company’s revenues and<br />
expenses for a specified period of time<br />
• The most important figure generated is the Net<br />
Income and Earnings Per Share (EPS)<br />
• Remove significant items and focus only on<br />
recurring items to get a better picture<br />
8
Balance Sheet<br />
• The Balance Sheet is also referred to as a<br />
‘Statement of Financial Position’<br />
• It lists a company’s Assets, Liabilities and<br />
Shareholders’ Equity as at a particular point in<br />
time<br />
9
Cash Flow statement<br />
• The Cash Flow statement shows the movements<br />
of cash and cash equivalents as affected by<br />
changes in a company’s income and balance<br />
sheet accounts<br />
• It is usually divided into three parts:<br />
• Cash flows from Operations<br />
• Cash flows from Investing Activities<br />
• Cash flows from Financing Activities<br />
10
Financial ratios<br />
• The task of determining the<br />
health of a listed company by<br />
looking at financial statements<br />
seems daunting<br />
• But it doesn’t really require special training or<br />
countless hours of research!<br />
• Even the novice investor can make sense of a<br />
listed company’s Balance Sheet, Profit and Loss<br />
and Cash Flow statement by using financial ratios<br />
11
Financial ratio analysis<br />
What is financial ratio analysis?<br />
12<br />
• When we take a financial figure and look at it relative to another<br />
financial figure<br />
• These ratios simplify the process of determining the health of a<br />
listed company and make reported financial information more<br />
meaningful and useful for investors<br />
• It allows for comparison with previous years, other companies and<br />
the industry sector<br />
• First popularised by Benjamin Graham (considered by many as the<br />
‘Father of fundamental analysis’)<br />
• Ratios can measure many factors of a business
Liquidity ratios<br />
• Liquidity ratios indicate whether a company has<br />
the ability to pay off short-term debt obligations<br />
(debts due to be paid within one year) as they<br />
fall due<br />
• Generally, a higher value is desired as this<br />
indicates greater capacity to meet debt<br />
obligations<br />
13
Liquidity ratios<br />
Operating Cash Flow to Current Liabilities (OCFCL)<br />
• Operating cash flow to current liabilities pertains to the<br />
cash generated from the operations of a company<br />
(revenues less all operating expenses, plus<br />
depreciation), in relation to short-term debt obligations<br />
• Operating cash flow is a more accurate measure of a<br />
company’s profitability than net income because it only<br />
deducts actual cash expenses and therefore<br />
demonstrates the strength of a company’s operations<br />
• Consistently negative operating cash flow implies a<br />
business is going backwards in relation to the cost to<br />
conduct ordinary operations<br />
14
Liquidity ratios<br />
OCFCL ratio<br />
Formula:<br />
OCFCL Ratio =<br />
Operating Cash Flow<br />
Current Liabilities<br />
• The higher the value of the OCFCL ratio, the lower<br />
the level of risk<br />
• A high value indicates that the company generates<br />
sufficient cash from its operations to cover shortterm<br />
liabilities<br />
15
Financial Health exercise<br />
OCFCL ratio<br />
Example: RCG Corporation Limited (RCG) – Rounded to ‘000s<br />
OCFCL Ratio =<br />
$7,690<br />
$9,409<br />
OCFCL Ratio =<br />
0.82<br />
16
Liquidity ratios<br />
Cash Balance to Total Liabilities (CBTL)<br />
• Measures a company’s ability to meet total debt commitments<br />
using its current cash balance<br />
• This measures the company’s ability to absorb liquidity shocks<br />
should profitability drop or debt covenants breached<br />
• A lower value indicates a company may be susceptible to failing<br />
to meet its commitments due to low cash reserves<br />
17
Liquidity ratios<br />
CBTL ratio<br />
Formula:<br />
CBTL =<br />
Cash Balance<br />
Total Liabilities<br />
• A ratio of 1 is usually considered the benchmark,<br />
but could vary across industries<br />
• A ratio of less than 1 suggests the company may not<br />
have sufficient resources to settle its debt<br />
obligations if they fell due today<br />
18
Financial Health exercise<br />
CBTL ratio<br />
Example: RCG Corporation Limited (RCG) – Rounded to ‘000s<br />
CBTL =<br />
$17,172<br />
$10,067<br />
Current Ratio =<br />
1.70<br />
19
Leverage ratios<br />
• Leverage ratios, also referred to as gearing<br />
ratios, measure the extent to which a company<br />
utilises debt to finance growth<br />
• Can provide an indication of a company’s longterm<br />
solvency<br />
• While most financial experts will acknowledge<br />
that debt is a cheaper form of financing than<br />
equity, debt carries risks and investors need to<br />
be aware of the extent of this risk<br />
20
Leverage ratios<br />
Total Liabilities to Total Tangible Assets (TLTAI)<br />
• Provides an indication of a company’s capital<br />
structure and whether the company is more reliant on<br />
borrowings (debt) or shareholder capital (equity) to<br />
fund assets and activities<br />
• Contrary to what many believe, debt is not necessarily<br />
a bad thing. Debt can be positive, provided it is used<br />
for productive purposes such as purchasing assets<br />
and improving processes to increase net profits<br />
• Acceptable TLTAI ratios may also vary across<br />
industries<br />
21
Leverage ratios<br />
TLTAI ratio<br />
Formula:<br />
TLTAI Ratio =<br />
Total Liabilities<br />
Total Assets - Intangibles<br />
• A higher ratio generally indicates greater risk<br />
• Greater debt can result in volatile earnings due to<br />
additional interest expense as well as increased<br />
vulnerability to business downturns<br />
22
Financial Health exercise<br />
TLTAI ratio<br />
Example: RCG Corporation Limited (RCG)<br />
TLTAI Ratio =<br />
$10,067<br />
($53,215 – $18,642)<br />
TLTAI Ratio = 0.29<br />
23
Leverage ratios<br />
Interest Cover ratio<br />
• A company’s interest cover ratio measures its ability<br />
to meet interest expenses on debt using profits<br />
• Generally, a ratio of greater than two is regarded as a<br />
healthy position to cover interest<br />
Formula:<br />
Interest Cover Ratio =<br />
Net Profit Before<br />
Tax + Interest<br />
(EBIT)<br />
Interest<br />
24
Financial Health exercise<br />
Interest Cover ratio<br />
Example: RCG Corporation Limited (RCG) – Rounded to ‘000s<br />
Interest Cover Ratio =<br />
Interest Cover Ratio =<br />
133.27<br />
$13,024 - $97<br />
$97<br />
25
Financial Health exercise<br />
• Summary RCG Corporation Limited (RCG)<br />
• OCFCL ratio: 0.82<br />
• CBTL ratio: 1.70<br />
• TLTAI ratio: 0.29<br />
• Interest Cover ratio: 133.27<br />
• What does this tell us about RCG as a whole?<br />
26<br />
The company is a profit-making that has little interest<br />
bearing debt. RCG generates sufficient cash flow in a<br />
year to repay short term obligations. RCG has<br />
excellent debt-serving ability on the back of its very<br />
strong interest cover (ie no debt)
Performance<br />
27
Assessing company performance<br />
• Also an assessment of management performance<br />
• Can be carried out by reviewing some profitability<br />
ratios<br />
• Should be compared across time and against<br />
industry peers<br />
• May also be compared against companies globally<br />
within the same industry<br />
28
Management assessment<br />
Return on Assets (ROA)<br />
29<br />
• ROA is a measurement of management performance<br />
• It tells the investor how well a company uses its<br />
assets to generate income<br />
• Technically, a company should produce an ROA<br />
higher than the risk free rate of return to be rewarded<br />
for the additional risks involved in operating the<br />
business. If a company’s ROA is equal or even less<br />
than the risk free rate, investors should think twice as<br />
they would be better off just purchasing a bond with a<br />
guaranteed yield
Management assessment<br />
Return on Assets<br />
Formula:<br />
Return on Assets =<br />
Net Income<br />
Average Total Assets<br />
• A higher ROA denotes a higher level of management<br />
performance but must still be compared with peers<br />
• A rising ROA may initially appear good but can turn<br />
out to be unimpressive if other companies in its<br />
industry have been posting higher returns and greater<br />
improvements in ROA<br />
30
Management assessment<br />
Return on Assets<br />
Example: RCG Corporation Limited (RCG) – Rounded to ‘000s<br />
Return on Assets =<br />
Return on Assets =<br />
17.5%<br />
$8,937<br />
($53,215 + $49,453) / 2<br />
31
Management assessment<br />
Return on Equity (ROE)<br />
• ROE is another measurement of management<br />
performance<br />
• It tells the investor how well a company has used<br />
capital from shareholders to generate profits<br />
32
Management assessment<br />
Return on Equity<br />
Formula:<br />
Return on Equity =<br />
Net Income<br />
Average Shareholders’ Equity<br />
• Similar to the ROA ratio, a higher ROE denotes a<br />
higher level of management performance<br />
33
Management assessment<br />
Return on Equity<br />
Example: RCG Corporation Limited (RCG) – Rounded to ‘000s<br />
Return on Equity =<br />
$8,937<br />
($43,148 + $42,152) / 2<br />
Return on Equity =<br />
21%<br />
34
Management assessment<br />
Earnings growth<br />
• Another way to gauge management’s performance is<br />
to look at a company earnings growth<br />
• Net profit after tax may be used but a better indicator<br />
would be Earnings Per Share (EPS) as this would<br />
take into account any increases in the number of<br />
shares<br />
• Look for an increasing trend as this would indicate<br />
improvement in shareholder value<br />
• Can apply a minimum target e.g. EPS growth > 8%<br />
35
Management assessment<br />
EPS growth<br />
Formula:<br />
EPS growth =<br />
EPS Present - EPS Previous<br />
EPS Previous<br />
• Should be observed over several periods<br />
• Look for companies with consistent EPS growth<br />
• Prefer increasing EPS growth trend<br />
36
Management assessment<br />
Earnings Growth<br />
Example: RCG Corporation Limited (RCG)<br />
EPS Growth =<br />
(3.65 – 2.84 cents)<br />
2.84 cents<br />
EPS Growth =<br />
29%<br />
37
Profitability ratios<br />
Gross Profit margin<br />
• Gross profit margin tells us what percentage of a<br />
company's sales revenue would remain after<br />
deducting the cost of goods sold<br />
• This is important as it helps to determine whether the<br />
company would still have enough funds to cover<br />
operating expenses such as employee benefits, lease<br />
payments, advertising, and so on<br />
38
Profitability ratios<br />
Gross Profit margin<br />
Formula:<br />
Gross Profit margin =<br />
Sales – Cost of Sales<br />
Sales<br />
• A company’s gross profit margin may also be<br />
viewed as a measurement of production efficiency<br />
• A company with a gross profit margin higher than<br />
that of its competitors, or the industry average, is<br />
deemed to be more efficient and is therefore, all<br />
things being equal, preferred<br />
39
Management assessment exercise<br />
Gross Profit margin<br />
Example: RCG Corporation Limited (RCG) – Rounded to ‘000s<br />
Gross Profit margin =<br />
($42,339 – $14,876)<br />
$42,339<br />
Gross Profit margin =<br />
64.9%<br />
40
Management assessment exercise<br />
• Summary: RCG Corporation Limited (RCG)<br />
• Return on Assets: 17.5%<br />
• Return on Equity: 21%<br />
• EPS Growth: 29%<br />
• Gross Profit Margin: 64.9%<br />
• What does this tell us about RCG’s performance?<br />
41<br />
The company has been performing strongly. The high<br />
ROA and ROE is reflective of efficient operations. High<br />
EPS growth indicates the company’s operations<br />
continue to grow strongly and gross profit margins are<br />
indicative of high profitability of the business
Let’s take a break<br />
See you shortly<br />
42
Company assessment<br />
43
Deconstructing a company<br />
• Understand how a company operates and<br />
generates its profits<br />
• Determine the company’s key competitive<br />
advantage<br />
• Identify key risks in the company’s business model<br />
• Assess the attractiveness of the sector the<br />
company operates within<br />
44
Company operations<br />
• Advantages of understanding a company’s<br />
business model and how its profits are made:<br />
• The ability to comprehend the company’s<br />
announcements and its impact on performance<br />
• The foresight to apply broader economic news and<br />
views when gauging a company’s prospects<br />
• Identify key risk exposures of the company and your<br />
overall portfolio<br />
• Confidence in making investment decisions for your<br />
portfolio<br />
45
Key competitive advantage<br />
• Crucial when comparing a company to its peers<br />
• The three generic competitive strategies are:<br />
• Cost leadership – the lowest cost producer of a<br />
substitutable product<br />
• Differentiation – product perception that it is not easily<br />
substituted and a resulting premium can be charged<br />
• Niche focus – provides a product aimed for a subcategory<br />
of the market<br />
46
Key competitive advantage<br />
• A company’s key competitive advantage can be<br />
distilled from the generic strategies<br />
• e.g. cost leadership due to economies of scale, efficient<br />
distribution networks or vertical integration<br />
• The more difficult it is for competitors to replicate<br />
this advantage the stronger the long term impact of<br />
this advantage<br />
• e.g. through strong branding, Coca-Cola Amatil Limited<br />
(CCL) has been able to differentiate their product from<br />
generic cola beverages to charge higher prices over the<br />
long term<br />
47
Identifying key risks<br />
• Unfortunately, no business model is perfect and<br />
key risks for a business have to be identified<br />
• This is related to both understanding a business<br />
and its sector<br />
• Some risks will be specific to the business and<br />
others apply to the overall sector<br />
48
Key risks<br />
• Like competitive advantages, there are numerous<br />
risks to running a business<br />
• Key is to identify the risks which would be the most<br />
pertinent to a business:<br />
• Magnitude of failure – e.g. for a wheat farmer, the price of<br />
wheat is a key risk and substantially impacts the<br />
profitability of the business<br />
• Likelihood of failure – e.g. likelihood for a fall in the price<br />
of wheat is reasonable as global crop yields can vary<br />
significantly but global demand is relatively stable<br />
49
Understanding the sector<br />
• This process is similar to applying a top down<br />
approach<br />
• Examine country and macroeconomic impacts<br />
• e.g. the recent carbon tax proposal will significantly<br />
impact the profitability of energy intensive industries<br />
in Australia if legislated. This creates uncertainty<br />
making <strong>Australian</strong> industries like aluminum,<br />
agriculture, steel and manufacturing less attractive<br />
• Assess the attractiveness of the sector via<br />
‘Porter’s five forces’<br />
50
Porter’s five forces<br />
51
Porter’s five forces<br />
• An attractive sector will exhibit a combination of<br />
these characteristics:<br />
• low threat of new entrants, thanks to high barriers to<br />
entry, including government regulations and high<br />
start up costs<br />
• low power of suppliers, thanks to available<br />
substitutes and a large number of suppliers<br />
• low power of buyers, due to a large number of buyers<br />
• low threat of substitutes due to absence of similar<br />
products or services<br />
52
Company assessment exercise<br />
• What does RCG Corporation do?<br />
• Investment holding company which owns and operates<br />
a number of footwear businesses<br />
• Businesses include The Athlete’s Foot, Shoe Superstore<br />
and RCG Brands Pty Ltd<br />
• How does it generate its profits?<br />
• Sale of the footwear and apparel through its specialty<br />
stores, and through its wholesale and distribution<br />
subsidiary, RCG Brands<br />
53
Company assessment exercise<br />
• What is RCG Corporation Limited’s (RCG) key<br />
competitive advantage?<br />
• RCG is a niche retailer with unique market position<br />
• RCG differentiates itself on utilitarian and comfort<br />
shoes, hence it is less susceptible to fashion trends<br />
• RCG has a strong and capable management team<br />
who have been successful at turning the company<br />
around and positioning it for growth<br />
54
Company assessment exercise<br />
• What are the key business specific risks for RCG?<br />
• Management has been instrumental in turning the<br />
business around, hence key personnel risk<br />
• Execution risk of new stores rollout for the Athlete’s Foot<br />
and Shoe Superstore<br />
• What are the key sector risks that impact RCG?<br />
• Cost pressure – rising raw material costs will increase the<br />
cost of goods sold (COGS)<br />
• Weak consumer sentiment – higher interest rates and<br />
rising petrol costs may force consumers to trim<br />
discretionary spending<br />
55
Company assessment exercise<br />
• What country or macroeconomic factors are affecting<br />
RCG?<br />
• Rising labor cost – wages in China have been increased<br />
significantly over the past 12 months<br />
• Currency headwind – Chinese Yuan is a highly undervalued<br />
currency, expected to appreciate strongly over time<br />
• Using ‘Porter’s five forces’ what makes RCG’s sector<br />
attractive?<br />
• Power of suppliers is low due to the large number of manufacturers<br />
• High power of buyers as demand for footwear is relatively elastic<br />
• Unfortunately, there is a high threat of new entrants and substitutes,<br />
due to low startup costs and the wide variety of footwear available<br />
56
Valuations<br />
57
Valuations<br />
• <strong>Investors</strong> should determine an intrinsic valuation<br />
when making investment decisions<br />
• Purchase undervalued shares<br />
• Dispose overvalued shares<br />
• Warren Buffett says<br />
“Price is what you pay, value is what you get”<br />
58
How is a valuation determined?<br />
• There are several widely<br />
accepted methods utilised<br />
to do this<br />
• Each has their strengths<br />
and weaknesses<br />
• However, all methodologies<br />
will rely on assumptions and<br />
estimates<br />
59
Valuation methodologies<br />
• Ratio valuation – historical or relative<br />
• Price / Earnings ratio (P/E)<br />
• P/E / Earnings Growth ratio (PEG)<br />
• Price / Cash Flow ratio (P/CF)<br />
• Price / Book Value ratio (P/BV)<br />
• Enterprise Value<br />
• Dividend Discount model (Gordon Growth model)<br />
• Discounted Cash Flow model<br />
60
Ratio valuation calculation<br />
• Ratio valuations are the mostly widely used<br />
valuation tool due to the simplicity of their<br />
calculation<br />
P/E ratio =<br />
Current Price<br />
Estimated Annual Earnings<br />
P/E Ratio<br />
PEG ratio =<br />
Estimated Annual Earnings Growth<br />
61
Ratio valuation calculation<br />
P/BV ratio =<br />
Current Price<br />
Estimated Book Value<br />
P/CF ratio =<br />
Current Price<br />
Estimated Annual Cash Flows<br />
62
Ratio valuation - Historical<br />
• Historical ratio valuation assumes that the<br />
relationship between the company’s share price<br />
and earnings (cash flow or book value<br />
respectively) should be constant over time<br />
• In other words, each dollar invested should be<br />
worth a fixed percentage of earnings e.g.<br />
• Company A’s historical P/E is 15<br />
• Company A’s current P/E is 20<br />
• <strong>Investors</strong> should sell Company A as the current<br />
market price is high relative to its earnings<br />
63
Ratio valuation - Relative<br />
• Relative ratio valuation is used to compare<br />
different companies with similar operations. e.g.<br />
• Assume Company A and B are identical<br />
• Company A’s P/E is 20, Company B’s P/E is 15<br />
• <strong>Investors</strong> should purchase Company B<br />
• Reasoning – Company B’s earnings cost comparatively<br />
less than Company A<br />
• Note that the P/E ratio is calculated in the same<br />
way as a historical ratio valuation<br />
64
When do we use different ratios?<br />
• P/E ratios are the most widely used, as the relationship<br />
between a company’s earnings performance and stock<br />
returns are well documented<br />
• Other ratios were derived in response to limitations of the<br />
P/E ratio:<br />
• PEG ratio allowed comparison of companies different growth profiles.<br />
Traditional P/E assumes companies have similar growth<br />
• P/CF ratio catered for the argument that company’s will use creative<br />
accounting to boost nominal profits. Cash flow is hard to manipulate<br />
and P/CF is used for companies with consistent cash flows<br />
• P/BV was created for similar reasons as P/CF. This ratio is used to<br />
determine the value of a company if it liquidated immediately. This<br />
ratio is more useful for asset heavy companies. Book value is also<br />
commonly referred to as Net Tangible Assets (NTA)<br />
65
Valuation exercise<br />
• RCG Corporation Limited (RCG)<br />
• Current share price is $0.50<br />
• Expected earnings is 4.5 cents per share<br />
• Historical P/E of 17<br />
• Average retail sector P/E of 12<br />
• What is RCG’s current P/E?<br />
• P/E = $0.50 / $0.045 = 11<br />
• Is RCG cheap compared to its historical P/E?<br />
• Is RCG cheap compared to its sector’s P/E?<br />
66
Valuation exercise<br />
• RCG Corporation Limited (RCG)<br />
• Current P/E is 11<br />
• Expected earnings growth is 23%<br />
• Oroton Group Limited (ORL) PEG is 4.36<br />
• What is RCG’s PEG?<br />
• PEG = 11 / 23 = 0.48<br />
• Is RCG cheap compared to ORL?<br />
67
Enterprise value<br />
• Enterprise Value is an economic measure used to<br />
determine the market value of a business<br />
• Enterprise Value is commonly known as the<br />
theoretical takeover price. An acquirer would have<br />
to take on the company’s debt but will be able to<br />
pocket its cash<br />
• It is used as an alternative to Market Capitalisation<br />
when valuing a company as a whole<br />
• It is also used as an alternative to Price for ratio<br />
valuation. e.g. EV/EBITDA as an alternative to P/E<br />
68
Enterprise value<br />
Enterprise<br />
Value<br />
=<br />
Market Value of Ordinary Shares<br />
+<br />
Market Value of Preference Shares<br />
+<br />
Market Value of Debt<br />
+<br />
Market Value of Minority Interest<br />
-<br />
Market Value of Associate Company<br />
-<br />
Cash and Cash Equivalents<br />
69
Dividend discount model<br />
• The dividend discount model (DDM) values<br />
companies based on their return to shareholders<br />
in the form of dividends<br />
• A simple example of a dividend discount model<br />
is the Gordon Growth model, which values a<br />
security based on a constant dividend growth<br />
and a constant required rate of return<br />
• This can be expanded to a two-stage model<br />
where an initial level of growth is assumed and<br />
then another after time<br />
70
Gordon Growth model<br />
• Note that even a simple dividend discount<br />
model like the Gordon Growth model requires a<br />
number of assumptions and estimates<br />
Valuation =<br />
Expected Dividend Amount<br />
Required<br />
Rate of Return<br />
-<br />
Expected<br />
Dividend<br />
Growth<br />
71
Valuation exercise<br />
• RCG Corporation Limited (RCG):<br />
• Is expected to pay 3 cents of dividends<br />
• This dividend is expected to grow 6% going forward<br />
• Our current required rate of return for a company of<br />
RCG’s risk profile is 10%<br />
• How much is RCG worth according to a<br />
Gordon Growth model?<br />
• RCG’s valuation = $0.03 / ( 0.1 – 0.06 ) = $0.75<br />
72
Discounted cash flow model<br />
• The discounted cash flow (DCF) model is based<br />
on a similar premise as the dividend growth<br />
model<br />
• This valuation model examines the cash flows a<br />
company is expected to generate in future<br />
periods<br />
• These individual cash flows are ‘discounted’<br />
back to the current period to determine the<br />
intrinsic value of the company<br />
73
Bringing it all together<br />
74
Things to remember<br />
• Check the Financial Health<br />
• Use liquidity, leverage and profitability ratios<br />
• Review past performance<br />
• Tells you about the efficiency and effectiveness of<br />
management<br />
• Assess the company<br />
• Understand the company – its operations, strengths,<br />
weaknesses and risks<br />
• Determine the Valuation<br />
• Use price multiples, EV, DDM, and DCF<br />
75
Fundamental checklist<br />
76
Nine Golden Rules<br />
Your intellectual framework<br />
1. Financial Health<br />
2. Management Assessment<br />
3. Outlook / Forecast<br />
4. Share Price Value<br />
5. Share Price Trend/Sentiment<br />
6. Liquidity and size<br />
7. Company Activities<br />
8. News/Announcements<br />
9. Follow the above rules<br />
77
Thank you for your attendance<br />
Lincoln Indicators Pty Ltd<br />
ACN 006 715 573 AFSL 237740<br />
Call 1300 676 333<br />
enquiries@lincolnindicators.com.au<br />
www.lincolnindicators.com.au<br />
78
Important information<br />
Lincoln Indicators Pty Ltd (Lincoln) makes no re<strong>presentation</strong> and gives no warranty as to the<br />
accuracy of the information contained in this <strong>presentation</strong>, and does not accept any responsibility<br />
for any errors or inaccuracies in, or omissions from, this <strong>presentation</strong> (whether negligent or<br />
otherwise), and Lincoln shall not be liable for any loss or damage howsoever arising as a result of<br />
any person acting or refraining from acting in reliance on any information contained herein. No<br />
reader should rely on this <strong>presentation</strong>, as it does not purport to be comprehensive or to render<br />
personal advice. This disclaimer does not purport to exclude any warranties implied by law which<br />
may not be lawfully excluded.<br />
Information in this <strong>presentation</strong> is current as at date of <strong>presentation</strong> unless otherwise stated. It is<br />
provided for educational purposes only and may not reflect current market data or opinion. It<br />
should not be relied upon in respect to any current investment decision. Investments can go up<br />
and down. Past performance is not a reliable indicator of future performance.<br />
Economic and other information taken into account in forming any opinions are subject to change<br />
and therefore opinions expressed as to future matters may no longer be reliable.<br />
79
Important information<br />
Our advice has been prepared without taking into account your personal circumstances, and<br />
you should therefore consider its appropriateness in light of your objectives, financial situation<br />
and needs, before acting on it.<br />
Where we refer to the Lincoln <strong>Australian</strong> Share Fund (the ‘Fund’), information and advice<br />
provided should be considered in conjunction with the Product Disclosure Statement (PDS) of<br />
the Fund, which is available on request and from our website. You should read and consider the<br />
PDS before making any decision about whether to acquire or continue to hold the product.<br />
Responsible Entity/ Issuer of the Fund is Equity Trustees Limited ABN 46 004 031 298 AFSL<br />
240975. Lincoln and its Authorised Representatives will be remunerated on the basis of monies<br />
invested in the Fund. You should read and consider our Financial Services Guide (FSG)<br />
provided to you, which sets out key information about the services we provide. The FSG is also<br />
available at www.lincolnindicators.com.au.<br />
Testimonials are provided by third parties for information purposes only and are not intended to<br />
be financial product advice. They do not represent opinion or advice from Lincoln. The<br />
information provided may not be appropriate to your particular circumstances. You should<br />
consider obtaining your own independent advice before making any decision.<br />
80
Important information<br />
ASX-listed company data is copyright and provided by Morningstar Australasia Pty Ltd<br />
(‘Morningstar’) © 2010 ABN: 95 090 665 544, AFSL: 240892 (a subsidiary of Morningstar, Inc).<br />
All rights reserved. The data and content contained herein are not guaranteed to be accurate,<br />
complete or timely. Neither Morningstar, nor its affiliates nor their content providers will have any<br />
liability for use or distribution of any of this information. To the extent that any of this information<br />
constitutes advice, it is general advice that has been prepared by Morningstar without reference<br />
to your objectives, financial situation or needs.<br />
Before acting, you should consider the appropriateness of the advice and obtain financial, legal<br />
and taxation advice before making any financial investment decision. <strong>Investors</strong> should obtain<br />
the relevant product disclosure statement and consider it before making any decision to invest.<br />
Please refer to our Financial Services Guide (FSG) for more information<br />
www.morningstar.com.au/fsg.asp. Some of the material provided is published under licence<br />
from ASX Operations Pty Limited ACN 004 523 782 (‘ASXO’). Consensus forecast data is<br />
copyright Thomson Financial.<br />
Lincoln and/or associates and/or its employees may hold an interest in companies referred to in<br />
this <strong>presentation</strong>. This position can change at any time without notice.<br />
All pricing GST inclusive.<br />
81