Balancing risk and opportunity through asset allocation - Australian ...
Balancing risk and opportunity through asset allocation - Australian ...
Balancing risk and opportunity through asset allocation - Australian ...

You also want an ePaper? Increase the reach of your titles
YUMPU automatically turns print PDFs into web optimized ePapers that Google loves.
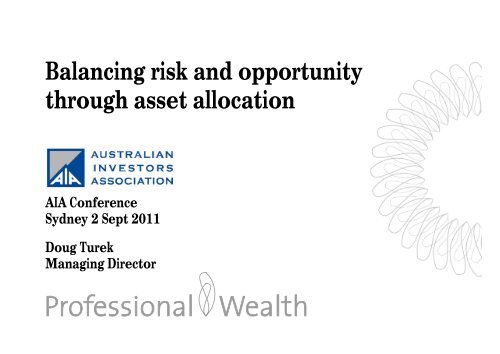
<strong>Balancing</strong> <strong>risk</strong> <strong>and</strong> <strong>opportunity</strong><br />
<strong>through</strong> <strong>asset</strong> <strong>allocation</strong><br />
AIA Conference<br />
Sydney 2 Sept 2011<br />
Doug Turek<br />
Managing Director
Today let’s try to answer …<br />
Why <strong>asset</strong> <strong>allocation</strong> is your most important investment decision<br />
What are the most commonly used Asset Allocations (AA)<br />
What should guide determining yours<br />
What <strong>asset</strong>s belong in your <strong>allocation</strong><br />
PW AGSM 0405<br />
-1-
About this presentation<br />
About Doug Turek<br />
PW AGSM 0405<br />
This is general information … not advice<br />
I don’t know you <strong>and</strong> by law I can’t give you<br />
advice until I do …<br />
… <strong>and</strong> only in writing <strong>and</strong> not via a lectern<br />
Please do your own research, or speak to a<br />
licensed financial advisor, before making<br />
any investment decisions<br />
This is © Professional Wealth –contact us<br />
for permission to reuse<br />
-2-<br />
MD Professional Wealth<br />
- Independently owned wealth<br />
advisory <strong>and</strong> money management firm<br />
Passionate about financial literacy via…<br />
(ABC, Eureka, AIA, Wealth benchmarks)<br />
Former industry consultant with The<br />
Boston Consulting Group<br />
<strong>Australian</strong> by birth despite accent
What drives your investment experience <strong>and</strong> results more?<br />
Choosing between …<br />
BHP vs. RIO<br />
CBA vs. ANZ vs. WBC vs. NAB<br />
WOW vs. WES<br />
DJS vs. MYR<br />
Ubank vs. ING Direct vs. Rabobank<br />
Unit 11 with a garden vs. Unit 31 w/ a view<br />
or<br />
Shares vs. cash<br />
<strong>Australian</strong> vs. International shares<br />
• Hedged vs. unhedged currency<br />
• Developed vs. Emerging markets<br />
Cash vs. TDs vs. Bonds vs. Hybrids<br />
• Fixed vs. floating vs. Inflation-linked<br />
Listed vs Unlisted vs Direct Property<br />
• Residential vs. Commercial<br />
Index vs. active management<br />
Core vs. satellite exposures<br />
Commodities? Collectables? Gold? …<br />
PW AGSM 0405<br />
-3-
Some say <strong>allocation</strong> drives 90% of performance<br />
Determinants of Portfolio Variance<br />
Asset Class<br />
Selection<br />
94.0%<br />
Market<br />
Timing<br />
2.0%<br />
Security<br />
Selection<br />
4.0%<br />
Source: Brinson, Hood, Beebower 1986 study of 91 pension fund returns over one decade<br />
PW AGSM 0405<br />
-4-
Asset <strong>allocation</strong> is the architecture of your portfolio<br />
whereas “ Investment selection ” is the interior design<br />
PW AGSM 0405<br />
-5-
Wrong Asset Allocation is the #1 of 7 deadly sins of wealth management<br />
1. Have wrong <strong>asset</strong> <strong>allocation</strong> (incl. too little of … <strong>and</strong> too much of …, none of …)<br />
2. Not optimally structured (eg. super incl. pensions, income splitting, debt structure)<br />
3. Inefficient investment style (incl. tax, fees, <strong>risk</strong>/reward , too active …)<br />
4. Poor investment “process” management (eg. monitoring, rebalancing, time-averaging)<br />
5. Un- or under-insured (incl. newly retired’s young adult children)<br />
6. Incomplete Wealth Succession <strong>and</strong> “Investment Dementia” planning<br />
7. Infected with “Affluenza”<br />
Source: Professional Wealth<br />
PW AGSM 0405<br />
-6-
Fancy knowing how others invest (earn, have in super …) ?<br />
PW AGSM 0405<br />
-7-
Wealth benchmarks average <strong>asset</strong> <strong>allocation</strong><br />
Include the home?<br />
Exclude home<br />
Shares<br />
Property<br />
Cash<br />
Property<br />
© Wealth benchmarks<br />
PW AGSM 0405<br />
-8-
But averages can be deceiving … % break down of AA by investor<br />
Group of<br />
investors<br />
all in cash<br />
Group of<br />
investors all<br />
in property*<br />
© Wealth benchmarks % equity-like<br />
Group of<br />
investors all<br />
in shares<br />
Diversified<br />
investor<br />
group<br />
PW AGSM 0405<br />
* Out of total 40% who invest in direct property<br />
-9-
Common portfolio types <strong>and</strong> <strong>asset</strong> <strong>allocation</strong> biases<br />
DIY<br />
The brokered<br />
The Planned<br />
& Industrialised<br />
Bricks/ Mortar<br />
Cash/TD*<br />
Top 10<br />
shares**<br />
*23% on avg at 20110630<br />
**ASX top 11 ex-Telstra<br />
(from Multiport SMSF study)<br />
<strong>Australian</strong> Shares!<br />
Int’l LICS<br />
REITs<br />
Hybrids<br />
(all ASX listed,<br />
+++ equities)<br />
Managed Funds<br />
(Retail Planner)<br />
+ incl. 30% illiquid<br />
(Industry fund)<br />
Rental properties<br />
Mostly residential<br />
Drivers: Investor need or supplier business model? Behaviour/philosophy, …<br />
PW AGSM 0405<br />
-10-
Australia investors are 3 rd biggest equity (%) investors in the world …<br />
<strong>and</strong> lowest investors in bonds<br />
PW AGSM 0405<br />
-11-
10,000,000.0<br />
1,000,000.0<br />
<strong>Australian</strong> investment returns 1880-2010<br />
Annualised Return (%)<br />
Price Yield Total<br />
Shares<br />
100,000.0<br />
10,000.0<br />
Company shares 6 5 11<br />
Residential property 4 3 7<br />
Government bonds - 5 5<br />
Cash 90 day deposit - 4 4<br />
Inflation (cpi) 3 - 3<br />
© Professional Wealth<br />
Property<br />
1,000.0<br />
Bonds<br />
100.0<br />
Cash<br />
10.0<br />
Inflation<br />
1.0<br />
1880 1890 1900 1910 1920 1930 1940 1950 1960 1970 1980 1990 2000 2010<br />
PW AGSM 0405<br />
0.1<br />
-12-
Equities AND bonds can work together<br />
$2,000,000<br />
100%B<br />
$1,800,000<br />
50%E/50%B<br />
100%E<br />
$1,600,000<br />
$1,400,000<br />
50:50 rebalanced mix<br />
All <strong>Australian</strong> shares*<br />
All <strong>Australian</strong> bonds<br />
$1,200,000<br />
$1,000,000<br />
$800,000<br />
31-Dec-04 31-Dec-05 31-Dec-06 31-Dec-07 30-Dec-08 30-Dec-09<br />
*incl. dividends<br />
PW AGSM 0405<br />
-13-
What is the right balance for you?<br />
Defensive<br />
PW AGSM 0405<br />
-14-
Factors driving your overall “equity-bond” mix (I)<br />
Your pain threshold<br />
• emotional <strong>risk</strong>-tolerance, equity-flight <strong>risk</strong><br />
Risks you need to take or don’t<br />
• Need to fund lifestyle choice, or don’t need to if have enough<br />
Risk you can afford to take (“<strong>risk</strong> budget”)<br />
• If funding a pension, if only just have enough<br />
Other <strong>asset</strong>s you have/will<br />
• Earned income? Other DB pension? Business? Inheritance?<br />
“Intra-entity tax optimisation”<br />
PW AGSM 0405<br />
-15-
Historic trade-offs between return <strong>and</strong> volatility-<strong>risk</strong><br />
Investment Return<br />
(% pa)<br />
For portfolios with increasing % of equities (defensive>aggressive)<br />
0% 20% 40% 50% 60% 70% 80% 100%<br />
Average annual (% pa) 6.9 7.9 8.6 9.0 9.3 9.7 10.0 10.3<br />
1 Year<br />
Worst<br />
Best<br />
2.4<br />
15.7<br />
-2.7<br />
18.2<br />
-12.1<br />
23.3<br />
-17.2<br />
27.5<br />
-21.8<br />
31.8<br />
-26.2<br />
37.1<br />
-32.1<br />
42.1<br />
-39.6<br />
52.1<br />
5 Years<br />
Worst<br />
Best<br />
5.3<br />
9.4<br />
5.4<br />
10.8<br />
4.6<br />
12.3<br />
4.0<br />
13.1<br />
3.4<br />
14.5<br />
3.3<br />
16.4<br />
2.8<br />
18.1<br />
1.0<br />
21.1<br />
10 Years<br />
Worst<br />
Best<br />
5.5<br />
7.9<br />
6.1<br />
9.4<br />
6.0<br />
10.7<br />
5.9<br />
11.3<br />
5.7<br />
12.1<br />
5.8<br />
13.0<br />
5.7<br />
13.5<br />
4.8<br />
15.1<br />
Frequency of negative<br />
year returns (1 in # yrs)<br />
~ 20 10 8 7 6 5 4-5<br />
Based on monthly returns for 20 years to 20100830 including <strong>through</strong> GFC<br />
PW AGSM 0405<br />
-16-
Factors driving your overall “equity-bond” mix (II)<br />
Your pain threshold<br />
• emotional <strong>risk</strong>-tolerance, equity-flight <strong>risk</strong><br />
Risks you need to take or don’t<br />
• Need to fund lifestyle choice, or don’t need to if have enough<br />
Risk you can afford to take (“<strong>risk</strong> budget”)<br />
• If funding a pension, if only just have enough<br />
Other <strong>asset</strong>s you have/will<br />
• Earned income? Other DB pension? Business? Inheritance?<br />
“Intra-entity tax optimisation”<br />
PW AGSM 0405<br />
-17-
Most pension funds can’t afford volatility/<strong>risk</strong><br />
Return (%)<br />
Fund / Portfolio / Series Steady Volatile<br />
Year 1 9 -10<br />
Year 2 9 30<br />
Year 3 9 -10<br />
Year 4 9 30<br />
Year 5 9 -10<br />
Year 6 9 30<br />
Year 7 9 -10<br />
Year 8 9 30<br />
Year 9 9 -10<br />
Year 10 9 30<br />
Average Annual Return (%) 9.0 10.0<br />
St<strong>and</strong>ard Deviation (%) 0.0 20.0<br />
Growth of $100,000 $ 236,736 $ 219,245<br />
Compound Annual Return (%) 9.0 8.2<br />
Balance of $1m after $100k pa pension $ 711,334 $ 459,891<br />
PW AGSM 0405<br />
-18-
Life stage / lifecycle investing – “have your age in bonds”<br />
PW AGSM 0405<br />
-19-
Factors driving your overall “equity-bond” mix (III)<br />
Your pain threshold<br />
• emotional <strong>risk</strong>-tolerance, equity-flight <strong>risk</strong><br />
Risks you need to take or don’t<br />
• Need to fund lifestyle choice, or don’t need to if have enough<br />
Risk you can afford to take (“<strong>risk</strong> budget”)<br />
• If funding a pension, if only just have enough<br />
Other <strong>asset</strong>s you (will) have<br />
• Other DB pension? Business sale? Inheritance? Earned income?<br />
“Intra-entity tax optimisation”<br />
PW AGSM 0405<br />
-20-
Work & Wealth<br />
also inter-relate<br />
Contracting Part-time<br />
Overseas<br />
Directorships Consulting<br />
?<br />
Teaching<br />
Venturing<br />
+ $<br />
Charitable<br />
Family<br />
Leisure<br />
-$<br />
Earn ?<br />
Pay = expenses<br />
Lets investments<br />
compound,<br />
postpone drawing<br />
Invest<br />
Retirement<br />
has been retired<br />
PW AGSM 0405<br />
-21-
Equity / bond mix<br />
<strong>Australian</strong> vs. International equity (hedged vs. unhedged) ?<br />
Small companies vs. large?<br />
Growth vs. value?<br />
Industry Sectors? Income? …<br />
Property trusts or direct?<br />
Listed vs. unlisted?<br />
Commercial vs. residential? Developmental vs. passive? …<br />
Cash vs. TDs vs. hybrids vs. bonds vs. mortgage trusts vs. ……..<br />
PW AGSM 0405<br />
Alternatives ….<br />
-22-
International diversification <strong>and</strong> currency protection<br />
Markets by Sectors<br />
Top 10 Companies <strong>and</strong> % of market<br />
2.9%<br />
4.3%<br />
6.2%<br />
10.6%<br />
Australia<br />
43.1%<br />
4.8%<br />
9.9%<br />
The World<br />
12.0%<br />
4.1%<br />
0.5%<br />
21.0%<br />
8.5%<br />
Australia top 10 stocks <strong>and</strong> size % World top 10 stocks <strong>and</strong> size %<br />
BHP Billiton Ltd 14.1% Exxon Mobil Corp 1.2%<br />
Commonwealth Bank of Australia 8.6% Apple Inc 1.0%<br />
Westpac Banking Corp 7.5% Microsoft Corp 0.8%<br />
Australia & NZ Banking Group 6.5% Procter & Gamble Co 0.7%<br />
National Australia Bank Ltd 5.8% Nestle SA Reg 0.7%<br />
Woolworths Ltd 3.9% HSBC Holdings Plc 0.6%<br />
Rio Tinto ltd 3.6% Intl Business Machine Corp 0.6%<br />
8.8%<br />
9.5%<br />
Wesfarmers Ltd 3.6% Chevron Corp 0.6%<br />
Newcrest Mining Ltd 3.3% AT & T Inc 0.6%<br />
27.2%<br />
10.4%<br />
10.7%<br />
Westfield Group 2.9% General Electric Co 0.6%<br />
Total <strong>Australian</strong> Top 10 59.7% Total MSCI Top 10 7.4%<br />
Source: iShares MSCI Australia <strong>and</strong> ACWI index at 30 September 2010<br />
<strong>Australian</strong> market is 2/3rds<br />
banks & resources<br />
Top 10 <strong>Australian</strong> stocks = 60% of market<br />
vs. 7% for top 10 Int’l companies<br />
PW AGSM 0405<br />
-23-
Small <strong>and</strong> value stocks sometimes outperform<br />
Long-term low priced large-company returns vs. large, high priced vs. small companies:<br />
(% pa)<br />
Source: Dimensional Fund Advisors<br />
PW AGSM 0405<br />
-24-
Outlook for property?<br />
Prior to latest run up property<br />
prices rose at inflation +0-1%<br />
Recent<br />
<strong>Australian</strong><br />
boom <strong>and</strong> … ?<br />
US boom<br />
<strong>and</strong> bust<br />
PW AGSM 0405<br />
-25-
Shares <strong>and</strong> Property (not or)<br />
Shares<br />
Property<br />
Interest in a company<br />
Interest in l<strong>and</strong> <strong>and</strong> a building<br />
Value tied to profits (dividends)<br />
Value tied to rental income <strong>and</strong> also<br />
… <strong>and</strong> also expected future profits<br />
… appreciating l<strong>and</strong> <strong>and</strong> depreciating bldg<br />
Tax benefits (imputation, CG, gearing) Tax benefits (dep’n, CG, gearing)<br />
No holding costs<br />
Holding costs (taxes, maintenance)<br />
Divisible<br />
“Lumpy”<br />
Liquid <strong>and</strong> low transaction costs<br />
Illiquid <strong>and</strong> high t/x costs<br />
… volatile pricing (+39%, -43%, …) … stable pricing (~ 5%pa or ???)<br />
… leverage able 50-75% … leverage to 90+ %<br />
Intangible<br />
Tangible<br />
PW AGSM 0405<br />
-26-
Can you have too much cash?<br />
Average silver content of 10 European countries’ coins (grams)<br />
Do you suspect there is still a pound of silver in a GB £ Pound Sterling?<br />
Source: Reinhart <strong>and</strong> Rogoff<br />
PW AGSM 0405<br />
-27-
<strong>Australian</strong> inflation experience – time for a change?<br />
Negative<br />
High<br />
Low<br />
High<br />
Low<br />
(on gold<br />
st<strong>and</strong>ard )<br />
Inflation persists, over long periods (doesn’t mean revert)<br />
Likely to encounter inflation over 30 year long retirement periods<br />
Recent 20 year absence long enough for it to surprise again<br />
PW AGSM 0405<br />
-28-
Inflation can be unkind to retirement portfolios<br />
$2,500,000<br />
$2,000,000<br />
$1,500,000<br />
$1,000,000<br />
$500,000<br />
Actual retirements<br />
from 1875 – 2008<br />
Early failures were<br />
during high inflation<br />
periods (eg. 1970s)<br />
<strong>and</strong> not from<br />
retiring <strong>through</strong><br />
poor investment<br />
eras (eg. 1930s)<br />
$0<br />
© Professional Wealth<br />
0 5 10 15 20 25 30 35 40<br />
1970 start 1930 start<br />
PW AGSM 0405<br />
Projection of $1m retirement balance invested earning actual year-year returns before 1.5% pa taxes/fee, not averages, for 60/40 <strong>Australian</strong><br />
equity/bond portfolio for retirements beginning in 1875 <strong>and</strong> every 2 nd <strong>and</strong> 5 th year thereafter. Initial 6% drawdown adjusted by actual inflation for<br />
subsequent years.<br />
-29-
Inflation linked bonds might strengthen your defense<br />
Cash<br />
Nominal<br />
bonds<br />
Inflation<br />
linked<br />
bonds<br />
Interest rate linked<br />
CPI linked<br />
PW AGSM 0405<br />
-30-
How different cash/bond components might work together<br />
Inflation linked<br />
Long term inflation protection<br />
Higher yield from longer<br />
bonds (safer than if from<br />
nominal bonds)<br />
Match real liability<br />
DIY annuity?<br />
Short-term FI,<br />
cash,<br />
floating<br />
notes?<br />
Long (or<br />
medium)<br />
term fixed<br />
nominal<br />
FI<br />
Or add ….<br />
<strong>and</strong><br />
High Yield?<br />
PW AGSM 0405<br />
Capital protection, short-term<br />
inflation hedge, liquidity for<br />
income <strong>and</strong> rebalancing,<br />
overall portfolio volatility<br />
reduction<br />
De/dis-inflation protection<br />
(Capital gain if i-rates drop)<br />
Volatility reduction from –ve<br />
correlation with equities<br />
Lock in higher income<br />
-31-<br />
+ Higher return from credit<br />
<strong>risk</strong> from non-investment<br />
grade bonds? Use equities<br />
instead?
Fancy something alternative?<br />
Gold <strong>and</strong> other precious metals<br />
Other hard commodities <strong>and</strong> oil<br />
Soft commodities (eg. agriculture)<br />
Infrastructure<br />
Private equity<br />
Hedge funds<br />
Art <strong>and</strong> other collectables<br />
…<br />
ETFs <strong>and</strong> indexing<br />
Core-satellite constructions<br />
Portfolio protection<br />
PW AGSM 0405<br />
-32-
Example portfolio mixes from defensive to aggressive<br />
Truth in labeling? “balanced growth”, “assertive” , “alternative defensive”, …<br />
Source: Morningstar<br />
PW AGSM 0405<br />
-33-
Investment portfolios like a garden need occasional pruning<br />
PW AGSM 0405<br />
-34-
Rebalancing controls <strong>risk</strong> & may reward - example equity/bond mix<br />
+10 %<br />
Target<br />
-10 %<br />
PW AGSM 0405<br />
-35-
PW AGSM 0405<br />
-36-
An unmanaged property portfolio?<br />
PW AGSM 0405<br />
-37-
Know more about your investment performance than your car’s!<br />
PW AGSM 0405<br />
-38-
Dr Douglas Turek<br />
Managing Director<br />
Professional Wealth Pty Ltd<br />
AFSL No. 369453<br />
13/350 Collins Street<br />
GPO Box 4975<br />
Melbourne VIC 3001<br />
Australia<br />
p 61 3 9605 0600<br />
e dturek@professionalwealth.com.au<br />
w www.professionalwealth.com.au<br />
PW AGSM 0405<br />
-39-