Attachment 12 - Resourcing Strategy 2012-2013.pdf - IPART - NSW ...
Attachment 12 - Resourcing Strategy 2012-2013.pdf - IPART - NSW ...
Attachment 12 - Resourcing Strategy 2012-2013.pdf - IPART - NSW ...

Create successful ePaper yourself
Turn your PDF publications into a flip-book with our unique Google optimized e-Paper software.
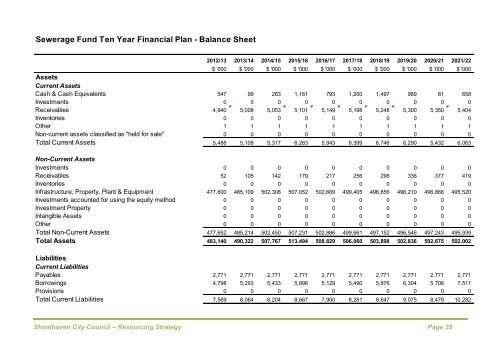
Sewerage Fund Ten Year Financial Plan - Balance Sheet<br />
20<strong>12</strong>/13 2013/14 2014/15 2015/16 2016/17 2017/18 2018/19 2019/20 2020/21 2021/22<br />
$ '000 $ '000 $ '000 $ '000 $ '000 $ '000 $ '000 $ '000 $ '000 $ '000<br />
Assets<br />
Current Assets<br />
Cash & Cash Equivalents 547 99 263 1,161 793 1,200 1,497 989 81 658<br />
Investments 0 0 0 0 0 0 0 0 0 0<br />
Receivables 4,940 5,008 5,053 5,101 5,149 5,198 5,248 5,300 5,350 5,404<br />
Inventories 0 0 0 0 0 0 0 0 0 0<br />
Other 1 1 1 1 1 1 1 1 1 1<br />
Non-current assets classified as "held for sale" 0 0 0 0 0 0 0 0 0 0<br />
Total Current Assets 5,488 5,108 5,317 6,263 5,943 6,399 6,746 6,290 5,432 6,063<br />
Non-Current Assets<br />
Investments 0 0 0 0 0 0 0 0 0 0<br />
Receivables 52 105 142 179 217 256 296 336 377 419<br />
Inventories 0 0 0 0 0 0 0 0 0 0<br />
Infrastructure, Property, Plant & Equipment 477,600 485,109 502,308 507,052 502,669 499,405 496,856 496,210 496,866 495,520<br />
Investments accounted for using the equity method 0 0 0 0 0 0 0 0 0 0<br />
Investment Property 0 0 0 0 0 0 0 0 0 0<br />
Intangible Assets 0 0 0 0 0 0 0 0 0 0<br />
Other 0 0 0 0 0 0 0 0 0 0<br />
Total Non-Current Assets 477,652 485,214 502,450 507,231 502,886 499,661 497,152 496,546 497,243 495,939<br />
Total Assets 483,140 490,322 507,767 513,494 508,829 506,060 503,898 502,836 502,675 502,002<br />
Liabilities<br />
Current Liabilities<br />
Payables 2,771 2,771 2,771 2,771 2,771 2,771 2,771 2,771 2,771 2,771<br />
Borrowings 4,798 5,293 5,433 5,896 5,<strong>12</strong>9 5,490 5,876 6,304 5,708 7,511<br />
Provisions 0 0 0 0 0 0 0 0 0 0<br />
Total Current Liabilities 7,569 8,064 8,204 8,667 7,900 8,261 8,647 9,075 8,479 10,282<br />
Shoalhaven City Council – <strong>Resourcing</strong> <strong>Strategy</strong> Page 35