Residual Impacts of Previous Corn Rows on Potassium Nutrition of ...
Residual Impacts of Previous Corn Rows on Potassium Nutrition of ...
Residual Impacts of Previous Corn Rows on Potassium Nutrition of ...

You also want an ePaper? Increase the reach of your titles
YUMPU automatically turns print PDFs into web optimized ePapers that Google loves.
ti<strong>on</strong> as the previous corn rows (30 in. widths)<br />
in each seas<strong>on</strong>, to evaluate the previous corn<br />
row effects <strong>on</strong> soil K fertility and soybean<br />
resp<strong>on</strong>ses. <strong>Potassium</strong> fertilizer was not<br />
applied after corn or during soybean seas<strong>on</strong><br />
in any <str<strong>on</strong>g>of</str<strong>on</strong>g> the experiments.<br />
When soil, plant, or seed sampling was<br />
c<strong>on</strong>ducted, two separate samples were taken<br />
from each subplot. One was randomly collected<br />
from soybean rows positi<strong>on</strong>ed in previous<br />
corn rows, and the other was taken<br />
from soybean rows positi<strong>on</strong>ed between the<br />
previous corn rows (i.e. approximately 15 in.<br />
from the corn rows). Soil samples were collected<br />
to four depth intervals (0 to 2 in., 2 to<br />
4 in., 4 to 8 in., and 8 to 12 in.) prior to soybean<br />
planting and after soybean harvest.<br />
Leaf K samples were taken at initial flowering<br />
stage. Seed samples were collected by<br />
hand harvesting 26 ft. lengths <str<strong>on</strong>g>of</str<strong>on</strong>g> soybean<br />
rows either in or between previous corn<br />
rows. Resulting soybean yield estimates are<br />
based <strong>on</strong> unbordered sampling areas.<br />
Soil K was extracted with 1 M amm<strong>on</strong>ium<br />
acetate (NH 4 OAc, pH = 7) soluti<strong>on</strong>. Leaf<br />
K and seed K were extracted using a dry<br />
ash method.<br />
Site 2. <str<strong>on</strong>g>Previous</str<strong>on</strong>g> corn row effects <strong>on</strong><br />
subsequent narrow-row no-till soybean yield<br />
were also m<strong>on</strong>itored at Kirkt<strong>on</strong>, Ontario, in<br />
1999. The average soil test K levels (0 to 6<br />
in.) were 90 mg/L (approximately equivalent<br />
to 75 ppm). The experiment for the corn year<br />
(1998) compared fall<br />
z<strong>on</strong>e-till and no-till<br />
tillage systems, fall K<br />
applicati<strong>on</strong> rates (0<br />
and 90 lb K 2 O/A),<br />
and spring K rates (0<br />
and 45 lb K 2 O/A).<br />
Soybeans (variety<br />
First Line 2801R)<br />
were planted in 15 in.<br />
row widths.<br />
Results<br />
Site 1. Before<br />
soybean planting in<br />
2000, soil test K levels<br />
at the 0 to 2 in., 2<br />
to 4 in., and 4 to 8 in.<br />
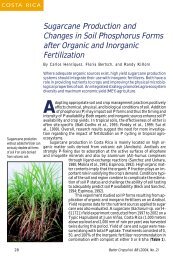
Soil exchangeable K, mg/L<br />
100<br />
80<br />
60<br />
40<br />
20<br />
0<br />
Figure 1.<br />
Deep band Surface<br />
broadcast<br />
Broadcast<br />
+ shallow<br />
band<br />
<strong>Potassium</strong> placement<br />
Zero K<br />
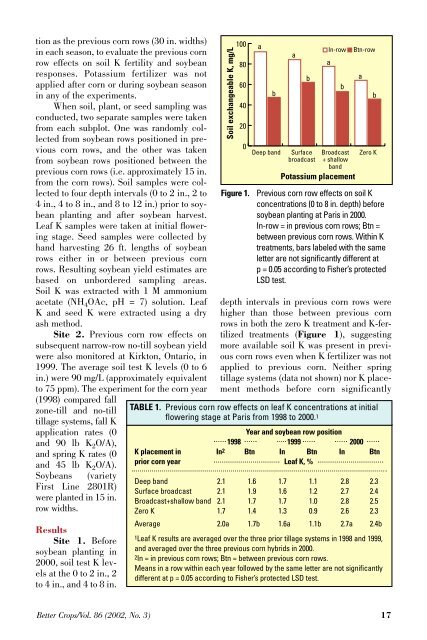
depth intervals in previous corn rows were<br />
higher than those between previous corn<br />
rows in both the zero K treatment and K-fertilized<br />
treatments (Figure 1), suggesting<br />
more available soil K was present in previous<br />
corn rows even when K fertilizer was not<br />
applied to previous corn. Neither spring<br />
tillage systems (data not shown) nor K placement<br />
methods before corn significantly<br />
TABLE 1. <str<strong>on</strong>g>Previous</str<strong>on</strong>g> corn row effects <strong>on</strong> leaf K c<strong>on</strong>centrati<strong>on</strong>s at initial<br />
flowering stage at Paris from 1998 to 2000.1<br />
Year and soybean row positi<strong>on</strong><br />
1998 1999 2000<br />
K placement in In 2 Btn In Btn In Btn<br />
prior corn year Leaf K, %<br />
a<br />
In-row<br />
Btn-row<br />
Deep band 2.1 1.6 1.7 1.1 2.8 2.3<br />
Surface broadcast 2.1 1.9 1.6 1.2 2.7 2.4<br />
Broadcast+shallow band 2.1 1.7 1.7 1.0 2.8 2.5<br />
Zero K 1.7 1.4 1.3 0.9 2.6 2.3<br />
Average 2.0a 1.7b 1.6a 1.1b 2.7a 2.4b<br />
1Leaf K results are averaged over the three prior tillage systems in 1998 and 1999,<br />
and averaged over the three previous corn hybrids in 2000.<br />
2In = in previous corn rows; Btn = between previous corn rows.<br />
Means in a row within each year followed by the same letter are not significantly<br />
different at p = 0.05 according to Fisher’s protected LSD test.<br />
b<br />
a<br />
b<br />
<str<strong>on</strong>g>Previous</str<strong>on</strong>g> corn row effects <strong>on</strong> soil K<br />
c<strong>on</strong>centrati<strong>on</strong>s (0 to 8 in. depth) before<br />
soybean planting at Paris in 2000.<br />
In-row = in previous corn rows; Btn =<br />
between previous corn rows. Within K<br />
treatments, bars labeled with the same<br />
letter are not significantly different at<br />
p = 0.05 according to Fisher’s protected<br />
LSD test.<br />
a<br />
b<br />
a<br />
b<br />
Better Crops/Vol. 86 (2002, No. 3) 17