TX-53F Haby 07 Annual Rpt.pdf
TX-53F Haby 07 Annual Rpt.pdf
TX-53F Haby 07 Annual Rpt.pdf

You also want an ePaper? Increase the reach of your titles
YUMPU automatically turns print PDFs into web optimized ePapers that Google loves.
<strong>TX</strong>-53<br />
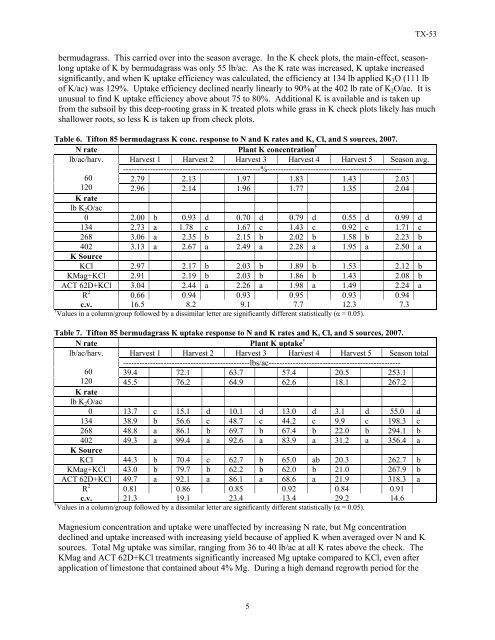
bermudagrass. This carried over into the season average. In the K check plots, the main-effect, seasonlong<br />
uptake of K by bermudagrass was only 55 lb/ac. As the K rate was increased, K uptake increased<br />
significantly, and when K uptake efficiency was calculated, the efficiency at 134 lb applied K 2 O (111 lb<br />
of K/ac) was 129%. Uptake efficiency declined nearly linearly to 90% at the 402 lb rate of K 2 O/ac. It is<br />
unusual to find K uptake efficiency above about 75 to 80%. Additional K is available and is taken up<br />
from the subsoil by this deep-rooting grass in K treated plots while grass in K check plots likely has much<br />
shallower roots, so less K is taken up from check plots.<br />
Table 6. Tifton 85 bermudagrass K conc. response to N and K rates and K, Cl, and S sources, 20<strong>07</strong>.<br />
N rate Plant K concentration †<br />
lb/ac/harv. Harvest 1 Harvest 2 Harvest 3 Harvest 4 Harvest 5 Season avg.<br />
---------------------------------------------------%--------------------------------------------------<br />
60 2.79 2.13 1.97 1.83 1.43 2.03<br />
120 2.96 2.14 1.96 1.77 1.35 2.04<br />
K rate<br />
lb K 2 O/ac<br />
0 2.00 b 0.93 d 0.70 d 0.79 d 0.55 d 0.99 d<br />
134 2.73 a 1.78 c 1.67 c 1.43 c 0.92 c 1.71 c<br />
268 3.06 a 2.35 b 2.15 b 2.02 b 1.58 b 2.23 b<br />
402 3.13 a 2.67 a 2.49 a 2.28 a 1.95 a 2.50 a<br />
K Source<br />
KCl 2.97 2.17 b 2.03 b 1.89 b 1.53 2.12 b<br />
KMag+KCl 2.91 2.19 b 2.03 b 1.86 b 1.43 2.08 b<br />
ACT 62D+KCl 3.04 2.44 a 2.26 a 1.98 a 1.49 2.24 a<br />
R 2 0.66 0.94 0.93 0.95 0.93 0.94<br />
c.v. 16.5 8.2 9.1 7.7 12.3 7.3<br />
† Values in a column/group followed by a dissimilar letter are significantly different statistically (α = 0.05).<br />
Table 7. Tifton 85 bermudagrass K uptake response to N and K rates and K, Cl, and S sources, 20<strong>07</strong>.<br />
N rate Plant K uptake †<br />
lb/ac/harv. Harvest 1 Harvest 2 Harvest 3 Harvest 4 Harvest 5 Season total<br />
-----------------------------------------------lbs/ac-------------------------------------------------<br />
60 39.4 72.1 63.7 57.4 20.5 253.1<br />
120 45.5 76.2 64.9 62.6 18.1 267.2<br />
K rate<br />
lb K 2 O/ac<br />
0 13.7 c 15.1 d 10.1 d 13.0 d 3.1 d 55.0 d<br />
134 38.9 b 56.6 c 48.7 c 44.2 c 9.9 c 198.3 c<br />
268 48.8 a 86.1 b 69.7 b 67.4 b 22.0 b 294.1 b<br />
402 49.3 a 99.4 a 92.6 a 83.9 a 31.2 a 356.4 a<br />
K Source<br />
KCl 44.3 b 70.4 c 62.7 b 65.0 ab 20.3 262.7 b<br />
KMag+KCl 43.0 b 79.7 b 62.2 b 62.0 b 21.0 267.9 b<br />
ACT 62D+KCl 49.7 a 92.1 a 86.1 a 68.6 a 21.9 318.3 a<br />
R 2 0.81 0.86 0.85 0.92 0.84 0.91<br />
c.v. 21.3 19.1 23.4 13.4 29.2 14.6<br />
† Values in a column/group followed by a dissimilar letter are significantly different statistically (α = 0.05).<br />
Magnesium concentration and uptake were unaffected by increasing N rate, but Mg concentration<br />
declined and uptake increased with increasing yield because of applied K when averaged over N and K<br />
sources. Total Mg uptake was similar, ranging from 36 to 40 lb/ac at all K rates above the check. The<br />
KMag and ACT 62D+KCl treatments significantly increased Mg uptake compared to KCl, even after<br />
application of limestone that contained about 4% Mg. During a high demand regrowth period for the<br />
5