Growth and Characterization of Chemical bath Deposited ... - ISCA
Growth and Characterization of Chemical bath Deposited ... - ISCA
Growth and Characterization of Chemical bath Deposited ... - ISCA

You also want an ePaper? Increase the reach of your titles
YUMPU automatically turns print PDFs into web optimized ePapers that Google loves.
Research Journal <strong>of</strong> <strong>Chemical</strong> Sciences ________________________________________ ISSN 2231-606X<br />
Vol. 1(5), 48-51, Aug. (2011)<br />
Res.J.Chem.Sci.<br />
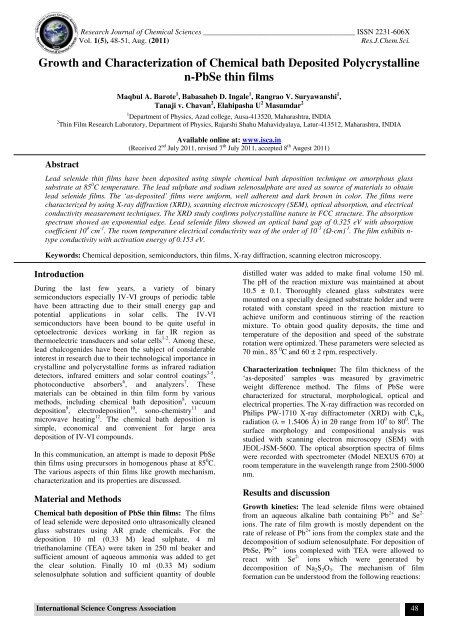
<strong>Growth</strong> <strong>and</strong> <strong>Characterization</strong> <strong>of</strong> <strong>Chemical</strong> <strong>bath</strong> <strong>Deposited</strong> Polycrystalline<br />
n-PbSe thin films<br />
Maqbul A. Barote 1 , Babasaheb D. Ingale 1 , Rangrao V. Suryawanshi 1 ,<br />
Tanaji v. Chavan 2 , Elahipasha U 2 Masumdar 2<br />
1 Department <strong>of</strong> Physics, Azad college, Ausa-413520, Maharashtra, INDIA<br />
2 Thin Film Research Laboratory, Department <strong>of</strong> Physics, Rajarshi Shahu Mahavidyalaya, Latur-413512, Maharashtra, INDIA<br />
Abstract<br />
Available online at: www.isca.in<br />
(Received 2 nd July 2011, revised 7 th July 2011, accepted 8 th Augest 2011)<br />
Lead selenide thin films have been deposited using simple chemical <strong>bath</strong> deposition technique on amorphous glass<br />
substrate at 85 0 C temperature. The lead sulphate <strong>and</strong> sodium selenosulphate are used as source <strong>of</strong> materials to obtain<br />
lead selenide films. The ‘as-deposited’ films were uniform, well adherent <strong>and</strong> dark brown in color. The films were<br />
characterized by using X-ray diffraction (XRD), scanning electron microscopy (SEM), optical absorption, <strong>and</strong> electrical<br />
conductivity measurement techniques. The XRD study confirms polycrystalline nature in FCC structure. The absorption<br />
spectrum showed an exponential edge. Lead selenide films showed an optical b<strong>and</strong> gap <strong>of</strong> 0.325 eV with absorption<br />
coefficient 10 4 cm -1 . The room temperature electrical conductivity was <strong>of</strong> the order <strong>of</strong> 10 -3 (Ω-cm) -1 . The film exhibits n-<br />
type conductivity with activation energy <strong>of</strong> 0.153 eV.<br />
Keywords: <strong>Chemical</strong> deposition, semiconductors, thin films, X-ray diffraction, scanning electron microscopy.<br />
Introduction<br />
During the last few years, a variety <strong>of</strong> binary<br />
semiconductors especially IV-VI groups <strong>of</strong> periodic table<br />
have been attracting due to their small energy gap <strong>and</strong><br />
potential applications in solar cells. The IV-VI<br />
semiconductors have been bound to be quite useful in<br />
optoelectronic devices working in far IR region as<br />
thermoelectric transducers <strong>and</strong> solar cells 1-2 . Among these,<br />
lead chalcogenides have been the subject <strong>of</strong> considerable<br />
interest in research due to their technological importance in<br />
crystalline <strong>and</strong> polycrystalline forms as infrared radiation<br />
detectors, infrared emitters <strong>and</strong> solar control coatings 3-5 ,<br />
photoconductive absorbers 6 , <strong>and</strong> analyzers 7 . These<br />
materials can be obtained in thin film form by various<br />
methods, including chemical <strong>bath</strong> deposition 8 , vacuum<br />
deposition 9 , electrodeposition 10 , sono-chemistry 11 <strong>and</strong><br />
microwave heating 12 . The chemical <strong>bath</strong> deposition is<br />
simple, economical <strong>and</strong> convenient for large area<br />
deposition <strong>of</strong> IV-VI compounds.<br />
In this communication, an attempt is made to deposit PbSe<br />
thin films using precursors in homogenous phase at 85 0 C.<br />
The various aspects <strong>of</strong> thin films like growth mechanism,<br />
characterization <strong>and</strong> its properties are discussed.<br />
Material <strong>and</strong> Methods<br />
<strong>Chemical</strong> <strong>bath</strong> deposition <strong>of</strong> PbSe thin films: The films<br />
<strong>of</strong> lead selenide were deposited onto ultrasonically cleaned<br />
glass substrates using AR grade chemicals. For the<br />
deposition 10 ml (0.33 M) lead sulphate, 4 ml<br />
triethanolamine (TEA) were taken in 250 ml beaker <strong>and</strong><br />
sufficient amount <strong>of</strong> aqueous ammonia was added to get<br />
the clear solution. Finally 10 ml (0.33 M) sodium<br />
selenosulphate solution <strong>and</strong> sufficient quantity <strong>of</strong> double<br />
distilled water was added to make final volume 150 ml.<br />
The pH <strong>of</strong> the reaction mixture was maintained at about<br />
10.5 ± 0.1. Thoroughly cleaned glass substrates were<br />
mounted on a specially designed substrate holder <strong>and</strong> were<br />
rotated with constant speed in the reaction mixture to<br />
achieve uniform <strong>and</strong> continuous stirring <strong>of</strong> the reaction<br />
mixture. To obtain good quality deposits, the time <strong>and</strong><br />
temperature <strong>of</strong> the deposition <strong>and</strong> speed <strong>of</strong> the substrate<br />
rotation were optimized. These parameters were selected as<br />
70 min., 85 0 C <strong>and</strong> 60 ± 2 rpm, respectively.<br />
<strong>Characterization</strong> technique: The film thickness <strong>of</strong> the<br />
‘as-deposited’ samples was measured by gravimetric<br />
weight difference method. The films <strong>of</strong> PbSe were<br />
characterized for structural, morphological, optical <strong>and</strong><br />
electrical properties. The X-ray diffraction was recorded on<br />
Philips PW-1710 X-ray diffractometer (XRD) with C u k α<br />
radiation (λ = 1.5406 Å) in 2θ range from 10 0 to 80 0 . The<br />
surface morphology <strong>and</strong> compositional analysis was<br />
studied with scanning electron microscopy (SEM) with<br />
JEOL-JSM-5600. The optical absorption spectra <strong>of</strong> films<br />
were recorded with spectrometer (Model NEXUS 670) at<br />
room temperature in the wavelength range from 2500-5000<br />
nm.<br />
Results <strong>and</strong> discussion<br />
<strong>Growth</strong> kinetics: The lead selenide films were obtained<br />
from an aqueous alkaline <strong>bath</strong> containing Pb 2+ <strong>and</strong> Se 2-<br />
ions. The rate <strong>of</strong> film growth is mostly dependent on the<br />
rate <strong>of</strong> release <strong>of</strong> Pb 2+ ions from the complex state <strong>and</strong> the<br />
decomposition <strong>of</strong> sodium selenosulphate. For deposition <strong>of</strong><br />
PbSe, Pb 2+ ions complexed with TEA were allowed to<br />
react with Se 2- ions which were generated by<br />
decomposition <strong>of</strong> Na 2 S 2 O 3 . The mechanism <strong>of</strong> film<br />
formation can be understood from the following reactions:<br />
International Science Congress Association 48
Research Journal <strong>of</strong> <strong>Chemical</strong> Sciences _______________________________________________________ ISSN 2231-606X<br />
Vol. 1(5), 48-51, Aug. (2011)<br />
Res.J.Chem.Sci.<br />
0<br />
85 C 2 +<br />
[ Pb (TEA) ] ⎯ ⎯⎯ → Pb + n (TEA)<br />
n<br />
0<br />
− 85 C<br />
2-<br />
Na 2 SeSO<br />
3<br />
+ 2OH ⎯⎯ → Na<br />
2SO<br />
4<br />
+ Se + H<br />
2O<br />
Pb<br />
2 +<br />
+ Se<br />
2 -<br />
0<br />
85 C<br />
⎯ ⎯ →<br />
PbSe<br />
The overall growth process occurs by ion-by-ion process.<br />
It is found that growth rate sensitively depends on<br />
temperature, pH <strong>of</strong> the reaction mixture, speed <strong>of</strong> substrate<br />
rotation, deposition time <strong>and</strong> initial concentration <strong>of</strong> ions.<br />
figure 1 shows a plot <strong>of</strong> thickness <strong>of</strong> the film versus time <strong>of</strong><br />
deposition. The nature <strong>of</strong> plot indicates that film grow in<br />
two different phases firstly in quasi linear phase <strong>and</strong><br />
second, saturation phase. The later is due to the depletion<br />
<strong>of</strong> the ions in reaction container.<br />
Thickness (nm)<br />
Figure-1<br />
A plot <strong>of</strong> thickness versus time for PbSe thin film<br />
340<br />
320<br />
300<br />
280<br />
260<br />
240<br />
220<br />
200<br />
180<br />
160<br />
Structural properties: The XRD measurements were<br />
performed in order to investigate the structural properties<br />
<strong>of</strong> the ‘as-deposited’ PbSe thin films. The XRD spectrum<br />
is given in Fig. 2. The presence <strong>of</strong> several peaks in the<br />
XRD pattern revealed that ‘as-deposited’ film is<br />
polycrystalline in nature. The observed‘d’ values <strong>and</strong><br />
respective prominent peaks corresponding to the reflection<br />
from (1 1 1), (2 0 0), (2 2 0), (3 1 1 ), (2 2 2) <strong>and</strong> (4 2 0)<br />
planes coincides well with the st<strong>and</strong>ard JCPDS data 13 .<br />
The matching <strong>of</strong> the observed <strong>and</strong> st<strong>and</strong>ard‘d’-values<br />
confirms that the deposited films are <strong>of</strong> PbSe with face<br />
centered cubic structure. The lattice parameter <strong>of</strong> cubic<br />
phase was calculated by using st<strong>and</strong>ard formula 14 . The<br />
calculated lattice parameter value ‘a’ for this sample is<br />
listed in Table 1. The crystallite size <strong>of</strong> PbSe thin films was<br />
calculated by using Scherrer’s formula 15 . The average<br />
crystallite size was calculated by resolving the highest<br />
intense peak. It was found to be 10.2 nm. The micro strain<br />
was calculated by using formula<br />
β Cosθ<br />
D =<br />
4<br />
The micro strain was found to be 3.55 × 10 -3 .<br />
(4)<br />
(1)<br />
(2)<br />
(3)<br />
10 20 30 40 50 60 70 80 90 100<br />
Deposition time (min.)<br />
Table-1<br />
Crystallographic parameters <strong>of</strong> chemically deposited<br />
PbSe thin film<br />
Compo.<br />
PbSe<br />
d (Å)<br />
(st<strong>and</strong>ard)<br />
d (Å)<br />
(observed)<br />
(h k l)<br />
planes<br />
3.5360 3.5220 1 1 1<br />
3.0620 3.0538 2 0 0<br />
2.1650 2.1536 2 2 0<br />
1.8460 1.8184 3 1 1<br />
1.7680 1.7538 2 2 2<br />
1.3690 1.3566 4 2 0<br />
Lattice<br />
constant<br />
(Å)<br />
6.0787<br />
Figure-2<br />
XRD pattern <strong>of</strong> ‘as-deposited’ PbSe thin film<br />
Intensity (a.u.)<br />
(111)<br />
(200)<br />
(220)<br />
(311)<br />
(222)<br />
10 20 30 40 50 60 70 80<br />
2θ<br />
Surface morphology: The morphological studies <strong>of</strong> the<br />
film have been carried out using SEM. The SEM<br />
micrograph <strong>of</strong> ‘as-deposited’ PbSe thin film at 30,000<br />
×magnification is shown in figure 3. The film shows<br />
smooth <strong>and</strong> uniform surface without cracks <strong>and</strong> pinholes.<br />
A compact polycrystalline texture composed <strong>of</strong> a single<br />
type <strong>of</strong> small, densely packed smaller crystallites grown<br />
over fine grained background were observed. The presence<br />
<strong>of</strong> fine grain background is an indication <strong>of</strong> one-step<br />
growth by multiple nucleations 16 . The average size <strong>of</strong><br />
smaller grains was found to be around 150 nm.<br />
Figure-3<br />
The SEM micrograph <strong>of</strong> PbSe thin film at<br />
30,000 × magnification<br />
(420)<br />
International Science Congress Association 49
Research Journal <strong>of</strong> <strong>Chemical</strong> Sciences _______________________________________________________ ISSN 2231-606X<br />
Vol. 1(5), 48-51, Aug. (2011)<br />
Res.J.Chem.Sci.<br />
Optical properties: The optical absorption measurements<br />
were recorded in the range <strong>of</strong> 2500–5000 nm at room<br />
temperature without considering losses due to scattering<br />
<strong>and</strong> transmission. The optical b<strong>and</strong>-gap <strong>and</strong> the nature <strong>of</strong><br />
optical transitions can be obtained in dependence <strong>of</strong><br />
absorption coefficient on photon energy. The absorption<br />
coefficient (α) <strong>and</strong> the incident photon energy (hν) is<br />
related by the following equation 17<br />
α h υ = A(h υ − E<br />
n<br />
)<br />
g<br />
(5)<br />
where α is absorption coefficient (cm −1 ), hν the photon<br />
energy (eV), A <strong>and</strong> n are constants. A is complex<br />
parameter, which depends on temperature, photon energy<br />
etc. The n values are 0.5, 1.5, 2, <strong>and</strong> 3 for allowed direct,<br />
forbidden direct, allowed indirect <strong>and</strong> forbidden indirect<br />
transitions, respectively, E g is the direct b<strong>and</strong> gap energy.<br />
The optical b<strong>and</strong>-gap <strong>of</strong> lead selenide film was estimated<br />
by plotting the variation <strong>of</strong> (αhν) 2 versus hν <strong>and</strong><br />
extrapolating the linear portion near the onset <strong>of</strong> absorption<br />
edge to the energy axis, which is plotted in figure 4. In the<br />
present case <strong>of</strong> PbSe thin film, the plot <strong>of</strong> (αhν) 2 vs. hν<br />
(figure 4) show a linear portion indicating that the relation<br />
in equation (5) holds good for PbSe film if n = 0.5. This<br />
means that the optical transitions in the case <strong>of</strong> PbSe films<br />
are direct transitions. The linear portions <strong>of</strong> the curves<br />
were extrapolated to get the optical b<strong>and</strong> gap (figure 4).<br />
The optical b<strong>and</strong> gap for PbSe thin film is found to be 0.33<br />
eV.<br />
Figure-4<br />
Variation <strong>of</strong> (αhν) 2 versus hν for PbSe thin film<br />
(αhν 2 x 10 10 (eV/cm) 2 )<br />
3.5<br />
3.0<br />
2.5<br />
2.0<br />
1.5<br />
1.0<br />
0.31 0.32 0.33 0.34 0.35 0.36<br />
hν (eV)<br />
Electrical resistivity studies: The electrical resistivity <strong>of</strong><br />
‘as-deposited’ PbSe thin film sample was measured in the<br />
temperature range 300-500 K using a st<strong>and</strong>ard DC two<br />
point probe method under dark. A plot <strong>of</strong> inverse absolute<br />
temperature versus log (resistivity) is shown in figure 5.<br />
From figure 5 it is seen that the variation indicates two<br />
distinct temperature zones with two characteristic regions.<br />
It is observed that resistivity decreases with increase in<br />
temperature which is the indication <strong>of</strong> typical<br />
semiconductor characteristics. The room temperature<br />
electrical resistivity is found to be 6.35 × 10 2 Ω-cm. The<br />
activation energy <strong>of</strong> the chemical <strong>bath</strong> deposited PbSe film<br />
is calculated using the electrical resistivity result which is<br />
shown in figure 5. The value <strong>of</strong> activation energy (E a ) was<br />
calculated by equation given by 18<br />
ρ ⎛ ⎞<br />
= ρ exp Ea<br />
o ⎜ ⎟<br />
⎝ kT ⎠<br />
where ρ <strong>and</strong> ρ o are electrical resistivity, k is Boltzmann<br />
constant <strong>and</strong> T is absolute temperature. The activation<br />
energy for low temperature region <strong>and</strong> high temperature<br />
region is found to be 0.204 eV <strong>and</strong> 0.312 eV respectively.<br />
Figure-5<br />
Variation <strong>of</strong> log (resistivity) vs 1/T for PbSe thin film<br />
Log (resistivity)<br />
3.0<br />
2.8<br />
2.6<br />
2.4<br />
2.2<br />
2.0<br />
1.8<br />
1.6<br />
Thermoelectric power (TEP) measurements: The<br />
thermoelectric power is the ratio <strong>of</strong> thermally generated<br />
voltage to the temperature difference in the semiconductor,<br />
which gives the information about charge carriers in the<br />
deposited material. In thermoelectric power measurements,<br />
the open circuit thermo-voltage generated by film sample<br />
when a temperature gradient is applied across a length <strong>of</strong> a<br />
sample is measured. The type <strong>of</strong> conductivity exhibited by<br />
chemical <strong>bath</strong> deposited PbS thin film is determined by<br />
thermoelectric power (TEP) measurement. The TEP<br />
depends on the location <strong>of</strong> Fermi energy level in the<br />
material <strong>and</strong> the type <strong>of</strong> scattering mechanism. These<br />
variations are found to be non-linear with n-type<br />
conduction. The non-linearity indicates non-degeneracy <strong>of</strong><br />
the material whose thermoelectric power is proportional to<br />
n th power <strong>of</strong> absolute temperature 18 . From the sign <strong>of</strong> the<br />
terminal connected towards hot end it can be deduced the<br />
sign <strong>of</strong> the predominant charge carriers. In our case the hot<br />
end is connected to the positive terminal, the film shows n-<br />
type conductivity. The vacancies <strong>and</strong> interstitials control<br />
the conductivity type, an excess <strong>of</strong> Pb causes n-type<br />
conductivity 19 .<br />
Conclusions<br />
1.8 2.0 2.2 2.4 2.6 2.8 3.0 3.2 3.4<br />
1000/T (K -1 )<br />
In summary, polycrystalline n-PbSe thin films have been<br />
synthesized by simple <strong>and</strong> economical chemical <strong>bath</strong><br />
deposition technique. The structural studies indicate that<br />
the film sample is nanocrystalline in nature with cubic<br />
structure. The optical b<strong>and</strong> gap <strong>of</strong> ‘as-deposited’ film was<br />
found to be 0.33 eV having direct b<strong>and</strong> type transitions.<br />
The temperature dependence <strong>of</strong> the dc conductivity<br />
suggests that there are two types <strong>of</strong> conduction channels<br />
that contribute to the conductivity. The TEP measurement<br />
showed n-type conductivity.<br />
International Science Congress Association 50
Research Journal <strong>of</strong> <strong>Chemical</strong> Sciences _______________________________________________________ ISSN 2231-606X<br />
Vol. 1(5), 48-51, Aug. (2011)<br />
Res.J.Chem.Sci.<br />
Acknowledgements<br />
One <strong>of</strong> the authors Mr. M. A. Barote is grateful to the<br />
University Grants Commission, New Delhi (West Regional<br />
Office, Pune), India for the financial assistance through the<br />
Minor Research Project No. F.47-1201/2009.<br />
References<br />
1. L<strong>of</strong>ersky J.J., J. Appl. Phys. 27, 77 (1956)<br />
2. Singh J.P. <strong>and</strong> Bedi R.K., Thin Solid Films, 199, 9<br />
(1991)<br />
3. Nair P.K. <strong>and</strong> Nair M.T.S, J. Phys. D: Appl. Phys.,<br />
23, 150 (1990)<br />
4. Dobson K.D., Hodes G. <strong>and</strong> Mastai Y., Sol. Energy<br />
Mater. Sol. Cells, 80, 283 (2003)<br />
5. Elabd H. <strong>and</strong> Steckl A.J., J. Appl. Phys. 51, 726<br />
(1980)<br />
6. Brus L, Curr. Opin., Colloid Interf. Sci., 2, 197<br />
(1996)<br />
7. Shrikantiah R.V., ISRAPS Bull., 12, 15 (2001)<br />
8. Schmidt, Chem. Rev., 92, 1709 (1992)<br />
9. Das V. D. <strong>and</strong> Bhat K.S., J. Mater. Sci., 7, 169<br />
(1990)<br />
10. Molin N. <strong>and</strong> Dikusar A, Thin Solid Films, 265, 3<br />
(1995)<br />
11. Li B., Xie Y., Huang J. <strong>and</strong> Qian Y.T., Ultrason.<br />
Sonochem., 6, 217 (1991)<br />
12. Zhu J. J., Palchik O., Chem S.G <strong>and</strong> Gedanken A., J.<br />
Phys. Chem., 104, 7344 (2000)<br />
13. JCPDS Data card no. 06-0354<br />
14. Barote M.A., Yadav A.A., <strong>and</strong> Masumdar E.U.,<br />
Physica B., 406, 1865 (2011)<br />
15. Barote M.A.,Yadav A.A., Chavan T.V <strong>and</strong><br />
Masumdar E.U., DJNB, 6, 979 (2011)<br />
16. Sawant R.R., Rajpure K.Y., <strong>and</strong> Bhosale C.H.,<br />
Physica B., 393, 249 (2007)<br />
17. Barote M.A., Yadav A.A <strong>and</strong> Masumdar E.U.,<br />
Chalcogenide Letters, 2, 129 (2011)<br />
18. Yadav A.A., Barote M.A, <strong>and</strong> Masumdar E.U, Solid<br />
State Sciences., 121, 1173 (2010)<br />
19. Saloniemi H., Academic Dissertation, VTT Pub. 423,<br />
32 (2000)<br />
International Science Congress Association 51