Study of the Removal of Malachite Green from Aqueous ... - ISCA
Study of the Removal of Malachite Green from Aqueous ... - ISCA
Study of the Removal of Malachite Green from Aqueous ... - ISCA

You also want an ePaper? Increase the reach of your titles
YUMPU automatically turns print PDFs into web optimized ePapers that Google loves.
Research Journal <strong>of</strong> Chemical Sciences Vol. 1 (1) April (2011)<br />
Res.J.Chem.Sci.<br />
<strong>Study</strong> <strong>of</strong> <strong>the</strong> <strong>Removal</strong> <strong>of</strong> <strong>Malachite</strong> <strong>Green</strong> <strong>from</strong> <strong>Aqueous</strong> Solution by using Solid<br />
Agricultural Waste<br />
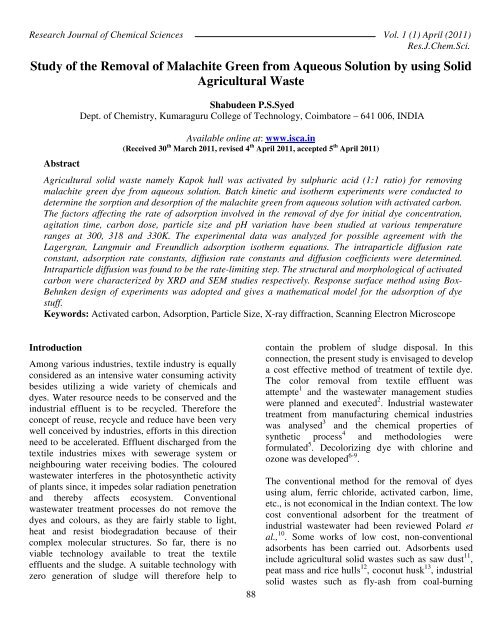
Abstract<br />
Shabudeen P.S.Syed<br />
Dept. <strong>of</strong> Chemistry, Kumaraguru College <strong>of</strong> Technology, Coimbatore – 641 006, INDIA<br />
Available online at: www.isca.in<br />
(Received 30 th March 2011, revised 4 th April 2011, accepted 5 th April 2011)<br />
Agricultural solid waste namely Kapok hull was activated by sulphuric acid (1:1 ratio) for removing<br />
malachite green dye <strong>from</strong> aqueous solution. Batch kinetic and iso<strong>the</strong>rm experiments were conducted to<br />
determine <strong>the</strong> sorption and desorption <strong>of</strong> <strong>the</strong> malachite green <strong>from</strong> aqueous solution with activated carbon.<br />
The factors affecting <strong>the</strong> rate <strong>of</strong> adsorption involved in <strong>the</strong> removal <strong>of</strong> dye for initial dye concentration,<br />
agitation time, carbon dose, particle size and pH variation have been studied at various temperature<br />
ranges at 300, 318 and 330K. The experimental data was analyzed for possible agreement with <strong>the</strong><br />
Lagergran, Langmuir and Freundlich adsorption iso<strong>the</strong>rm equations. The intraparticle diffusion rate<br />
constant, adsorption rate constants, diffusion rate constants and diffusion coefficients were determined.<br />
Intraparticle diffusion was found to be <strong>the</strong> rate-limiting step. The structural and morphological <strong>of</strong> activated<br />
carbon were characterized by XRD and SEM studies respectively. Response surface method using Box-<br />
Behnken design <strong>of</strong> experiments was adopted and gives a ma<strong>the</strong>matical model for <strong>the</strong> adsorption <strong>of</strong> dye<br />
stuff.<br />
Keywords: Activated carbon, Adsorption, Particle Size, X-ray diffraction, Scanning Electron Microscope<br />
Introduction<br />
Among various industries, textile industry is equally<br />
considered as an intensive water consuming activity<br />
besides utilizing a wide variety <strong>of</strong> chemicals and<br />
dyes. Water resource needs to be conserved and <strong>the</strong><br />
industrial effluent is to be recycled. Therefore <strong>the</strong><br />
concept <strong>of</strong> reuse, recycle and reduce have been very<br />
well conceived by industries, efforts in this direction<br />
need to be accelerated. Effluent discharged <strong>from</strong> <strong>the</strong><br />
textile industries mixes with sewerage system or<br />
neighbouring water receiving bodies. The coloured<br />
wastewater interferes in <strong>the</strong> photosyn<strong>the</strong>tic activity<br />
<strong>of</strong> plants since, it impedes solar radiation penetration<br />
and <strong>the</strong>reby affects ecosystem. Conventional<br />
wastewater treatment processes do not remove <strong>the</strong><br />
dyes and colours, as <strong>the</strong>y are fairly stable to light,<br />
heat and resist biodegradation because <strong>of</strong> <strong>the</strong>ir<br />
complex molecular structures. So far, <strong>the</strong>re is no<br />
viable technology available to treat <strong>the</strong> textile<br />
effluents and <strong>the</strong> sludge. A suitable technology with<br />
zero generation <strong>of</strong> sludge will <strong>the</strong>refore help to<br />
88<br />
contain <strong>the</strong> problem <strong>of</strong> sludge disposal. In this<br />
connection, <strong>the</strong> present study is envisaged to develop<br />
a cost effective method <strong>of</strong> treatment <strong>of</strong> textile dye.<br />
The color removal <strong>from</strong> textile effluent was<br />
attempte 1 and <strong>the</strong> wastewater management studies<br />
were planned and executed 2 . Industrial wastewater<br />
treatment <strong>from</strong> manufacturing chemical industries<br />
was analysed 3 and <strong>the</strong> chemical properties <strong>of</strong><br />
syn<strong>the</strong>tic process 4 and methodologies were<br />
formulated 5 . Decolorizing dye with chlorine and<br />
ozone was developed 6-9 .<br />
The conventional method for <strong>the</strong> removal <strong>of</strong> dyes<br />
using alum, ferric chloride, activated carbon, lime,<br />
etc., is not economical in <strong>the</strong> Indian context. The low<br />
cost conventional adsorbent for <strong>the</strong> treatment <strong>of</strong><br />
industrial wastewater had been reviewed Polard et<br />
al., 10 . Some works <strong>of</strong> low cost, non-conventional<br />
adsorbents has been carried out. Adsorbents used<br />
include agricultural solid wastes such as saw dust 11 ,<br />
peat mass and rice hulls 12 , coconut husk 13 , industrial<br />
solid wastes such as fly-ash <strong>from</strong> coal-burning
Research Journal <strong>of</strong> Chemical Sciences<br />
industries 14 and Fe(III)/Cr(III) hydroxide 15 . A study<br />
on <strong>the</strong> use <strong>of</strong> wastes <strong>of</strong> biogas residual slurry and<br />
waste banana pith which is <strong>the</strong> effective removal <strong>of</strong><br />
Congo red, malachite green and acid violet 16,17<br />
bagasse and paddy straw 18 , coir pith 19 . Nonconventional<br />
material like chitosan 20 , chitosan fibre,<br />
<strong>the</strong>rmal power waste 21 , red mud 22 , Silica fomes 23 ,<br />
Eucalyptus bark 24 , Carbon <strong>from</strong> cassava peels 25 .<br />
Activated carbon <strong>from</strong> Jackfruit peel 26 , activated<br />
Par<strong>the</strong>nium 27 palm nut shells, cashew nut shells and<br />
Broom sticks 28 , Flyash 29 , saw dust 30 , C<strong>of</strong>fee grounds<br />
31 and pine saw dust 32 .<br />
The objective <strong>of</strong> <strong>the</strong> present study is to prepare and<br />
characterize quality and evaluate <strong>the</strong> efficiency <strong>of</strong><br />
using Kapok hull carbon as an adsorbent for <strong>the</strong><br />
removal <strong>of</strong> dye like malachite green. However in <strong>the</strong><br />
present study malachite green has been subjected for<br />
color removal using KHAC. After considering <strong>the</strong><br />
efficiency <strong>of</strong> color removal, <strong>the</strong> study was extended<br />
for o<strong>the</strong>r adsorbate and such study has not been<br />
attempted earlier. The adsorption study was carried<br />
out systematically involving various parameters such<br />
as agitation time, initial concentration, adsorbent<br />
dose, desorption, pH and temperature. The Box-<br />
Behnken design study model was adopted. The data<br />
generated over this study have been tabulated and<br />
discussed.<br />
Materials and Methods<br />
The kapok hull was cut into small pieces, dried in<br />
sunlight, <strong>the</strong>n 333K for 24 hours in hot air oven. The<br />
dried material is digested in sulphuric acid (ratio 1:1)<br />
and kept at room temperature overnight. Then it was<br />
washed with doubled distilled water to remove <strong>the</strong><br />
excess acid and kept in hot air oven at 383K for 12<br />
hours. Then it was taken in an iron vessel in muffle<br />
furnace and <strong>the</strong> temperature was gradually raised to<br />
823K for an hour, ground well by using ball mill and<br />
<strong>the</strong>n sieved into particle size <strong>of</strong> 250,150 and 100BSS<br />
mesh numbers. The preparation <strong>of</strong> stock solution <strong>of</strong><br />
dye for 1000ppm by using double distilled water.<br />
These dye solutions were taken for adsorption<br />
studies with KHAC. The characterization <strong>of</strong> KHAC<br />
was carried out and <strong>the</strong> results were tabulated in<br />
table 1.<br />
89<br />
Vol. 1 (1) April (2011)<br />
Res.J.Chem.Sci.<br />
<strong>Malachite</strong> green is a basic dye and water soluble. It<br />
dissociate into anion and coloured cations. The<br />
electrostatic attraction builds up between <strong>the</strong><br />
coloured cations and acidic groups <strong>of</strong> acrylic fibres<br />
lead to form salt and develop <strong>the</strong> colour fade upon<br />
<strong>the</strong> fabrics. The structural studies will open <strong>the</strong> door<br />
to know about <strong>the</strong> adsorption mechanism involved<br />
with <strong>the</strong>se dyes. It belongs to triphenyl methane class<br />
and it contains two amino groups. The structure <strong>of</strong><br />
malachite green as given below.<br />
Structure <strong>of</strong> <strong>Malachite</strong> <strong>Green</strong> (λ max : 616.5 nm)<br />
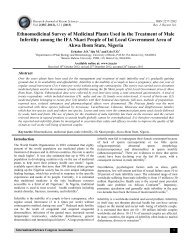
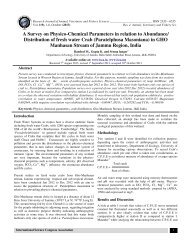
The adsorbent KHAC sieved particle size <strong>of</strong> 250BSS<br />
mesh number was magnified by Scanning Electron<br />
Microscope (SEM) studies by using JOEL JSM 8404<br />
Scanning microscope as shown in <strong>the</strong> Fig.1. The X-<br />
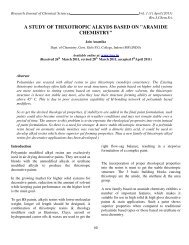
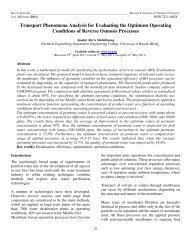
ray diffraction studies <strong>of</strong> KHAC were carried out<br />
using Rot<strong>of</strong>lux X-ray Diffractometer 20KW/20A,<br />
Model 10.61 with a Microprocessor recorder. The<br />
XRD pattern <strong>of</strong> <strong>the</strong> KHAC is shown in <strong>the</strong> Fig.2.<br />
The morphological and XRD studies clearly revealed<br />
that <strong>the</strong> adsorbent is amorphous and highly porous in<br />
nature. From <strong>the</strong> SEM analysis it was found that<br />
<strong>the</strong>re were holes and cave type openings on <strong>the</strong><br />
surface <strong>of</strong> <strong>the</strong> adsorbent, which would have more<br />
surface area available for adsorption 33 .<br />
The Freundlich and Langmuir iso<strong>the</strong>rm studies and<br />
Lagergran kinetic studies at various temperatures,<br />
dye solution <strong>of</strong> various concentrations was agitated<br />
with 1g <strong>of</strong> <strong>the</strong> adsorbent <strong>of</strong> 250, 150 and 100BSS<br />
mesh number particle size over a period <strong>of</strong> time with<br />
constant stirring at various pH (4, 6.7 and 9.2). The<br />
carbon dosage (mg/l) <strong>of</strong> 100 to 1400 was agitated<br />
with a known concentration <strong>of</strong> dye solution.<br />
The exhausted activated carbon was used for<br />
desorption studies. The carbon loaded with dye was
Research Journal <strong>of</strong> Chemical Sciences Vol. 1 (1) April (2011)<br />
Res.J.Chem.Sci.<br />
separated and gently washed with distilled water to which adsorbate is adsorbed on <strong>the</strong> adsorbent surface<br />
remove any unadsorbed dyes. The dye-laden carbons and <strong>the</strong> adsorbed layer is unimolecular”.<br />
were agitated with 100ml <strong>of</strong> neutral pH water, 1M<br />
sulpuric acid, 1M sodium hydroxide, 10% acetic acid<br />
(v/v) and 50% acetic acid (v/v) separately for 1 hour.<br />
The response surface method using <strong>the</strong> Box-<br />
Behnken design 34 <strong>of</strong> experiments gives a<br />
ma<strong>the</strong>matical model for <strong>the</strong> adsorption <strong>of</strong> dyestuff.<br />
In this study <strong>the</strong> effect <strong>of</strong> several factors influencing<br />
<strong>the</strong> dye adsorption such as pH, particle size and<br />
temperature have been considered as <strong>the</strong> critical<br />
variables designated as X 1 , X 2 and X 3 respectively<br />
and statistical design was used to determine <strong>the</strong><br />
optimal levels <strong>of</strong> adsorption studies. The low, middle<br />
and high level <strong>of</strong> each variable pH (4, 6.5 and 9),<br />
particle size (250, 150 and 100BSS mesh number)<br />
and temperature (300, 318 and 330K) were<br />
designated as -1, 0 and +1 respectively. For <strong>the</strong> three<br />
significant independent variables X 1 , X 2 and X 3 , <strong>the</strong><br />
ma<strong>the</strong>matical relationship <strong>of</strong> <strong>the</strong> predicted response<br />
on <strong>the</strong>se variables can be approximated by <strong>the</strong><br />
quadratic model equation<br />
M=A 0 +A 1 X 1 +A 2 X 2 +A 3 X 3 +A 11 X 1 +A 22 X 2 2 +A 33 X 3 2 +<br />
A 12 X 1 X 2 +A 13 X 1 X 3 +A 23 X 2 X 3<br />
Where M is <strong>the</strong> predicted response, A 0 is constant,<br />
X 1 is pH, X 2 is particle size and X 3 is Temperature,<br />
A 1 , A 2 , A 3 are linear coefficients, A 12 , A 13 and A 23<br />
are cross product quadratic coefficients. The degree<br />
<strong>of</strong> experiments chosen for this study was Box-<br />
Behnken 35 , a fractional design for <strong>the</strong> three<br />
independent variables. It is applicable once <strong>the</strong><br />
critical variables have been identified 36 . The design<br />
is preferred only because relatively few experimental<br />
combinations <strong>of</strong> <strong>the</strong> variables are adequate to<br />
estimate potentially complex response functions. For<br />
<strong>the</strong> Box-Behnken design <strong>of</strong> three independent<br />
variables, a total <strong>of</strong> 15 experiments were necessary<br />
to estimate <strong>the</strong> 10 coefficients <strong>of</strong> <strong>the</strong> model 37 . The<br />
present study models were presented and used for<br />
surface plot study.<br />
Results and Discussion<br />
Langmuir Adsorption Iso<strong>the</strong>rm: Langmuir<br />
adsorption iso<strong>the</strong>rm is based on <strong>the</strong> assumption that,<br />
“Adsorption is a type <strong>of</strong> chemical combination in<br />
90<br />
Langmuir represented <strong>the</strong> following equation, q e =<br />
(Q 0 x b x C e ) / (1 + (b x C e )), where, q e is equal to<br />
<strong>the</strong> quantity <strong>of</strong> dye adsorbed in mg/g <strong>of</strong> <strong>the</strong><br />
adsorbent, Q 0 is <strong>the</strong> maximum quantity <strong>of</strong> dye<br />
adsorbed in mg/gram <strong>of</strong> <strong>the</strong> adsorbent, b and C e is<br />
<strong>the</strong> constant <strong>of</strong> Langmuir adsorption and <strong>the</strong> dye<br />
concentration at equilibrium in mg/l respectively.<br />
Langmuir adsorption parameters are determined by<br />
transforming <strong>the</strong> equation, which is in linear form.<br />
The Linear plot <strong>of</strong> C e /q e Vs C e showed that <strong>the</strong><br />
adsorption followed Langmuir iso<strong>the</strong>rm model. The<br />
values <strong>of</strong> monolayer capacity ‘Q 0 ’ and Langmuir<br />
constant ‘b’ had been evaluated <strong>from</strong> <strong>the</strong> intercept<br />
and slope <strong>of</strong> <strong>the</strong>se plots by using graphical<br />
techniques.<br />
The effect <strong>of</strong> iso<strong>the</strong>rm shape has been taken into<br />
consideration with a view to predict whe<strong>the</strong>r <strong>the</strong><br />
studied adsorption system is favorable or<br />
unfavorable. The essential features <strong>of</strong> <strong>the</strong> Langmuir<br />
iso<strong>the</strong>rm may be expressed in terms <strong>of</strong> equilibrium<br />
parameter R L , which is a dimension less constant<br />
referred to as separation factor or equilibrium<br />
parameter 38 . R L =1/(1+bC 0 ), where C 0 is <strong>the</strong> initial<br />
concentration and ‘b’ is <strong>the</strong> constant related to <strong>the</strong><br />
energy <strong>of</strong> adsorption (Langmuir constant). The<br />
values <strong>of</strong> R L indicate <strong>the</strong> nature <strong>of</strong> <strong>the</strong> iso<strong>the</strong>rm, if<br />
<strong>the</strong> conditions are R L >1, R L =1, 0
Research Journal <strong>of</strong> Chemical Sciences Vol. 1 (1) April (2011)<br />
Res.J.Chem.Sci.<br />
particle size for <strong>the</strong> dye was evolved and it was<br />
revealed that R L values lay between 0 and 1. It<br />
was inferred that <strong>the</strong> adsorption process followed<br />
Langmuir model and favorable for adsorption.<br />
The free energy change (∆G°), enthalpy change or<br />
total energy change (∆H°) and entropy change (∆S°)<br />
values were evolved by utilizing ma<strong>the</strong>matical tools<br />
and adopting <strong>the</strong> following <strong>the</strong>rmodynamic<br />
formulae,<br />
Free energy change, ∆G° = − RT ln b<br />
Enthalpy change or total energy change (∆H°) can be<br />
calculated by using <strong>the</strong> <strong>the</strong>rmodynamics<br />
Formula, ln [b 1 /b 2 ] = ∆H° / RT<br />
The Gibbs free energy change is, ∆G° = [∆H° −<br />
∆S°] / T<br />
The results <strong>of</strong> ∆G°, ∆H° and ∆S° were summarized<br />
in <strong>the</strong> Table 5. The positive values <strong>of</strong> ∆H° indicate<br />
that <strong>the</strong> adsorption is involved with weak forces <strong>of</strong><br />
attraction. It was observed that <strong>the</strong> ∆H° values<br />
increased with decrease <strong>of</strong> particle size. The<br />
adsorption was found to be endo<strong>the</strong>rmic in nature.<br />
The positive and increased ∆S° values for smaller<br />
particle size indicated that <strong>the</strong> KHAC showed greater<br />
affinity towards <strong>the</strong> dye. Fur<strong>the</strong>r, <strong>the</strong> negative ∆G°<br />
value indicated <strong>the</strong> spontaneous nature <strong>of</strong> <strong>the</strong><br />
adsorption model.<br />
For unimolecular reactions, <strong>the</strong> energy <strong>of</strong> activation<br />
was evolved by using <strong>the</strong> following equation, E a =<br />
∆H 0 + RT<br />
If <strong>the</strong> energy <strong>of</strong> activation <strong>of</strong> adsorption system was<br />
less than 42KJ/mol, <strong>the</strong>n <strong>the</strong> process was confirmed<br />
to be diffusion controlled. Suppose if it is in between<br />
5 to 20 KJ/mol, <strong>the</strong> sorption process was due to<br />
activated sorption. It was observed that, <strong>the</strong> value <strong>of</strong><br />
energy <strong>of</strong> activation for malachite green by KHAC<br />
was in between 5 to 20 KJ/mol in our study that<br />
confirms <strong>the</strong> activated adsorption. The carbon<br />
follows Langmuir adsorption iso<strong>the</strong>rm, it had greater<br />
affinity towards <strong>the</strong> dye <strong>the</strong>n <strong>the</strong> process was<br />
spontaneous. Similar pattern <strong>of</strong> results were inferred<br />
39, 40 .<br />
91<br />
Freundlich Adsorption Iso<strong>the</strong>rm: The linear plot<br />
<strong>of</strong> log X/m Vs log C e showed that <strong>the</strong> adsorption<br />
followed Freundlich adsorption iso<strong>the</strong>rm model. The<br />
values <strong>of</strong> X/m and C e observed <strong>from</strong> <strong>the</strong> adsorption<br />
experiments carried over by using KHAC <strong>of</strong><br />
different particle sizes namely 100, 150 and 250BSS<br />
mesh numbers <strong>of</strong> constant mass was agitated with<br />
malachite green <strong>of</strong> known concentration at various<br />
temperatures to <strong>the</strong> respective equilibrium periods<br />
are presented in Table 4. Based upon <strong>the</strong>se<br />
experiments Freundlich adsorption iso<strong>the</strong>rm plot was<br />
formed by plotting log X/m Vs log C e and <strong>the</strong> slope<br />
and intercept <strong>of</strong> this linear portion <strong>of</strong> iso<strong>the</strong>rm plots<br />
were determined by adopting graphical<br />
methodology. These slope values had indicated<br />
adsorption intensity ‘n’ and <strong>the</strong> intercept values<br />
indicated an idea about adsorption capacity K F .<br />
These values were tabulated in Table 3. It was<br />
observed that <strong>the</strong> adsorption capacity <strong>of</strong> <strong>the</strong> KHAC<br />
had increased with decrease <strong>of</strong> particle size at 300,<br />
318K <strong>of</strong> <strong>the</strong> dye selected for <strong>the</strong> present study and<br />
<strong>the</strong>re is no change for adsorption at <strong>the</strong> elevated<br />
temperatures namely 330K.<br />
The adsorption process, <strong>the</strong> surface energy q e is a<br />
function <strong>of</strong> heat for adsorption. The term K F and n<br />
are adsorption constants are used to explain<br />
adsorption process 41 . The Freundlich adsorption<br />
iso<strong>the</strong>rm is as follows, q e = X/m = K F C e 1/n ; ln X/m<br />
= ln q e = ln K F + 1/n ln C e ; where q e , C e , X and M<br />
are adsorbed amount on <strong>the</strong> adsorbent at equilibrium,<br />
equilibrium concentration <strong>of</strong> dye in solution (mg/l),<br />
amount <strong>of</strong> dye adsorbed (mg) and weight <strong>of</strong> <strong>the</strong><br />
adsorbent used (g). The constant K F represents <strong>the</strong><br />
quantity <strong>of</strong> dye adsorbed in mg/g adsorbent for a unit<br />
equilibrium concentration which is an approximate<br />
indicator <strong>of</strong> adsorption capacity. These constants can<br />
be evolved by linearising <strong>the</strong> above equation by<br />
adopting ma<strong>the</strong>matical techniques 42 .<br />
The 1/n is a measure <strong>of</strong> adsorption intensity. It was<br />
learnt that, If n = 1 <strong>the</strong>n that <strong>the</strong> partition between<br />
<strong>the</strong> two phases was independent <strong>of</strong> <strong>the</strong> concentration.<br />
If <strong>the</strong> 1/n value is below one it indicates a normal<br />
adsorption. On <strong>the</strong> o<strong>the</strong>r hand 1/n being above one<br />
indicates cooperative adsorption 43,44 . It is generally<br />
stated that <strong>the</strong> value <strong>of</strong> ‘n’ that is in <strong>the</strong> range <strong>of</strong> 2 to<br />
10, represents good adsorption iso<strong>the</strong>rm. It was also
Research Journal <strong>of</strong> Chemical Sciences Vol. 1 (1) April (2011)<br />
Res.J.Chem.Sci.<br />
observed that <strong>the</strong> ‘n’ values <strong>of</strong> <strong>the</strong> adsorbent for <strong>the</strong> more or less remained constant. Moreover, <strong>the</strong><br />
dye at various temperature and particle sizes were smoothness <strong>of</strong> <strong>the</strong> curves for dye adsorption showed<br />
found out and this value is <strong>from</strong> 2 to 10, which that <strong>the</strong> process <strong>of</strong> adsorption was continuous and<br />
confirmed that <strong>the</strong> activated carbon underwent a involved ei<strong>the</strong>r monolayer formation on <strong>the</strong><br />
favourable for Freundlich iso<strong>the</strong>rm. The adsorbent surface or monolayer coupled with o<strong>the</strong>r<br />
experimental data were attempted to fit into mechanisim predominantly with intra particle<br />
Freundlich adsorption iso<strong>the</strong>rms, and it was diffusion. Since <strong>the</strong> increase in active adsorption<br />
efficiently and most effectively fitted. It clearly sites increased with adsorbent dosage, <strong>the</strong> amount <strong>of</strong><br />
indicated that <strong>the</strong> system followed Freundlich dye adsorbed increased with sorbent dosage. The<br />
adsorption iso<strong>the</strong>rm model and <strong>the</strong> adsorbent’s large availability <strong>of</strong> adsorption sites with higher<br />
surface under study were heterogeneous. The adsorption dosage has a positive effect on <strong>the</strong> initial<br />
correlation coefficient was evolved with graphical rate <strong>of</strong> dye uptake. Similar types <strong>of</strong> trends in<br />
techniques, and it was tabulated (Table 3).<br />
These values exhibited some deviation <strong>from</strong><br />
linearity, and tried to form curves. It was clearly<br />
indicated in <strong>the</strong> graphs under observations. The<br />
reason for this behavior was that <strong>the</strong> initial curve<br />
portion represented <strong>the</strong> formation <strong>of</strong> monolayer<br />
followed by intraparticle diffusion at later stages and<br />
final plateau portion indicate <strong>the</strong> saturation <strong>of</strong><br />
adsorption process. It was summarized that <strong>the</strong><br />
KHAC followed Freundlich adsorption iso<strong>the</strong>rm<br />
model, <strong>the</strong> derived ‘n’ value for almost all dyes<br />
being in <strong>the</strong> value <strong>from</strong> 1 to 10. The graphical<br />
studies showed that <strong>the</strong> small deviation <strong>from</strong><br />
linearity, <strong>the</strong> mechanism <strong>of</strong> adsorption followed <strong>the</strong><br />
formation <strong>of</strong> monolayer, intraparticle diffusion and<br />
saturation in a favorable pattern.<br />
Kinetics <strong>of</strong> Adsorption: The adsorption kinetic<br />
study is quite significant in wastewater treatment as<br />
it describes <strong>the</strong> solute uptake rate, which in turn<br />
controls <strong>the</strong> residence time <strong>of</strong> adsorbate uptake at <strong>the</strong><br />
solid-solution interface. Dosage study is an<br />
important parameter because it determines <strong>the</strong><br />
capacity <strong>of</strong> adsorbent for a given initial<br />
concentration <strong>of</strong> <strong>the</strong> dye solution 44 . In this present<br />
investigation, <strong>the</strong> kinetics <strong>of</strong> <strong>the</strong> adsorption systems<br />
were studied by plotting <strong>the</strong> amount <strong>of</strong> dye adsorbed<br />
on <strong>the</strong> adsorbent with time for different adsorbent<br />
dosages at a constant initial concentration (100mg/l),<br />
at different temperatures and particle size 250, 150,<br />
100BSS mesh numbers. In all <strong>the</strong> experiments, it<br />
was observed that with increase in adsorbent<br />
loading, <strong>the</strong> fraction <strong>of</strong> dye removal increases and it<br />
was graphically plotted. From <strong>the</strong> nature <strong>of</strong> <strong>the</strong><br />
curves, <strong>the</strong> amount <strong>of</strong> dye adsorbed on <strong>the</strong> adsorbent<br />
92<br />
adsorption <strong>of</strong> dyes on different types <strong>of</strong> low cost<br />
adsorbents were reported 45- 47 .<br />
Adsorption rate constant: Determination <strong>of</strong><br />
efficiency <strong>of</strong> adsorption process requires a thorough<br />
understanding <strong>of</strong> kinetics <strong>of</strong> uptake <strong>of</strong> adsorbate by<br />
adsorbent or <strong>the</strong> time dependence <strong>of</strong> <strong>the</strong><br />
concentration distribution <strong>of</strong> <strong>the</strong> solute in both bulk<br />
solution and solid adsorbent and identification <strong>of</strong> rate<br />
determining step.<br />
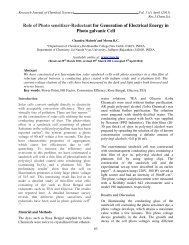
In order to investigate <strong>the</strong> mechanism <strong>of</strong> sorption<br />
and potential rate controlling steps such as mass<br />
transport and chemical reaction processes, <strong>the</strong><br />
Lagergren kinetic model (Fig.4) known as pseud<strong>of</strong>irst<br />
order equation, has been used to test <strong>the</strong><br />
experimental data.<br />
Pseudo – First Order Equation: The pseudo-first<br />
order equation <strong>of</strong> Lagergren is generally expressed<br />
as follows, dq / dt = K ad (q e − q t ); where q e and q t<br />
are <strong>the</strong> sorption capacity at equilibrium and sorption<br />
capacity at time and K ad is <strong>the</strong> rate constant <strong>of</strong><br />
pseudo – first order sorption (1/min). After<br />
integration and applying boundary condition t = 0 to<br />
t = t and q = 0 to q = q t , <strong>the</strong> integrated form becomes,<br />
log (q e −q t ) = log q e − [K ad / 2.303] t.<br />
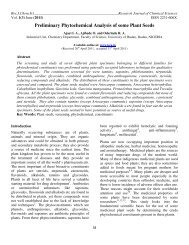
Data for Lagergren plots <strong>of</strong> dyes were presented in<br />
Fig.4. The linear plots <strong>of</strong> log (q e − q t ) Vs t showed<br />
that adsorption followed <strong>the</strong> pseudo first order rate<br />
expression given by Lagergren. The K ad value for<br />
malachite green was calculated <strong>from</strong> <strong>the</strong> slope <strong>of</strong><br />
linear plots. The rate constants for adsorption<br />
(1/min) <strong>of</strong> dye at ambient temperature <strong>of</strong> different<br />
particle size are presented in <strong>the</strong> Figures. From <strong>the</strong>se
Research Journal <strong>of</strong> Chemical Sciences Vol. 1 (1) April (2011)<br />
Res.J.Chem.Sci.<br />
observations, <strong>the</strong> KHAC follows Lagergren pseudo<br />
first order kinetics. Similar patterns <strong>of</strong> results were<br />
reported earlier 48, 49 .<br />
Diffusion Studies, Pore Diffusion Coefficient (D P ):<br />
The pore diffusion coefficient values fall between<br />
10 -11 to 10 -13 and <strong>the</strong> process is said to be controlled<br />
due to intraparticle diffusion coefficient 26 . Similarly,<br />
if <strong>the</strong> external diffusion coefficient value falls<br />
between 10 -5 to 10 -8 , <strong>the</strong>n <strong>the</strong> process is said to<br />
follow external mass transfer 50,51 . The geometry <strong>of</strong><br />
<strong>the</strong> adsorbent particles is spherical in nature, based<br />
upon <strong>the</strong> Helfferich 52 assumption. The studies <strong>of</strong><br />
Webber proves that <strong>the</strong> adsorption kinetics with pore<br />
diffusion coefficient are inter related and <strong>the</strong> rate<br />
determining step is based upon pore diffusion<br />
coefficient 39,53 .<br />
Pore Diffusion Coefficient D P = 0.03 (r 0 2 ) / t ½<br />
Where, t ½ - Time for half-change (mins)<br />
r 0 - Radius <strong>of</strong> adsorbent (cm)<br />
operation. The first sharp portion may be due to<br />
external surface adsorption stage are instantaneous<br />
adsorption. The second gradual linear portion may<br />
be due to gradual intraparticle diffusion stage. The<br />
third linear may be due to final equilibrium stage 46 .<br />
The values <strong>of</strong> K p generally increased with <strong>the</strong><br />
increase in dye concentration and it can be related to<br />
concentration diffusion. Similar results were<br />
reported for metal ion adsorption onto activated<br />
carbon cloths 47, 55 .<br />
Initial adsorption coefficient (γ): The initial<br />
adsorption coefficient equation can be given as.<br />
γ = (dC / dt) t o × V / M C o<br />
Where,<br />
dC = C e at equilibrium time<br />
dt = Equilibrium time<br />
V = Volume <strong>of</strong> solution<br />
M = Mass <strong>of</strong> carbon<br />
= Initial concentration (mg/l)<br />
C o<br />
The values <strong>of</strong> pore diffusion coefficients were<br />
calculated on <strong>the</strong> particles size for <strong>the</strong> dye and <strong>the</strong>se<br />
inferences were compared with <strong>the</strong> results and it was<br />
inferred that pore diffusion was not <strong>the</strong> rate limiting<br />
step 54 . Based upon different ideas available in<br />
literature, it is possible to determine <strong>the</strong> nature <strong>of</strong><br />
adsorption process with reference to <strong>the</strong> pore<br />
diffusion coefficient. If <strong>the</strong> values fall between 10 -11<br />
to 10 -13 (cm 2 /sec) and <strong>the</strong> process is said to be<br />
controlled due to intraparticle diffusion coefficient<br />
26 , but <strong>the</strong> dye system under <strong>the</strong> study showed <strong>the</strong><br />
value within <strong>the</strong> limit (10 -11 cm 2 /sec). It confirms that<br />
<strong>the</strong> process is controlled due to intraparticle<br />
diffusion. These values were presented in <strong>the</strong> Table<br />
4.<br />
Intraparticle Diffusion (q): The intraparticle<br />
diffusion rate constant can be given as follows, q =<br />
K p T ½ ; K p values for <strong>the</strong> adsorption <strong>of</strong> <strong>the</strong> dye are<br />
presented in <strong>the</strong> Table 4. The rate constant for<br />
intraparticle diffusion K p was calculated <strong>from</strong> <strong>the</strong><br />
slope <strong>of</strong> <strong>the</strong> linear equation by q (mg/g) Vs T ½ (sec).<br />
From <strong>the</strong> plots it was found that <strong>the</strong> initial sharp<br />
portion with subsequent linearity indicated that more<br />
than one mode <strong>of</strong> sorption mechanism was in<br />
93<br />
The values for <strong>the</strong> adsorption coefficient <strong>of</strong> <strong>the</strong> dyes<br />
are presented in <strong>the</strong> Table 4. The initial adsorption<br />
coefficients increased with increase in initial dye<br />
concentration and <strong>the</strong>refore it is concentration<br />
dependent. From <strong>the</strong> results, an overall examination<br />
<strong>of</strong> effect <strong>of</strong> dye concentration on rate constant K ad<br />
describe <strong>the</strong> mechanism <strong>of</strong> adsorption takes place. In<br />
<strong>the</strong> cases <strong>of</strong> strict surface adsorption, a variation <strong>of</strong><br />
rate should be proportional to <strong>the</strong> concentration. The<br />
relationship between initial solute concentration and<br />
<strong>the</strong> rate <strong>of</strong> adsorption was not linear. This was due to<br />
<strong>the</strong> limitation caused by pore diffusion <strong>of</strong> <strong>the</strong><br />
adsorption. It is clearly indicated in <strong>the</strong> Table 4. It<br />
was concluded that pore diffusion also limited <strong>the</strong><br />
overall rate <strong>of</strong> adsorption.<br />
Effect <strong>of</strong> pH: The experiments carried out at<br />
different pH show that <strong>the</strong>re was no change in <strong>the</strong><br />
percent removal <strong>of</strong> dye over <strong>the</strong> entire pH range. The<br />
neutral dye malachite green did not have any impact<br />
to pH change. From this it is clear that due to <strong>the</strong> dye<br />
is not having any ionic character <strong>the</strong>refore <strong>the</strong><br />
adsorption is not influence by pH variation. The<br />
adsorption is only based upon activated carbon<br />
adsorbent. In o<strong>the</strong>r words, <strong>the</strong> adsorption <strong>of</strong><br />
malachite green dye on KHAC does not involve ion
Research Journal <strong>of</strong> Chemical Sciences Vol. 1 (1) April (2011)<br />
Res.J.Chem.Sci.<br />
exchange mechanism. If <strong>the</strong> adsorption would have<br />
occurred through ion exchange mechanism <strong>the</strong>re<br />
should have been an influence on <strong>the</strong> dye adsorption<br />
while varying <strong>the</strong> pH.<br />
Box-Behnken Model: Response surface<br />
methodology is an empirical modelization technique<br />
devoted to <strong>the</strong> evaluation <strong>of</strong> <strong>the</strong> relationship <strong>of</strong> a set<br />
<strong>of</strong> controlled experimental factors and observed<br />
results. In <strong>the</strong> present investigation <strong>the</strong> adsorption <strong>of</strong><br />
malachite green by KHAC <strong>from</strong> aqueous solution is<br />
optimized by Box-Behnken method. The influence<br />
<strong>of</strong> <strong>the</strong> three factors such as temperature, pH and<br />
adsorbent particle size on adsorption was<br />
investigated and <strong>the</strong> results for <strong>the</strong> linear coefficients<br />
and quadratic cross product coefficients A 0 , A 1 , A 2 ,<br />
A 3 , A 11 , A 22 , A 33 , A 12 , A 13 and A 23 were 242.83,<br />
11.833, 16.833, 35.333, 2.8333, 2.833, -14.167, -3, -<br />
8 and -6 respectively. The summary <strong>of</strong> <strong>the</strong> analysis<br />
<strong>of</strong> variance (ANOVA) is listed in table 7.<br />
From <strong>the</strong> Table 7, it was found that quadratic<br />
regression and quadratic square regression was<br />
significant at <strong>the</strong> confidence level <strong>of</strong> >98%. This<br />
indicates that <strong>the</strong> selected variance (Temperature, pH<br />
and particle size) have a combined effect on <strong>the</strong><br />
adsorption <strong>of</strong> malachite green by KHAC. The<br />
<strong>the</strong>oretical values <strong>of</strong> dye adsorption on adsorbents by<br />
<strong>the</strong> Box-Behnken model at each experimental point<br />
and experimentally observed values were compared<br />
and found that a close agreement between <strong>the</strong><br />
experimental values and <strong>the</strong> <strong>the</strong>oretical values for 15<br />
trials. The experimental values are 210.3, 239.1,<br />
248.8, 265.9, 171, 209.5, 255.1, 262.5, 168.1, 212.4,<br />
248.3, 269.3, 235.5, 235.5 and 235.5. The predicted<br />
values are 216.8, 246.5, 256.5, 274.2, 176.3, 216,<br />
263, 270.7, 173.3, 219, 256, 277.6, 242.8, 242.8 and<br />
242.8.<br />
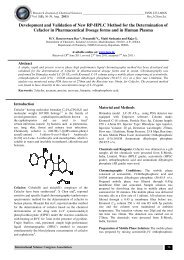
Effect <strong>of</strong> Contour Plot: The effect <strong>of</strong> variables was<br />
analyzed and plots were obtained to assess <strong>the</strong> effect<br />
<strong>of</strong> each factor graphically. The effect <strong>of</strong> certain<br />
factors is function that describes how <strong>the</strong> response<br />
moves as <strong>the</strong> level <strong>of</strong> those factor changes, when <strong>the</strong><br />
o<strong>the</strong>r factors are fixed at <strong>the</strong>ir optimum levels. From<br />
<strong>the</strong> Fig.5, it can be observed that each <strong>of</strong> <strong>the</strong> three<br />
variables used in <strong>the</strong> present study has its individual<br />
effect on adsorption. From <strong>the</strong> contour plots, it has<br />
94<br />
been found that <strong>the</strong>re is a gradual increase in<br />
adsorption <strong>of</strong> dyes with increase in temperature <strong>from</strong><br />
<strong>the</strong> lower level 300K (Coded value -1) to <strong>the</strong> middle<br />
level 318K (Coded value – 0) and <strong>the</strong>re is no fur<strong>the</strong>r<br />
increase to adsorption even if <strong>the</strong> temperature is<br />
increased to 330K (Coded value +1). Similarly, <strong>the</strong><br />
adsorption increases with respect to <strong>the</strong> particle size<br />
<strong>of</strong> KHAC <strong>from</strong> 100, 150 and 250BSS mesh numbers<br />
(Coded value -1, 0 and +1). It is also revealed that<br />
<strong>the</strong> malachite green dye would have no marked<br />
change to adsorption with respect to pH change. The<br />
pH level selected for this study was 4, 6.7 and 9<br />
(coded value -1, 0, +1).<br />
The results obtained by adapting Box-Behnken<br />
model in <strong>the</strong> study <strong>of</strong> absorption <strong>of</strong> various dyes on<br />
KHAC proves, absorption <strong>of</strong> dye depends only upon<br />
<strong>the</strong> particle size <strong>of</strong> absorbent and it was not<br />
influenced by pH or temperature. The experimental<br />
values and <strong>the</strong> predicted values <strong>of</strong> Box-Behnken<br />
design model are in close agreement with quadratic<br />
regression >98%.<br />
From <strong>the</strong> contour plots Fig.5, it is revealed that <strong>the</strong><br />
carbon particle <strong>of</strong> 250BSS mesh number highest<br />
level <strong>of</strong> absorption. Similar type <strong>of</strong> results was<br />
reported by Annadurai et al 56 .<br />
Desorption studies: Desorption studies help to<br />
elucidate <strong>the</strong> nature <strong>of</strong> adsorption and recycling <strong>of</strong><br />
<strong>the</strong> spent adsorbent and <strong>the</strong> dye. If <strong>the</strong> adsorbed dye<br />
can be desorbed using neutral pH water, <strong>the</strong>n <strong>the</strong><br />
attachment <strong>of</strong> <strong>the</strong> dye on <strong>the</strong> adsorbent is by weak<br />
bonds. If sulphuric acid or alkaline water can desorbs<br />
<strong>the</strong> dye, <strong>the</strong>n <strong>the</strong> adsorption is by ion exchange. If an<br />
organic acid, like acetic acid can desorbs <strong>the</strong> dye,<br />
<strong>the</strong>n <strong>the</strong> dye is held by <strong>the</strong> adsorbent through<br />
chemisorption. Neutral pH water, 1M sulphuric acid<br />
and 1M sodium hydroxide did not show any<br />
desorption <strong>of</strong> <strong>the</strong> dye. However, 10% acetic acid<br />
(v/v) and 50% acetic acid (v/v) solubilized 9 and<br />
37% <strong>of</strong> malachite green, respectively, <strong>from</strong> <strong>the</strong> dye<br />
adsorbed carbon. The non-reversibility <strong>of</strong> adsorbed<br />
dye in mineral acid or base is in agreement with <strong>the</strong><br />
pH independent results obtained. Desorption <strong>of</strong> dye<br />
in acetic acid (organic medium) indicates that <strong>the</strong><br />
malachite green are adsorbed onto KHAC carbon<br />
through activated adsorption mechanism.
Research Journal <strong>of</strong> Chemical Sciences Vol. 1 (1) April (2011)<br />
Res.J.Chem.Sci.<br />
Conclusion<br />
Barnes Forster, D., C.F. and Hrudey, S.E. 3,<br />
Longman, New York, (1987)<br />
Carbon prepared <strong>from</strong> waste Kapok hull was found<br />
effective in removing malachite green dye <strong>from</strong><br />
aqueous solution. The adsorption is faster and <strong>the</strong><br />
rate is mainly controlled by intraparticle diffusion<br />
based on sorption phenomenon. The structure <strong>of</strong> <strong>the</strong><br />
dye is also influenced on adsorption.<br />
The surface morphology studies using SEM proves<br />
that, it contains more pores that leads to develop<br />
more adsorption sites. The XRD pattern confirms <strong>the</strong><br />
amorphous nature <strong>of</strong> <strong>the</strong> adsorbent.<br />
The adsorption is controlled only by particle size<br />
because small particles will have more surface area<br />
for adsorption it is proved in <strong>the</strong> above studies. The<br />
adsorption is independent <strong>of</strong> pH <strong>of</strong> <strong>the</strong> medium. The<br />
adsorption increases <strong>from</strong> 300 to 318K and fur<strong>the</strong>r<br />
<strong>the</strong> increase in temperature do not have any<br />
influence upon adsorption <strong>the</strong>refore this adsorbent<br />
can be effectively utilized <strong>from</strong> 300 to 318K and<br />
even elevated temperatures. It is revealed that <strong>the</strong><br />
adsorbent is effectively utilized in all temperatures.<br />
The above said results were confirmed by <strong>the</strong> kinetic<br />
studies and supported by Box-Behnken design <strong>of</strong><br />
experiments and surface plots.<br />
It is evident <strong>from</strong> <strong>the</strong> studies that <strong>the</strong> use <strong>of</strong><br />
chemically modified Kapok hull activated carbon for<br />
<strong>the</strong> removal <strong>of</strong> malachite green dye is technically<br />
feasible, eco-friendly and economically attractive for<br />
<strong>the</strong> treatment <strong>of</strong> dye house wastewater before<br />
subjecting it to reverse osmosis by this <strong>the</strong> life <strong>of</strong><br />
costly resin could be effectively be increased..<br />
References<br />
1. McKay G., Waste colour removal <strong>from</strong> textile<br />
effluents, Amer. Dyestuff Rep., 68, 29-34 (1979)<br />
2. Jorgensen S. E., Industrial waste water<br />
management studies in Environmental Science,<br />
Elsevier Scientific Publishing Company,<br />
Amsterdam, Oxford, New York, 5, (1979).<br />
3. Kiff R.J., General inorganic effluents: In surveys<br />
in industrial waste water treatment–<br />
Manufacturing and chemical industries, Eds:<br />
95<br />
4. Judkins Jr J.F., Textile wastes, Cont J. Wat.<br />
Pollute. Fed., 57, 702-5 (1982)<br />
5. Datya Keshav, Vaidya V, Chemical processing<br />
<strong>of</strong> syn<strong>the</strong>tic fibres and blends, John wiley &<br />
sons, New York, 535–49 (1984)<br />
6. Namboodri C.G., Perkins W.S., Wlash W.K.,<br />
Decolorizing dyes with chlorine and Ozone: Part<br />
11 Amer., Dyestuff Rep, 4: 17-27 (1994).<br />
7. Liakou S., Kornaros M., Lyberatos G.,<br />
Pretreatment <strong>of</strong> azodyes using ozone, Wat. Sci.<br />
Technol., 36, 155-63 (1997)<br />
8. Uygur A, Kok E., Decolorization treatments <strong>of</strong><br />
azo dye wastewater including dischorotriazinyl<br />
reactive groups by using advanced oxidation<br />
method, JSDC., 115, 351-354 (1999)<br />
9. Ince N.H, Gonene D.T., Teat ability <strong>of</strong> a textile<br />
azo dye by UV/H 2 O 2, Environ. Technol., 28 , 179-<br />
85 (1997)<br />
10. Polard S.J.T., Fowler G.D., Sollar C. J. and<br />
Poerry R, Low cost adsorbents for water and<br />
wastewater treatment, A review Sci. Total<br />
Environ., 16, 31-52 (1992).<br />
11. Asfour H.M., Nassar M.M., Fadali O.A. and EI-<br />
Geundi M.S., Colour removal <strong>from</strong> textile<br />
effluents using hard wood dust as an adsorbent.<br />
J. Chem. Technol. Biotechnol., 35A, 28-34<br />
(1985)<br />
12. Nawar S.S. and Doma H.S., <strong>Removal</strong> <strong>of</strong> dyes<br />
<strong>from</strong> effluents using low cost agricultural by –<br />
products, The Sci. Tot. Environ., 79, 271–9<br />
(1989)<br />
13. Low K.S, and Lee C.K., The removal <strong>of</strong> cationic<br />
dyes using coconut husk as an adsorbent,<br />
Pertanica, J. Sci. Technol., 13, 221-8 (1990)
Research Journal <strong>of</strong> Chemical Sciences Vol. 1 (1) April (2011)<br />
Res.J.Chem.Sci.<br />
14. Gupta,G.S., Prasad G. and V.N.Singh, <strong>Removal</strong> 24. Morais L.C., Goncalves E.P., Vascobcelos L.T.<br />
<strong>of</strong> chrome dye <strong>from</strong> aqueous solutions by mixed and Gonzalezbeca C.G., Reactive dyes removal<br />
adsorbents: fly ash and coal, Water Research, 24, <strong>from</strong> wastewater by adsorption on Eucalyptus<br />
45-50 (1990)<br />
bark–Adsorption Equilibria, Environmental<br />
Technol., 21, 577–83 (2000)<br />
15. Namasivayam C, and Chandrasekaran K.,<br />
Studies on treatment <strong>of</strong> wastewater <strong>from</strong> dying<br />
industries using Fe(III) / Cr (III) sludge and red<br />
mud, J. Indian. Asso. Environ. Mgt., 18, 93-99<br />
(1991)<br />
16. Namasivayam C, and Kanchana N., Waste<br />
banana pith as an adsorbent for color removal<br />
<strong>from</strong> waste waters, Chemosphere, 21, 1691-1705<br />
(1992)<br />
17. Namasivayam C, and Yamuna R.T., Utilizing<br />
biogas residual slurry for dye adsorption, Amer.<br />
Dye stuff Rep., 83, 22-28 (1994)<br />
18. Deo N, and Ali M., Dye adsorption by a new low<br />
cost material; Congo Red–1, Indian J. Environ.<br />
Prot., 13, 496-508 (1993)<br />
25. Rajeswari Sivaraj, Sivakumar S., Senthilkumar<br />
P, and Subburam V., Carbon <strong>from</strong> cassava peel,<br />
an agricultural wast, as an adsorbent in <strong>the</strong><br />
removal <strong>of</strong> dyes and metal ions <strong>from</strong> aqueous<br />
solutions, Bio-resour. Technol., 80, 233–5 (2001)<br />
26. Stephan Inbaraj, B. and Sulochana N., Basic dye<br />
adsorption on a low cost carbonaceous sorbent –<br />
kinetic and equilibrium studies, Indian J. Chemi.<br />
Technol., 9, 201-8 (2002)<br />
27. Rajeswari Sivaraj and Subburam V., Activated<br />
par<strong>the</strong>nium carbon as an adsorbent for <strong>the</strong><br />
removal <strong>of</strong> dyes and heavy metal ions <strong>from</strong><br />
aqueous solutions, Bio-resour. Technol., 85,<br />
205–206 (2002)<br />
19. Namasivayam C, and Kadirvelu K., Coirpith as<br />
agricultural waste by product for <strong>the</strong> treatment <strong>of</strong><br />
Dyeing wastewater, Bioresource Technology, 48,<br />
79-81 (1994)<br />
20. Juang Rvey–Shin, Ru–Ling Tseng, Feng – Chin<br />
Wa and Shwu–Hwa lww, Adsorption Behaviour<br />
<strong>of</strong> reactive dyes <strong>from</strong> aqueous solutions as<br />
chitosam, J. Chem. Technol. Biotechnol., 70,<br />
391–99 (1997)<br />
21. Malik U. and Taneja, Utilizing fly ash for color<br />
removal <strong>of</strong> dye effluents, America dye stuff<br />
reporter, 1994; 20–27<br />
22. Namasivayam C, D.J.S.E.Arasi, <strong>Removal</strong> <strong>of</strong><br />
Congo Red <strong>from</strong> wastewater by adsorption onto<br />
waster red mud, Chemosphere, 34, 410–17<br />
(1997)<br />
23. Venkatamohan S., Mamatha V.V.S. and<br />
Karthikeyan J., <strong>Removal</strong> <strong>of</strong> colour <strong>from</strong> acid and<br />
direct dyes by adsorption onto silica fumes,<br />
Fresenius Envion Bull., 7, 51–58 (1998)<br />
96<br />
28. Rajavel G., Ananthanarayan C., Prabhakar L.D.<br />
and Palanivel, <strong>Removal</strong> <strong>of</strong> dark green PLS dye<br />
<strong>from</strong> textile industrial waste through low cost<br />
carbons, Indian J. Environ. Health, 45, 195-202<br />
(2003)<br />
29. Janos P., Buchtova H. and Ryznarova M.,<br />
Sorption <strong>of</strong> dyes <strong>from</strong> <strong>the</strong> aqueous solutions on<br />
to fly ash, Water Res., 37, 4938-44 (2003)<br />
30. Malik P.K., Dye removal <strong>from</strong> waste water using<br />
activated carbon developed <strong>from</strong> saw dust:<br />
adsorption equilibrium and kinetics, J. Hazard<br />
Matter, 113, 81-88 (2004)<br />
31. Namane A., Mekarzia A., Benrachedi K.,<br />
Belhaneche Bensemra N. and Hellal A.,<br />
Determination <strong>of</strong> <strong>the</strong> adsorption capacity <strong>of</strong><br />
activated carbon made <strong>from</strong> c<strong>of</strong>fee grounds by<br />
chemical activation with ZnCl 2 and H 3 PO 4 ., J.<br />
Hazard Matter, 119, 189-94 (2005)<br />
32. Ozacar M, Sengil,I.A., Adsorption <strong>of</strong> metal<br />
complex dyes <strong>from</strong> aqueous solutions by pine<br />
saw dust., Bioresour. Technol., 96, 791-5 (2005)
Research Journal <strong>of</strong> Chemical Sciences Vol. 1 (1) April (2011)<br />
Res.J.Chem.Sci.<br />
sorbent materials, Global Nest, The Int.J. 4(1),<br />
75-83, (2002)<br />
33. Khattri S.D. and Singh M.K., Adsorption <strong>of</strong><br />
basic dyes <strong>from</strong> aqueous solutions by natural<br />
adsorbent, Ind.Chem.Technol., 6, 112-6 (1999)<br />
34. Box G.E.P. and Behnken D.W., Three level<br />
design for <strong>the</strong> study <strong>of</strong> quantitative variables,<br />
Technometrics., 2, 445-475 (1960)<br />
43. Mohan S., Karthikeyan J., <strong>Removal</strong> <strong>of</strong> lignin and<br />
tannin color <strong>from</strong> aqueous solution by adsorption<br />
on to activated carbon solution by adsorption on<br />
to activated charcoal, Environ.Pollut., 97, 183-7<br />
(1997)<br />
35. Box G.E.P. and J.S. Hunter, Multifactor<br />
experimental design for exploring response<br />
surfaces. Ann.Math.Statist., 28, 195-241 (1957)<br />
36. Kapat A., Rakshit, S.K. and T. P anda,<br />
Optimization <strong>of</strong> carbon and nitrogen sources in<br />
<strong>the</strong> medium and environmental factors for<br />
enhanced production <strong>of</strong> chitinase by trichoderma<br />
hazarianum, Bioprocess Engg., 15, 13-20 (1996)<br />
37. Myers R.H, Response Surface Methodology,<br />
Boston: Allvn and Brcon, Inc. (1971)<br />
38. Weber T.N., Chakravarti R.K., Pora and Solid<br />
Diffusion Models for fixed bed adsorbers,<br />
J.Am.Inst.Chem.Engg., 20, 228-38 (1974)<br />
39. Gupta V.K., I.Ali Suhas, Mohan D., Equilibrium<br />
up take and sorption dynamics for <strong>the</strong> removal if<br />
a basic dye (basic red) using low cost<br />
adsorbents., J Colloid Interface Sci., 265, 257-<br />
64 (2003)<br />
40. Ho Y.S., Porter J.F., McKay G., Equilibrium<br />
iso<strong>the</strong>rm studies for <strong>the</strong> absorption <strong>of</strong> divalent<br />
metal ions on to peat: Copper, Nickel and Lead<br />
single component systems, Water Air and Soil<br />
Pollution., 141, 1, (2002)<br />
41. Albanis T.A., Hela D.G., Sakell Arides. J.M., T.<br />
G. Danis, <strong>Removal</strong> <strong>of</strong> dyes <strong>from</strong> aqueous<br />
solutions by adsorptions on mixtures <strong>of</strong> fly ash<br />
and soil in batch and column techniques. Global<br />
Nest: <strong>the</strong> Int. J., 2(3), 237 – 244 (2000)<br />
42. Voudrias E., Fytianosand F., Bozani E., Sorption<br />
Description iso<strong>the</strong>rms <strong>of</strong> Dyes <strong>from</strong> aqueous<br />
solutions and Waste Waters with different<br />
44. Atkins P., Physical chemistry, Oxford University<br />
press, Oxford, U.K., (1970)<br />
45. Rao Lakshminarayanan, Krishniah K.C.,<br />
Ashatosh K., Colour removal <strong>from</strong> dye stuff<br />
industry effluent using activated carbon, Indian<br />
J. Chem. Technol., 1, 13-9 (1994)<br />
46. McKay G, Otterburn, M.S., Sweeny A.G., The<br />
removal <strong>of</strong> colour <strong>from</strong> effluent using various<br />
adsorbents 11-silica, Rate Process, Water Res.,<br />
14: 15-20 (1980)<br />
47. Namita Deo, Manzoor Ali., Dye adsorption by<br />
New low cost materials. Congo red.<br />
Ind.J.Env.Prot., 13, 570-6 (1993)<br />
48. Webber W.J, In principal and application <strong>of</strong><br />
water chemistry, edited by Faust S.D & Hunter,<br />
J.V, Wiley, New York, (1967)<br />
49. Bhatnagar A., Jain A.K., A comparative<br />
absorption study with different industrial wastes<br />
as adsorbents for removal <strong>of</strong> cationic dyes <strong>from</strong><br />
water. J.Colloid Interface Sci., 281(1), 49-55<br />
(2005)<br />
50. Furusuwa T., Smith J.M., Intraparticle mass<br />
transport in slurries by dynamic adsorption<br />
studies. AIChE, 20, 88 (1974)<br />
51. Khare,S.K, Pandey,K.K, Srivastava,R.M,<br />
V.N.Singh, <strong>Removal</strong> <strong>of</strong> Victoria blue <strong>from</strong><br />
aqueous solution by fly ash, J, Chem. Techcol.<br />
Biotechnol., 1987; 35: 99<br />
52. Helfferich F., Ion Exchange, New York:<br />
McGraw-Hill, (1962)<br />
97
Research Journal <strong>of</strong> Chemical Sciences Vol. 1 (1) April (2011)<br />
Res.J.Chem.Sci.<br />
53. Lee V.K., Porter J.F., McKay G., Fixed led industrial solid waste as an adsorbent for <strong>the</strong><br />
modeling for acid dye adsorption on to activated removal <strong>of</strong> Rhodomine–B <strong>from</strong> aqueous<br />
carbon. J.Cem Technology Bio Technol., 78(12), solution: Kinetic and equilibrium studies,<br />
1281-89 (2003)<br />
Chemosphere 60, 1009–17 (2005)<br />
54. Wu F., Tseng R., Juang R., Pore structure and<br />
adsorption performance <strong>of</strong> <strong>the</strong> activated carbons<br />
prepared <strong>from</strong> Plum Kernels, J.Hazard Mater.,<br />
69, 287-302 (1999)<br />
55. Kadirvelu K., Karthika C., enilamani N.V,<br />
Pattabhi S., Activated carbon prepaid <strong>from</strong><br />
56. Durai Anna G., Mathalai Balan S., and<br />
Murugesan T., Box-Behnken design in <strong>the</strong><br />
development <strong>of</strong> optimized complex medium for<br />
phenol degradation using Pseudomonas Putida<br />
(NICM2174). Bioprocess Engg., 21, 415-421<br />
(1999)<br />
Table-1: Characteristic <strong>of</strong> KHAC<br />
S.No Parameters Obtained Result<br />
1. pH solution 6.7<br />
2. Moisture content (%) 2.4<br />
3. Ash content (%) 1.856<br />
4. Decolorizing power (mg/g) 22.5<br />
5. Ion-exchange capacity(milliequi/g) 0.0415<br />
6. Surface area (m 2 /g) 158-228<br />
7. Apparent Density (g/l) 0.42<br />
8. Particle size (µm) 125<br />
9. Volatile matter (%) 12.0<br />
10. Fixed carbon (%) 86.0<br />
11. Calcium (%) 16.0<br />
12. Sodium (mg/g) 7.0<br />
13. Potassium (mg/g) 13.0<br />
14. Water soluble matter (%) 2.0<br />
15 HCl soluble matter (0.25N) (%) 7.0<br />
16. Phenol number, mg 11.2<br />
98
Research Journal <strong>of</strong> Chemical Sciences Vol. 1 (1) April (2011)<br />
Res.J.Chem.Sci<br />
Table-2: Effect <strong>of</strong> adsorbent dosage and particle size on <strong>the</strong> removal <strong>of</strong> malachite green (100mg/l) at 300K<br />
Carbon % <strong>Removal</strong> Log X/M Log Ce<br />
Dose 250 150 100 250 150 100 250 150 100<br />
100 18 18 16 -2.745 -2.745 -2.796 -0.086 -0.086 -0.076<br />
200 20 20 20 -3.000 -3 -3 -0.097 -0.097 -0.097<br />
300 22 25 25 -3.135 -3.079 -3.079 -0.108 -0.125 -0.125<br />
400 30 30 28 -3.125 -3.125 -3.155 -0.155 -0.155 -0.143<br />
500 35 34 32 -3.155 -3.167 -3.194 -0.187 -0.18 -0.167<br />
600 38 37 36 -3.198 -3.21 -3.222 -0.208 -0.201 -0.194<br />
700 43 42 40 -3.212 -3.222 -3.243 -0.244 -0.237 -0.222<br />
800 50 49 48 -3.204 -3.213 -3.222 -0.301 -0.292 -0.284<br />
900 55 53 50 -3.214 -3.23 -3.255 -0.347 -0.328 -0.301<br />
1000 61 56 52 -3.215 -3.252 -3.284 -0.409 -0.357 -0.319<br />
1100 74 66 64 -3.172 -3.222 -3.235 -0.585 -0.469 -0.444<br />
1200 83 82 76 -3.16 -3.165 -3.198 -0.769 -0.745 -0.62<br />
1300 94 92 86 -3.141 -3.15 -3.179 -1.222 -1.097 -0.854<br />
1400 100 100 100 -3.146 -3.146 -3.146 - - -<br />
Table-3: Freundlich constants for <strong>the</strong> adsorption <strong>of</strong> malachite green at various article sizes at various<br />
temperatures<br />
Temp<br />
erature<br />
(K)<br />
300<br />
Particle Size (BSS Mesh) n x 10 K F x 10 2 R 2<br />
250 0.8647 2.8727 0.5280<br />
150 1.1105 2.8464 0.6646<br />
100 1.3737 2.8325 0.7146<br />
250 0.9093 2.9255 0.4625<br />
318<br />
150 1.2653 2.8639 0.6094<br />
100 1.4375 2.8679 0.6874<br />
250 0.9093 2.9255 0.4625<br />
330<br />
150 1.2653 2.8639 0.6094<br />
100 1.4375 2.8679 0.6874<br />
99
Research Journal <strong>of</strong> Chemical Sciences Vol. 1 (1) April (2011)<br />
Res.J.Chem.Sci<br />
Table-4: Adsorption kinetic data for dye removal with various particle sizes, equilibrium time for 150mins<br />
Particle Size (BSS<br />
mesh No.)<br />
Temp<br />
(K)<br />
Dye conc.<br />
(mg/100ml)<br />
q e<br />
γ<br />
x 10 -5 K ad K P<br />
D P<br />
x10 -10<br />
5<br />
0.42<br />
5.53<br />
0.0067<br />
0.022<br />
300<br />
10<br />
15<br />
0.77<br />
1.20<br />
5.13<br />
5.33<br />
0.0062<br />
0.0080<br />
0.040<br />
0.062<br />
0.1075<br />
20<br />
1.52<br />
5.07<br />
0.0089<br />
0.080<br />
100<br />
150<br />
318<br />
330<br />
300<br />
318<br />
330<br />
5<br />
10<br />
15<br />
20<br />
5<br />
10<br />
15<br />
20<br />
5<br />
10<br />
15<br />
20<br />
5<br />
10<br />
15<br />
20<br />
5<br />
10<br />
15<br />
20<br />
5<br />
0.43<br />
0.79<br />
1.24<br />
1.54<br />
0.43<br />
0.79<br />
1.24<br />
1.54<br />
0.43<br />
0.79<br />
1.24<br />
1.54<br />
0.44<br />
0.81<br />
1.25<br />
1.56<br />
0.44<br />
0.81<br />
1.25<br />
1.56<br />
0.44<br />
5.73<br />
5.27<br />
5.51<br />
5.13<br />
5.73<br />
5.27<br />
5.51<br />
5.13<br />
5.73<br />
5.27<br />
5.50<br />
5.13<br />
5.87<br />
5.40<br />
5.53<br />
5.20<br />
5.87<br />
5.40<br />
5.53<br />
5.20<br />
5.87<br />
0.0058<br />
0.0062<br />
0.0068<br />
0.0074<br />
0.0058<br />
0.0062<br />
0.0068<br />
0.0074<br />
0.006<br />
0.006<br />
0.007<br />
0.008<br />
0.006<br />
0.006<br />
0.007<br />
0.008<br />
0.006<br />
0.006<br />
0.007<br />
0.008<br />
0.006<br />
0.022<br />
0.041<br />
0.062<br />
0.077<br />
0.022<br />
0.041<br />
0.062<br />
0.077<br />
0.022<br />
0.041<br />
0.062<br />
0.077<br />
0.022<br />
0.042<br />
0.062<br />
0.077<br />
0.022<br />
0.042<br />
0.062<br />
0.077<br />
0.023<br />
0.1075<br />
0.1075<br />
4.7789<br />
4.7789<br />
4.7789<br />
300<br />
10<br />
15<br />
0.81<br />
1.25<br />
5.40<br />
5.53<br />
0.006<br />
0.007<br />
0.042<br />
0.062<br />
1.72<br />
20<br />
1.56<br />
5.20<br />
0.005<br />
0.077<br />
250<br />
318<br />
330<br />
5<br />
10<br />
15<br />
20<br />
5<br />
10<br />
15<br />
20<br />
0.45<br />
0.84<br />
1.26<br />
1.61<br />
0.45<br />
0.84<br />
1.26<br />
1.61<br />
6.0<br />
5.6<br />
5.6<br />
5.37<br />
6.0<br />
5.6<br />
5.6<br />
5.37<br />
0.007<br />
0.005<br />
0.006<br />
0.009<br />
0.007<br />
0.005<br />
0.006<br />
0.009<br />
0.023<br />
0.043<br />
0.061<br />
0.082<br />
0.023<br />
0.043<br />
0.061<br />
0.082<br />
1.72<br />
1.72<br />
100
Research Journal <strong>of</strong> Chemical Sciences Vol. 1 (1) April (2011)<br />
Res.J.Chem.Sci<br />
Table-5: Langmuir constants and <strong>the</strong>rmodynamic parameters for malachite green adsorption with<br />
different temperatures and particle size<br />
Particle Size<br />
100<br />
150<br />
250<br />
Temp<br />
K<br />
300<br />
318<br />
330<br />
300<br />
318<br />
330<br />
300<br />
318<br />
330<br />
Slope<br />
2.2931<br />
2.3292<br />
2.3292<br />
1.4458<br />
2.3878<br />
2.3878<br />
3.3153<br />
2.5100<br />
2.5100<br />
Intercept<br />
0.3233<br />
0.2867<br />
0.2867<br />
0.0449<br />
0.3505<br />
0.3505<br />
0.4934<br />
0.2506<br />
0.2506<br />
b<br />
(l/mg)<br />
7.0920<br />
8.1240<br />
8.124<br />
32.200<br />
6.8125<br />
6.8125<br />
6.7124<br />
10.010<br />
10.010<br />
Q o x10 2<br />
(mg/g)<br />
0.4360<br />
0.4290<br />
0.4290<br />
0.6916<br />
0.4187<br />
0.4187<br />
0.3016<br />
0.3984<br />
0.3984<br />
R L ∆H° ∆G° ∆S°<br />
0.0802<br />
0.0790<br />
0.0790<br />
0.1215<br />
0.0772<br />
0.0772<br />
0.0569<br />
0.0738<br />
0.0738<br />
1439 -156.9 88.66<br />
1640 -863.2 139.07<br />
4242 -323 253.61<br />
Table 6 Box-Behnken design for three independent variables<br />
Trial No. pH Particle Size (BSS Mesh No.) Temperature (K)<br />
1. -1 -1 0<br />
2. +1 -1 0<br />
3. -1 +1 0<br />
4. +1 +1 0<br />
5. -1 0 -1<br />
6. +1 0 -1<br />
7. -1 0 +1<br />
8. +1 0 +1<br />
9. 0 -1 -1<br />
10. 0 +1 -1<br />
11. 0 -1 +1<br />
12. 0 +1 +1<br />
13. 0 0 0<br />
14. 0 0 0<br />
15. 0 0 0<br />
Table 7 ANOVA for Box-Behnken Model for <strong>the</strong> adsorption <strong>of</strong> malachite green<br />
Source Sum <strong>of</strong> Squares Degrees <strong>of</strong> Freedom Mean Square F value<br />
Model<br />
Error<br />
Cor. Total<br />
Root MSE<br />
C.V<br />
5914<br />
2188<br />
8102<br />
19.07<br />
0.110<br />
6<br />
8<br />
14<br />
739.3<br />
364.66<br />
R- Squared<br />
Adj R-Squared<br />
2.024<br />
0.928<br />
0.909<br />
101
Research Journal <strong>of</strong> Chemical Sciences Vol. 1 (1) April (2011)<br />
Res.J.Chem.Sci<br />
Figure-1: SEM photograph <strong>of</strong> Kapok Hull Activated Carbon (KHAC) at various magnifications (x200,<br />
x500 and x2000)<br />
2500<br />
2000<br />
Intensity<br />
1500<br />
1000<br />
500<br />
0 20 40 60 80<br />
2 Theta<br />
Figure-2: X-ray Diffraction pattern for KHAC<br />
102
Research Journal <strong>of</strong> Chemical Sciences Vol. 1 (1) April (2011)<br />
Res.J.Chem.Sci<br />
Log (qe -q)<br />
0<br />
0 20 40 60 80 100 120 140<br />
-0.5<br />
-1<br />
-1.5<br />
-2<br />
-2.5<br />
Time (mins)<br />
a<br />
5<br />
10<br />
15<br />
20<br />
Log (qe -q)<br />
0<br />
0 20 40 60 80 100 120 140<br />
-1<br />
b<br />
-2<br />
5<br />
10<br />
-3<br />
15<br />
Time (mins)<br />
20<br />
0<br />
0 20 40 60 80 100 120 140<br />
Log (qe-q)<br />
-1<br />
-2<br />
c<br />
5<br />
10<br />
-3<br />
Time (mins)<br />
15<br />
20<br />
Figure-3: Lagergren plot for malachite green removal <strong>of</strong> (a) 100 (b) 150 (c) 250BSS<br />
particle size at 300K<br />
-0.5<br />
0<br />
0 20 40 60 80 100 120 140<br />
0<br />
-0.5<br />
0 20 40 60 80 100 120 140<br />
L o g ( q e - q )<br />
-1<br />
-1.5<br />
-2<br />
-2.5<br />
b<br />
Time (mins)<br />
5<br />
10<br />
15<br />
20<br />
L o g ( q e - q )<br />
-1<br />
-1.5<br />
-2<br />
-2.5<br />
c<br />
Time (mins)<br />
5<br />
10<br />
15<br />
20<br />
Fig. 4 Lagergren plot for malachite green removal <strong>of</strong> (a) 100 (b) 150 (c) 250BSS<br />
particle size at 318K<br />
103
Research Journal <strong>of</strong> Chemical Sciences Vol. 1 (1) April (2011)<br />
Res.J.Chem.Sci<br />
Model<br />
: Quadratic<br />
Response : R1<br />
Variables<br />
X – pH<br />
Y – Temperature<br />
Constants : P. Size<br />
Model<br />
: Quadratic<br />
Response : R1<br />
Variables<br />
X – pH<br />
Y – P. Size<br />
Constants : Temp.<br />
Model<br />
: Quadratic<br />
Response : R1<br />
Variables<br />
X – Temperature<br />
Y – P. Size<br />
Constants : pH<br />
Fig. 5 Response surface plot for <strong>the</strong> adsorption <strong>of</strong> malachite green<br />
104