- Page 1 and 2: OFFERING MEMORANDUM £300,000,000 Q
- Page 3 and 4: SPECIAL NOTE REGARDING FORWARD-LOOK
- Page 5 and 6: Interest Payment Date and no QBE Au
- Page 7 and 8: • “Issuer” means QBE Capital
- Page 9 and 10: elevant payment by QBE UK (or at th
- Page 11 and 12: FINANCIAL INFORMATION PRESENTATION
- Page 13 and 14: EXCHANGE RATES AND CONTROLS For you
- Page 15 and 16: Jersey United Kingdom There are no
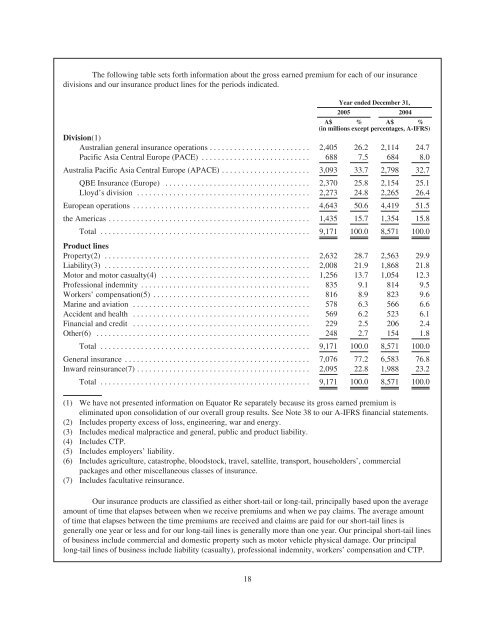
- Page 17 and 18: Operations Performance Our operatio
- Page 19: The investment committee of our boa
- Page 23 and 24: Years ended December 31, 2005 and 2
- Page 25 and 26: Years ended December 31, 2004, 2003
- Page 27 and 28: THE OFFERING Capital Securities ...
- Page 29 and 30: those distributions (including any
- Page 31 and 32: for such failure is the failure of
- Page 33 and 34: Securities will be exchanged for QB
- Page 35 and 36: anks senior or equal to the QBE Pre
- Page 37 and 38: unless and until, • in the case o
- Page 39 and 40: excluding the date of liquidation,
- Page 41 and 42: Definitive certificates will not be
- Page 43 and 44: TRANSACTION DIAGRAM 41
- Page 45 and 46: substantial fall in the equity mark
- Page 47 and 48: Changes in government policy, regul
- Page 49 and 50: There can be no assurance that we w
- Page 51 and 52: Furthermore, our right to participa
- Page 53 and 54: Our obligations will be deeply subo
- Page 55 and 56: that, if the Exchange Event is the
- Page 57 and 58: You will not be able to participate
- Page 59 and 60: QBE CAPITAL FUNDING LP The Issuer i
- Page 61 and 62: USE OF PROCEEDS On the Closing Date
- Page 63 and 64: RATIOS OF EARNINGS TO FIXED CHARGES
- Page 65 and 66: Year ended December 31, 2005 2005 2
- Page 67 and 68: Year ended December 31, 2005 2005 2
- Page 69 and 70: Year ended December 31, 2004 2003 2
- Page 71 and 72:
(5) Combined operating ratio is cal
- Page 73 and 74:
• the Americas; and • Investmen
- Page 75 and 76:
similar to cash flow hedges. The ga
- Page 77 and 78:
driven by seeking value for our sha
- Page 79 and 80:
Year ended December 31, 2005 2004 (
- Page 81 and 82:
We translate income and expense ite
- Page 83 and 84:
PACE. A$536 million compared to A$5
- Page 85 and 86:
atio decreased to 10.6% for 2005 fr
- Page 87 and 88:
• the Americas division had a net
- Page 89 and 90:
strong premium rate increases and i
- Page 91 and 92:
Profit Before Income Tax As a resul
- Page 93 and 94:
incentives not to convert their LYO
- Page 95 and 96:
and at the balance date. The fair v
- Page 97 and 98:
Credit risk The credit risk on our
- Page 99 and 100:
BUSINESS Overview We are Australia
- Page 101 and 102:
Recent Acquisitions During 2006 to
- Page 103 and 104:
(1) Includes property excess of los
- Page 105 and 106:
exposure to terrorism risks. Many g
- Page 107 and 108:
any particular agent. Certain broke
- Page 109 and 110:
As part of our strategy to rational
- Page 111 and 112:
General Insurance From the late 199
- Page 113 and 114:
In November 2003 and 2004, we restr
- Page 115 and 116:
Investments We manage our worldwide
- Page 117 and 118:
among operating regions and delegat
- Page 119 and 120:
information to estimate the IBNR li
- Page 121 and 122:
Year ended December 31, 2005 Curren
- Page 123 and 124:
growth opportunities; marketing and
- Page 125 and 126:
Employees As of December 31, 2005 w
- Page 127 and 128:
• regardless of the method used t
- Page 129 and 130:
understand APRA presently intends f
- Page 131 and 132:
• insurance agents who provide in
- Page 133 and 134:
foreign insurers and their operatio
- Page 135 and 136:
Regulatory Reporting. Our London Ma
- Page 137 and 138:
Investigation and Intervention. The
- Page 139 and 140:
usiness, rates for insurance busine
- Page 141 and 142:
Until the full extent of the integr
- Page 143 and 144:
OUR BOARD AND MANAGEMENT Overview O
- Page 145 and 146:
May 1990 until March 2001. Mr. Blea
- Page 147 and 148:
Investment Committee The membership
- Page 149 and 150:
A$1.5 million. Such fees are apport
- Page 151 and 152:
Executive Officers The following ta
- Page 153 and 154:
(3) “Other” includes the deemed
- Page 155 and 156:
DESCRIPTION OF THE CAPITAL SECURITI
- Page 157 and 158:
Business Day, the distribution othe
- Page 159 and 160:
set at the absolute discretion of A
- Page 161 and 162:
Management Office in the paper “F
- Page 163 and 164:
See “Description of the Capital S
- Page 165 and 166:
stamp duty payable to the Australia
- Page 167 and 168:
and privileges of the Capital Secur
- Page 169 and 170:
edemption or liquidation payment un
- Page 171 and 172:
Prior to the expiration of the 40th
- Page 173 and 174:
Redemption and exchange notices wil
- Page 175 and 176:
Under the Capital Securities Guaran
- Page 177 and 178:
the Capital Securities—Limitation
- Page 179 and 180:
The holders of a majority of the ag
- Page 181 and 182:
• any payment or declaration of a
- Page 183 and 184:
with, or will be exempt from, any s
- Page 185 and 186:
Notwithstanding whether or not QBE
- Page 187 and 188:
The “UK Capital Securities Make W
- Page 189 and 190:
exceptions as would apply with resp
- Page 191 and 192:
Limitations on Issuance If the Exch
- Page 193 and 194:
Payment Date during a 12 consecutiv
- Page 195 and 196:
Securities Make Whole Redemption Pr
- Page 197 and 198:
edemption, buy-back or cancellation
- Page 199 and 200:
or junior to the QBE Preferred Secu
- Page 201 and 202:
TAXATION Certain United States Fede
- Page 203 and 204:
Redemption of the UK Capital Securi
- Page 205 and 206:
Foreign Currency Rules The US tax r
- Page 207 and 208:
eportable event, (ii) the US holder
- Page 209 and 210:
them by the Issuer. Australian inco
- Page 211 and 212:
Certain United Kingdom Tax Conseque
- Page 213 and 214:
No UK SDRT will be payable on an ag
- Page 215 and 216:
ERISA CONSIDERATIONS To ensure comp
- Page 217 and 218:
If the Initial Purchasers create a
- Page 219 and 220:
(iv) no prospectus or product discl
- Page 221 and 222:
any transfer of interests in the Re
- Page 223 and 224:
INVESTED (COLLECTIVELY, A “PLAN
- Page 225 and 226:
LEGAL MATTERS The validity of the C
- Page 227 and 228:
INDEX TO FINANCIAL STATEMENTS QBE I
- Page 229 and 230:
Directors’ report continued FOR T
- Page 231 and 232:
Directors’ report continued FOR T
- Page 233 and 234:
Directors’ report continued FOR T
- Page 235 and 236:
Directors’ report continued FOR T
- Page 237 and 238:
Directors’ report continued FOR T
- Page 239 and 240:
Directors’ report continued FOR T
- Page 241 and 242:
Directors’ report continued FOR T
- Page 243 and 244:
Balance sheets AS AT 31 DECEMBER 20
- Page 245 and 246:
Statements of cash flows FOR THE YE
- Page 247 and 248:
Notes to the financial statements c
- Page 249 and 250:
Notes to the financial statements c
- Page 251 and 252:
Notes to the financial statements c
- Page 253 and 254:
Notes to the financial statements c
- Page 255 and 256:
Notes to the financial statements c
- Page 257 and 258:
Notes to the financial statements c
- Page 259 and 260:
Notes to the financial statements c
- Page 261 and 262:
Notes to the financial statements c
- Page 263 and 264:
Notes to the financial statements c
- Page 265 and 266:
Notes to the financial statements c
- Page 267 and 268:
Notes to the financial statements c
- Page 269 and 270:
Notes to the financial statements c
- Page 271 and 272:
Notes to the financial statements c
- Page 273 and 274:
Notes to the financial statements c
- Page 275 and 276:
Notes to the financial statements c
- Page 277 and 278:
Notes to the financial statements c
- Page 279 and 280:
Notes to the financial statements c
- Page 281 and 282:
Notes to the financial statements c
- Page 283 and 284:
Notes to the financial statements c
- Page 285 and 286:
Notes to the financial statements c
- Page 287 and 288:
Notes to the financial statements c
- Page 289 and 290:
Notes to the financial statements c
- Page 291 and 292:
Notes to the financial statements c
- Page 293 and 294:
Notes to the financial statements c
- Page 295 and 296:
Notes to the financial statements c
- Page 297 and 298:
Notes to the financial statements c
- Page 299 and 300:
Notes to the financial statements c
- Page 301 and 302:
Notes to the financial statements c
- Page 303 and 304:
Notes to the financial statements c
- Page 305 and 306:
Notes to the financial statements c
- Page 307 and 308:
Notes to the financial statements c
- Page 309 and 310:
Independent audit report TO THE MEM
- Page 311 and 312:
DIRECTORS’ REPORT FOR THE YEAR EN
- Page 313 and 314:
DIRECTORS’ REPORT FOR THE YEAR EN
- Page 315 and 316:
Statements of financial position AS
- Page 317 and 318:
Notes to the financial statements F
- Page 319 and 320:
NOTES TO THE FINANCIAL STATEMENTS F
- Page 321 and 322:
NOTES TO THE FINANCIAL STATEMENTS F
- Page 323 and 324:
NOTES TO THE FINANCIAL STATEMENTS F
- Page 325 and 326:
NOTES TO THE FINANCIAL STATEMENTS F
- Page 327 and 328:
NOTES TO THE FINANCIAL STATEMENTS F
- Page 329 and 330:
NOTES TO THE FINANCIAL STATEMENTS F
- Page 331 and 332:
NOTES TO THE FINANCIAL STATEMENTS F
- Page 333 and 334:
NOTES TO THE FINANCIAL STATEMENTS F
- Page 335 and 336:
NOTES TO THE FINANCIAL STATEMENTS F
- Page 337 and 338:
NOTES TO THE FINANCIAL STATEMENTS F
- Page 339 and 340:
NOTES TO THE FINANCIAL STATEMENTS F
- Page 341 and 342:
NOTES TO THE FINANCIAL STATEMENTS F
- Page 343 and 344:
NOTES TO THE FINANCIAL STATEMENTS F
- Page 345 and 346:
NOTES TO THE FINANCIAL STATEMENTS F
- Page 347 and 348:
NOTES TO THE FINANCIAL STATEMENTS F
- Page 349 and 350:
NOTES TO THE FINANCIAL STATEMENTS F
- Page 351 and 352:
NOTES TO THE FINANCIAL STATEMENTS F
- Page 353 and 354:
NOTES TO THE FINANCIAL STATEMENTS F
- Page 355 and 356:
NOTES TO THE FINANCIAL STATEMENTS F
- Page 357 and 358:
NOTES TO THE FINANCIAL STATEMENTS F
- Page 359 and 360:
NOTES TO THE FINANCIAL STATEMENTS F
- Page 361 and 362:
NOTES TO THE FINANCIAL STATEMENTS F
- Page 363 and 364:
Directors’ declaration The direct
- Page 365 and 366:
APPENDIX A: GLOSSARY TO CERTAIN INS
- Page 367 and 368:
Incurred but not reported (IBNR) ..
- Page 369:
£300,000,000 QBE Capital Funding L