(SOPs): GC/MS ANALYSES AND DATA PROCESSING METHODS
(SOPs): GC/MS ANALYSES AND DATA PROCESSING METHODS
(SOPs): GC/MS ANALYSES AND DATA PROCESSING METHODS

You also want an ePaper? Increase the reach of your titles
YUMPU automatically turns print PDFs into web optimized ePapers that Google loves.
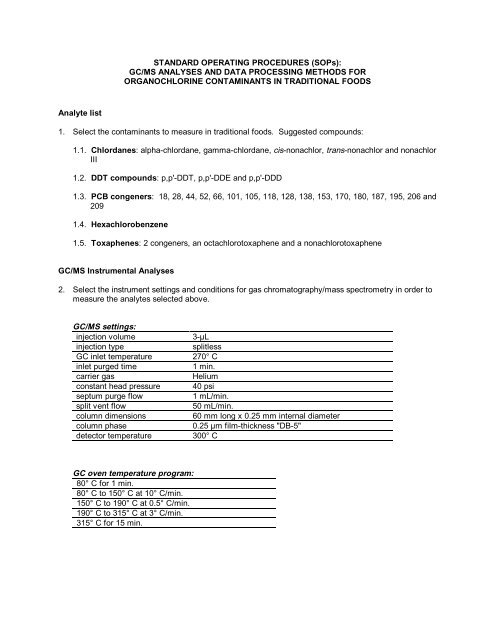
ST<strong>AND</strong>ARD OPERATING PROCEDURES (<strong>SOPs</strong>):<br />
<strong>GC</strong>/<strong>MS</strong> <strong>ANALYSES</strong> <strong>AND</strong> <strong>DATA</strong> <strong>PROCESSING</strong> <strong>METHODS</strong> FOR<br />
ORGANOCHLORINE CONTAMINANTS IN TRADITIONAL FOODS<br />
Analyte list<br />
1. Select the contaminants to measure in traditional foods. Suggested compounds:<br />
1.1. Chlordanes: alpha-chlordane, gamma-chlordane, cis-nonachlor, trans-nonachlor and nonachlor<br />
III<br />
1.2. DDT compounds: p,p'-DDT, p,p'-DDE and p,p'-DDD<br />
1.3. PCB congeners: 18, 28, 44, 52, 66, 101, 105, 118, 128, 138, 153, 170, 180, 187, 195, 206 and<br />
209<br />
1.4. Hexachlorobenzene<br />
1.5. Toxaphenes: 2 congeners, an octachlorotoxaphene and a nonachlorotoxaphene<br />
<strong>GC</strong>/<strong>MS</strong> Instrumental Analyses<br />
2. Select the instrument settings and conditions for gas chromatography/mass spectrometry in order to<br />
measure the analytes selected above.<br />
<strong>GC</strong>/<strong>MS</strong> settings:<br />
injection volume<br />
injection type<br />
<strong>GC</strong> inlet temperature<br />
inlet purged time<br />
carrier gas<br />
constant head pressure<br />
septum purge flow<br />
split vent flow<br />
column dimensions<br />
column phase<br />
detector temperature<br />
3-µL<br />
splitless<br />
270° C<br />
1 min.<br />
Helium<br />
40 psi<br />
1 mL/min.<br />
50 mL/min.<br />
60 mm long x 0.25 mm internal diameter<br />
0.25 µm film-thickness "DB-5"<br />
300° C<br />
<strong>GC</strong> oven temperature program:<br />
80° C for 1 min.<br />
80° C to 150° C at 10° C/min.<br />
150° C to 190° C at 0.5° C/min.<br />
190° C to 315° C at 3° C/min.<br />
315° C for 15 min.
<strong>MS</strong> selected-ion monitoring:<br />
Approximate<br />
Time range (min.)<br />
Dwell<br />
Window<br />
Mass Time Analyte or Internal Standard<br />
1 24-31 207 1000 Tetrachloro-meta-xylene (<strong>GC</strong> Internal<br />
Standard<br />
2 31-37 284 1000 Hexachlorobenzene<br />
3 37-55 256 1000 PCB 18 and 28<br />
4 55-65 292 1000 PCB 44 and 52<br />
5 65-68 326 1000 PCB 103 (Internal Standard)<br />
6 68-71 115 1000 Oxychlordane<br />
7 71-75 292 1000 PCB 66<br />
8 75-78 373 1000 gamma-chlordane<br />
9 78-87 326 333 PCB 101<br />
409 333 nonachlor III and trans-nonachlor<br />
373 333 alpha-chlordane<br />
10 87-92 246 1000 p,p'-DDE<br />
11 92-97 329 1000 octachlorotoxaphene<br />
12 97-99.6 326 1000 PCB 118<br />
13 99.6-103 409 500 cis-nonachlor<br />
235 500 p,p'-DDD<br />
14 103-107 360 500 PCB 153<br />
326 500 PCB 105<br />
15 107-110 235 500 p,p'-DDT<br />
360 500 PCB 138<br />
16 110-116 394 333 PCB 187<br />
327 333 nonachlorotoxaphene<br />
360 333 PCB 128<br />
17 116-122 394 500 PCB 180<br />
430 500 PCB 170<br />
18 122-126 430 1000 PCB 195<br />
19 126-129 464 1000 PCB 206<br />
20 129-132 498 1000 PCB 209<br />
1. Adjust the Time ranges as necessary (e.g., after <strong>GC</strong> maintenance) based on the retention times of<br />
the analytes.<br />
2. Analyze sets of samples along with five or more calibration standards (referred to as multi-level<br />
standards)<br />
2.1. Each multilevel calibration standard contains the analytes at a different concentration so that the<br />
concentrations of the calibration standards span the range of analyte concentrations expected to<br />
be found in the tissue samples.<br />
2.2. Monitor the <strong>GC</strong>/<strong>MS</strong> reproducibility using the mid-level calibration standard. Analyze a mid-level<br />
calibration standard at the beginning, middle and end of the series of samples and standards.<br />
Data Processing<br />
3. Calculate the concentrations of the analytes relative to the Internal Standard in the samples using the<br />
quadratic regression of signal versus concentration in the multilevel standards. [Note that this<br />
calibration/calculation process will have its own SOP once the analysis has been validated and the<br />
August 17, 2000 2
calculation databases have been developed.]<br />
4. Calculate the lower quantitation limits for analytes in samples using the <strong>GC</strong>/<strong>MS</strong> minimum area<br />
equivalent to the area of the analytes in the lowest level calibration standard analyzed with the set.<br />
5. Calculate the % recovery of the Internal Standard PCB 103 using the <strong>GC</strong> Internal Standard<br />
Tetrachloro-meta-xylene.<br />
6. Calculate the estimated concentration of total PCBs by multiplying 2 times the sum of the<br />
concentrations of the 17 PCB congeners.<br />
- DRAFT -<br />
August 17, 2000 3