Chapter 12 Stata v10.1 Analysis Examples Syntax and Output ...
Chapter 12 Stata v10.1 Analysis Examples Syntax and Output ...
Chapter 12 Stata v10.1 Analysis Examples Syntax and Output ...

Create successful ePaper yourself
Turn your PDF publications into a flip-book with our unique Google optimized e-Paper software.
<strong>Chapter</strong> <strong>12</strong> <strong>Stata</strong> <strong>v10.1</strong> <strong>Analysis</strong> <strong>Examples</strong> <strong>Syntax</strong> <strong>and</strong> <strong>Output</strong><br />
General Notes on <strong>Stata</strong> 10.1<br />
Given that this tool is used throughout the ASDA textbook this chapter includes only the syntax <strong>and</strong><br />
output for the analysis examples provided in <strong>Chapter</strong> <strong>12</strong>. <strong>Stata</strong> 10.1 is an excellent tool for survey<br />
data analysis as well as graphing <strong>and</strong> related data management tasks. It offers a very comprehensive<br />
set of svy comm<strong>and</strong>s as well as weighted graphics <strong>and</strong> convenient syntax <strong>and</strong> data management abilities.<br />
For these reasons, we use <strong>Stata</strong> as the primary software for the ASDA text.<br />
The examples <strong>and</strong> syntax presented here assume that all data management including variable construction,<br />
labels for variable values <strong>and</strong> other preparation steps are complete. See the <strong>Stata</strong> documentation for<br />
assistance with these issues.<br />
All analysis examples presented can be done in <strong>Stata</strong> 10.1 <strong>and</strong> are included in this chapter’s output.<br />
Please check the <strong>Stata</strong> documentation <strong>and</strong> also the ASDA web site for updates to <strong>Stata</strong> as new versions<br />
are released. For example, we have already included an example of how to use <strong>Stata</strong> 11.0 with the new<br />
“factor” variable features/syntax <strong>and</strong> compared this to the older “xi” type of syntax for including<br />
categorical variables in data analysis.
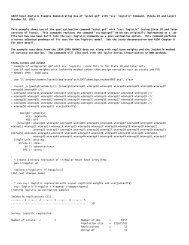
0<br />
5000<br />
10000 15000<br />
CHAPTER <strong>12</strong> ANALYSIS EXAMPLES REPLICATION STATA 10 HRS 2004 AND 2006 DATA USED FOR ALL EXAMPLES<br />
. xtline totassets000 if hhidpn
* create a new variable for the gllamm comm<strong>and</strong> (unique id for stratum <strong>and</strong> secu)<br />
gen newsecu = stratum *100 + secu<br />
* generate another set of level 1 <strong>and</strong> 2 weights <strong>and</strong> run gllamm<br />
gen pwt2 = baseweight<br />
gen pwt1 = l1weight_r<br />
. xi: gllamm totassets000 yrssince00 , i(hhidpn) pweight(pwt) adapt cluster(newsecu)<br />
Running adaptive quadrature<br />
Iteration 0: log likelihood = -1.104e+08<br />
Iteration 1: log likelihood = -1.099e+08<br />
Iteration 2: log likelihood = -1.092e+08<br />
Iteration 3: log likelihood = -1.091e+08<br />
Iteration 4: log likelihood = -1.091e+08<br />
Iteration 5: log likelihood = -1.091e+08<br />
Adaptive quadrature has converged, running Newton-Raphson<br />
Iteration 0: log likelihood = -1.091e+08<br />
Iteration 1: log likelihood = -1.091e+08 (backed up)<br />
Iteration 2: log likelihood = -1.091e+08<br />
Iteration 3: log likelihood = -1.091e+08<br />
number of level 1 units = 4350<br />
number of level 2 units = 11<strong>12</strong><br />
Condition Number = 6410.0376<br />
gllamm model<br />
log likelihood = -1.091e+08<br />
Robust st<strong>and</strong>ard errors for clustered data: cluster(newsecu)<br />
------------------------------------------------------------------------------<br />
totassets000 | Coef. Std. Err. z P>|z| [95% Conf. Interval]<br />
-------------+----------------------------------------------------------------<br />
yrssince00 | 81.73993 13.04773 6.26 0.000 56.16684 107.313<br />
_cons | 741.527 78.63583 9.43 0.000 587.4036 895.6503<br />
------------------------------------------------------------------------------<br />
Variance at level 1<br />
------------------------------------------------------------------------------<br />
4402531 (1464316.4)<br />
Variances <strong>and</strong> covariances of r<strong>and</strong>om effects<br />
------------------------------------------------------------------------------<br />
***level 2 (hhidpn)<br />
var(1): 3510574.4 (1524032.8)<br />
------------------------------------------------------------------------------
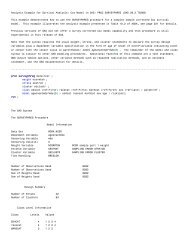
* run analogous model in svy regress<br />
. gen wgt1_2 = pwt1*pwt2<br />
(2516 missing values generated)<br />
. svyset newsecu [pweight=wgt1_2]<br />
pweight: wgt1_2<br />
VCE: linearized<br />
Single unit: missing<br />
Strata 1: <br />
SU 1: newsecu<br />
FPC 1: <br />
. svy: regress totassets000 yrssince00<br />
(running regress on estimation sample)<br />
Survey: Linear regression<br />
Number of strata = 1 Number of obs = 4447<br />
Number of PSUs = 104 Population size = 11793472<br />
Design df = 103<br />
F( 1, 103) = 39.74<br />
Prob > F = 0.0000<br />
R-squared = 0.0043<br />
------------------------------------------------------------------------------<br />
| Linearized<br />
totassets000 | Coef. Std. Err. t P>|t| [95% Conf. Interval]<br />
-------------+----------------------------------------------------------------<br />
yrssince00 | 83.84876 13.30053 6.30 0.000 57.4703 110.2272<br />
_cons | 744.0301 79.56743 9.35 0.000 586.2269 901.8333<br />
------------------------------------------------------------------------------