Europe's Vibrant New Low Car(bon) Communities - ITDP | Institute ...
Europe's Vibrant New Low Car(bon) Communities - ITDP | Institute ...
Europe's Vibrant New Low Car(bon) Communities - ITDP | Institute ...

Create successful ePaper yourself
Turn your PDF publications into a flip-book with our unique Google optimized e-Paper software.
<strong>Institute</strong> for Transportation<br />
& Development Policy<br />
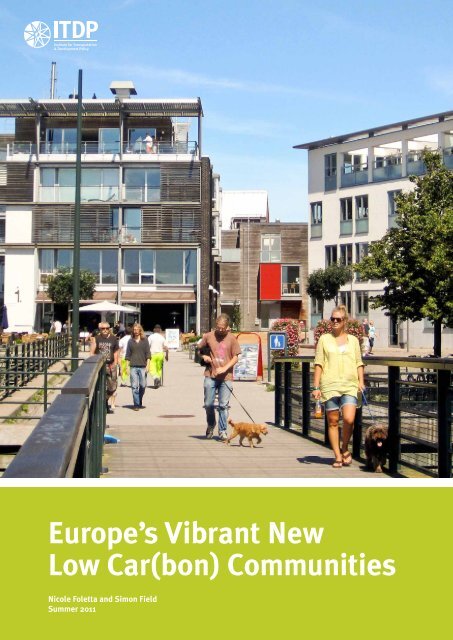
Europe’s <strong>Vibrant</strong> <strong>New</strong><br />
<strong>Low</strong> <strong>Car</strong>(<strong>bon</strong>) <strong>Communities</strong><br />
Nicole Foletta and Simon Field<br />
Summer 2011
This report was researched and written by Nicole Foletta and Simon Field in 2010.<br />
It was edited by Dani Simons. Many thanks to Michael Replogle, who conceived<br />
and edited earlier versions of this report, as well as Walter Hook, Luc Nadal and<br />
Michael Kodranksy for their reviews and revisions. Cover photo from La-Citta-Vita<br />
on Flickr.<br />
Additionally the authors would like to acknowledge the following people for providing<br />
information vital to the creation of the case studies:<br />
Herbert Tiemens, Frank-Jos Braspenning, Csaba Gyarmati, Magnus Fahl, Björn<br />
Cederquist, Daniel Firth, Malena Karlsson, Diego Pos, Corine Marseille, Qian Jiang,<br />
Olivier Oudin, Simon Stolz, Hans-Georg Kleinmann, Fabian Mantau, Roberto de<br />
Tommasi, Synergo, Hannes Linck, Verein für autofreies Wohnen e.V., Christian<br />
Dörkes, Stadt Köln, Janin Schindelhauer
Executive Summary 5<br />
CASE STUDIES<br />
Greenwich Millennium Village 8<br />
GWL Terrein 18<br />
Hammarby Sjöstad 30<br />
Houten 46<br />
Sihlcity 60<br />
Stellwerk 60 70<br />
Västra Hamnen 82<br />
Vauban 94<br />
CONCLUSION<br />
Comparative Analysis 107<br />
Lessons Learned 113
uilding low car(<strong>bon</strong>) communities<br />
Executive Summary<br />
Moving is a time to reevaluate the stuff you own. Boxes of family<br />
photos? Coming. That ratty old couch? Not coming. But what if you<br />
could leave something even bigger behind? Like your car?<br />
<strong>New</strong> developments are often associated with sprawl and more<br />
driving. But eight communities across Europe demonstrate there is a<br />
different model. <strong>ITDP</strong> Europe investigated these developments and<br />
found by using smart urban and transportation planning and design,<br />
they have created communities with lower car ownership rates and<br />
less driving than nearby developments of comparable sizes and age.<br />
As a result these communities have less pollution, greenhouse gas<br />
emissions, public health issues and other negative externalities<br />
associated with driving.<br />
These new developments use a combination of “push” measures<br />
to discourage private car use and “pull” measures to improve<br />
the attractiveness of walking, cycling, transit and various forms<br />
of shared vehicle use. As the report demonstrates, these measures<br />
work, and could be applied in other new developments around<br />
the world, particularly in abandoned industrial sites or on other<br />
previously developed land.<br />
The eight case study locations are summarized in Table 1.<br />
Eventually these measures should be applied to all urban development,<br />
in order to minimize the need for driving and maximize the<br />
opportunities for healthier, more sustainable forms of transportation.<br />
Therefore <strong>ITDP</strong> presents these case studies, identifies lessons<br />
learned and compares the planning, design and travel demand<br />
management techniques used so that others might follow the lead<br />
of these eight communities.<br />
Each case study includes background information on the origins<br />
of the development and how these best practices were incorporated<br />
at early stages of the developments’ planning processes, before<br />
describing individual measures in more detail. Quantitative data on<br />
vehicle ownership, modal split and transport-related emissions are<br />
principles for smart urban growth<br />
1. Walk: Develop neighborhoods that promote<br />
walking<br />
2. Cycle: Prioritize bicycle networks<br />
3. Connect: Create dense networks of streets<br />
and paths<br />
4. Transit: Support high-quality transit<br />
5. Mix: Plan for mixed use<br />
6. Densify: Match density with transit capacity<br />
7. Compact: Create compact regions with<br />
short commutes<br />
8. Shift: Increase mobility by regulating<br />
parking and local road use<br />
Developed by a team of urban design experts<br />
including <strong>ITDP</strong>, Gehl Architects, Nelson Nygraard,<br />
and Calthorpe Associates<br />
then presented, based on the literature and/or surveys developed by<br />
<strong>ITDP</strong> Europe, followed by a summary of lessons learned and recommendations<br />
for further research.<br />
It is worth noting that the most successful “car-free” and largely<br />
“parking-free” developments reviewed had well-organized grassroots<br />
support for the concept from the outset. Planners and decision<br />
makers should look for willing partners as they undertake these<br />
Table 1: Case study locations<br />
Development Location Type<br />
Size<br />
(hectares)<br />
Greenwich Millennium Village<br />
GWL Terrein<br />
London,<br />
United Kingdom<br />
Amsterdam,<br />
The Netherlands<br />
Brownfield: mixed use, car-reduced 29<br />
Brownfield: residential, car-free 6<br />
Hammarby Sjöstad Stockholm, Sweden Brownfield: mixed use 160<br />
Houten<br />
Utrecht,<br />
The Netherlands<br />
Greenfield “cycling city” of 45,000<br />
people<br />
820<br />
Sihlcity Zurich, Switzerland Brownfield: leisure and retail 4<br />
Stellwerk 60 Cologne, Germany Brownfield: residential, car-free 6<br />
Västra Hamnen Malmö, Sweden Brownfield: mixed use 175<br />
Vauban Freiburg, Germany Brownfield: mixed use, car-reduced 41
6 Europe’s <strong>Vibrant</strong> <strong>New</strong> <strong>Low</strong> <strong>Car</strong>(<strong>bon</strong>) <strong>Communities</strong><br />
endeavors. And they should foster community participation to build<br />
support as the project evolves, and to ensure the endurance of the<br />
vision for the development once it is built.<br />
The top lessons learned from these case studies closely align<br />
with the Principles for Transport in Urban Life, and are as follows:<br />
1. Develop neighborhoods for walking and prioritize bicycling<br />
networks.<br />
The majority of developments in the case studies provide direct, safe<br />
and comfortable walking and cycling routes, and plentiful covered<br />
cycle parking. They also use a technique called “filtered permability”<br />
to make travel by bicycle or foot more direct than by car (Table 2), and<br />
locate bicycle parking closer to homes than car parking. This gives<br />
walking and cycling a competitive advantage over the car. Some are<br />
beginning to use bike sharing to encourage occasional bike use by<br />
visitors and residents alike.<br />
These developments are built with pedestrians and cyclists in<br />
mind; dense networks of streets allow pedestrians and cyclists to<br />
pass, even where cars cannot (filtered permeability). This design is<br />
reinforced with low speed limits and traffic calming. By making car<br />
use less convenient than other modes, residents are subtly nudged<br />
to consider other modes.<br />
2. Provide high-quality transit.<br />
The transport in all of the case study areas is responsive to resident<br />
needs, and therefore has high mode share. Stops are within half a<br />
kilometer of every home, and service frequencies are at least every 15<br />
minutes. Integration into the regional transit network and long service<br />
hours all make riding convenient while low-cost period passes<br />
keep it affordable. By optimizing conditions for walking, cycling and<br />
transit, living car-free becomes more realistic. Many developments<br />
also provide nearby carsharing locations to help residents feel more<br />
comfortable giving up their private cars.<br />
3. Create compact regions with short commutes and zone new<br />
developments for mixed use.<br />
These case studies also suggest that new developments should<br />
be planned as closely as possible to existing job centers and other<br />
destinations. This makes investments in transit and cycling networks<br />
more efficient and effective. Mixed uses (housing, jobs, leisure<br />
facilities, shops, grocery stores, etc.) should be incorporated into<br />
new developments at site selection and masterplanning stage, to<br />
minimize travel distances, enabling residents to make routine trips<br />
on foot or by bicycle, with convenient public transportation offering a<br />
realistic alternative to the car.<br />
4. Increase mobility by regulating parking and road use.<br />
In addition to the nudges the urban design of these communities<br />
provide, many also use regulations to incentivize and in some cases<br />
mandate reduced car use, using a variety of techniques including<br />
placing stringent caps on car trip generation and CO 2 emissions and<br />
relaxing parking minimums if other criteria to reduce car demand are<br />
met. In many of the cases, parking supply has been reduced and the<br />
parking that does exist is separated spatially and fiscally from housing<br />
units. In some cases the planners have also required developers<br />
to fund or build transportation infrastructure and services (including<br />
mobility management services) as a condition of site approval.<br />
Masterplanning competitions can foster further innovation in both<br />
the built environment and transportation planning.<br />
Table 2: Mode share and car ownership rates for study sites and reference areas<br />
Mode share (proportion of all trips)<br />
Location by car by transit by bicycle on foot<br />
<strong>Car</strong>s per 1,000<br />
residents<br />
Greenwich Millennium Village 18% 49% 4% 29% 350<br />
Greenwich District 44% 29% 1% 26% 350<br />
GWL Terrein 6% 14% 50% 30% 190<br />
Amsterdam West 20% 18% 32% 30% 310<br />
Hammarby Sjöstad 21% 52% 9% 18% 210<br />
Stockholm Reference District 35% 50% 7% 8% n/a<br />
City of Houten 34% 11% 28% 27% 415<br />
City of Zeist (The Netherlands) 46% 11% 29% 14% 530<br />
Sihlcity: visitor trips 30% 70% (transit, cycling, walking combined) —<br />
Letzipark: visitor trips n/a n/a n/a n/a —<br />
Stellwerk 60 21% * 53% * 31% * 29% * 60<br />
Nippes District 61% * 33% * 3% * 3% * 309 +<br />
Västra Hamnen 23% 17% 31% 29% 440<br />
City of Malmö 41% 16% 23% 20% 480<br />
Vauban # 16% 19% 64% (bicycle/walking combined) 160<br />
City of Freiburg # 30% 18% 28% 24% 393<br />
* Mode share based on distance traveled<br />
+ Data for the smaller Nippes Stadtteil<br />
# Mode share data from 1999/2000 (prior to extension of the tram system to Vauban)
Executive Summary 7<br />
5. Market sustainable transportation.<br />
Many of these developments make ongoing efforts to reinforce their<br />
founding vision and to empower residents and visitors to make sustainable<br />
travel decisions by offering tailored mobility advice, running<br />
marketing and awareness campaigns, and through promotions such<br />
as free or discounted transit passes or car-sharing membership for<br />
new residents. Ongoing measures to encourage low-emission travel<br />
behavior are important to ensure the long-term transport sustainability<br />
of residents. Planners should consider whether the developers<br />
should be asked to fund these initiatives or if there are ways to create<br />
dedicated streams of revenue (e.g. by earmarking a portion of parking<br />
fees or outdoor advertising fees/space) to fund them over time.<br />
6. Don’t forget the larger policy context.<br />
Transportation policies at the city, regional and national levels play<br />
a key role in shaping daily travel behavior and residential locations<br />
in the longer-term. Congestion charges, citywide parking management<br />
policies, high fuel prices, and high quality transit all influence<br />
mode choice, reinforcing site-specific measures such as car-access<br />
restrictions, provision of high quality walking and cycling facilities<br />
and filtered permeability. All of the case study cities are served by<br />
national railroad systems, providing an alternative to the car for<br />
longer-distance journeys, thereby complementing measures to<br />
discourage car ownership and use in the local area.<br />
A comparative analysis is presented in chapter ten, providing an<br />
overview of TDM measures, details of transit provision and urban<br />
design features, and a summary of key transport-related sustainability<br />
indicators: car ownership, modal split (summarized in Table 2)<br />
and transport-related emissions.<br />
In summary, it was found that private car use accounts for less<br />
than 35% of all trips made by residents in all of the sites (Stellwerk 60<br />
result inferred from distance-based data), a figure that is generally<br />
lower than comparable sites without integrated TDM strategies.<br />
<strong>Car</strong> ownership was found to be no more than 440 vehicles per 1,000<br />
residents in the residential developments, and less than 200 in sites<br />
with priced, limited and spatially separated parking: GWL Terrein,<br />
Stellwerk 60 and Vauban. These sites generate less than 350 kg<br />
of car-related CO 2 per capita per annum, equivalent to savings of<br />
around two thirds compared with their reference areas. These figures<br />
demonstrate both the efficacy of TDM measures and the importance<br />
of building in the right location, close to centers of existing economic<br />
and social activity.<br />
Further Research Needs<br />
Further household research should be conducted to update the case<br />
studies as necessary and to add to the evidence base justifying the<br />
implementation of these policies and practices in Western Europe<br />
and in new developments around the globe. Additional quantitative<br />
research is required to assess both the demand for car-free living<br />
and the financial performance — in terms of rental and property<br />
prices — of heavily car-reduced and car-free areas. This would<br />
encourage local authorities, planners, investors and developers to<br />
be more pro-active in considering this type of development, which<br />
has been shown to reduce car dependence and transport-related CO 2<br />
emissions significantly. Many of the lessons learned are replicable<br />
or adaptable for implementation elsewhere: the task now is to<br />
communicate the successful and transferable policies to politicians,<br />
planners and other relevant stakeholders across the world.
case study<br />
Greenwich<br />
Millennium Village<br />
london, united kingdom<br />
Nicole Foletta, <strong>ITDP</strong> Europe
gmv site facts<br />
Developer: Greenwich Millennium<br />
Village Limited (GMVL)<br />
Architect: Ralph Erskine<br />
Population: 2,300<br />
Developed Area: 20 ha<br />
Total Area: 29 ha<br />
Current Density: 120 persons/ha<br />
Projected Density: 180 persons/ha<br />
Current Residential Units: 1,095<br />
Planned Residential Units: 2,900<br />
Construction Began: 1999<br />
Planned Completion: 2014<br />
Distance from City Center: 9 km<br />
<strong>Car</strong>s: 350 cars/1,000 residents<br />
Parking Spaces/Residence: 0.8<br />
Non-motorized Mode Share: 32%<br />
Public Transport Mode Share: 49%
10 Europe’s <strong>Vibrant</strong> <strong>New</strong> <strong>Low</strong> <strong>Car</strong>(<strong>bon</strong>) <strong>Communities</strong><br />
background<br />
Greenwich Millennium Village (GMV) is an excellent example of<br />
mixed-use, brownfield redevelopment, well-served by transit, with<br />
strict parking regulations and a layout that limits through car traffic<br />
(Photo 1). While car ownership rates in the development are only<br />
marginally better than in the surrounding area, car use is significantly<br />
lower.<br />
GMV is located on the Greenwich Peninsula, a 121-hectare<br />
brownfield redevelopment site formerly occupied by the town gas<br />
works, on the southern banks of the River Thames in southeast<br />
London, about 9 kilometers from the London city center. In 1997<br />
English Partnerships 1 committed to transforming the Peninsula,<br />
one of the largest development sites in London, into a new residential<br />
community. The regeneration project is currently in phase one<br />
of a twenty-year build program, which will see 10,000 residential<br />
units, leisure and retail facilities, as well as educational and health<br />
centers. GMV occupies 29 hectares on the south-eastern side of the<br />
Greenwich Peninsula.<br />
The project was the first “Millennium Community” to be identified<br />
by English Partnerships and is being developed by Greenwich<br />
Millennium Village Limited, a joint venture between Countryside<br />
Properties and Taylor Wimpey. The Millennium <strong>Communities</strong><br />
Programme was launched by English Partnerships alongside the<br />
Department for <strong>Communities</strong> and Local Government to create<br />
seven exemplary sustainable communities nationwide. Each of the<br />
seven communities is to incorporate high-density housing, green<br />
spaces, good transport links, and easy access to shops and recreation<br />
facilities, producing quality places where people want to live.<br />
In order to ensure that sustainability goals are met, the Millennium<br />
<strong>Communities</strong> Programme has set standards for energy efficiency,<br />
water consumption, transport, building defects, recycling and health<br />
and safety on site. In line with these goals, the housing at GMV is of<br />
modern, environmentally-friendly design, and the development aims<br />
to cut primary energy use by 80%, compared to traditional developments<br />
of similar size, using low-energy building techniques and<br />
renewable energy technologies. Finally the project aims to reduce car<br />
dependency by giving priority to cyclists and pedestrians, providing<br />
access to high quality public transportation, and restricting and pricing<br />
car parking (Photos 2 and 3).<br />
London is one of the largest and most congested cities in Europe,<br />
it has also been on the forefront of fighting congestion in part by<br />
reducing demand for private car use. While policies like congestion<br />
charging have been successful in Inner London, car use remains<br />
prevalent in Outer London. Therefore it is important for developments<br />
such as GMV, located outside the city center, to implement<br />
strategies aimed at reducing car dependency.<br />
GMV is marketed as an experiment in sustainable development.<br />
<strong>New</strong> residents are given a packet of information on sustainable living<br />
when they move in. Various studies have shown that residents support<br />
the concept and ethos of the village. Further, they appreciate the<br />
sustainable design features and enjoy being part of the special community,<br />
demonstrating the project’s success not only as a sustainable<br />
development, but as a liveable community as well (Cherry and<br />
Hodkinson 2009).<br />
To date, 1,095 homes, a primary school, a health center,<br />
an ecology park and a village square with shops have been completed,<br />
on 20 hectares (Figure 1). All of the residential units are<br />
currently occupied.<br />
The homes completed include a number of live/work units and<br />
a wide range of affordable housing. Developers plan to continue<br />
expansion of GMV until 2014, including additional housing, retail,<br />
and a community center, with a total developed area of 29 hectares<br />
for the entire village (English Partnerships Website).<br />
planning process<br />
In 1997, English Partnerships launched a competition to design<br />
and build Greenwich Millennium Village, the first community in the<br />
Millennium <strong>Communities</strong> Programme. The competition was won<br />
by Greenwich Millennium Village Limited (GMVL), a joint venture<br />
between Countryside Properties and Taylor Wimpey. English<br />
Partnerships and GMVL signed a Section 106 Agreement (see Section<br />
106 Agreements sidebar, p. 11) in which GMVL agreed to build a<br />
sustainable mixed-use residential development of 1,400 dwellings<br />
Bus Stop<br />
Health Center<br />
Bus Only Lane<br />
1 English Partnerships was a non-departmental public body funded<br />
through the Department for <strong>Communities</strong> and Local Government.<br />
It was responsible for land acquisition and assembly and major<br />
development projects, alone or in joint partnership with private<br />
sector developers. In December 2008 its powers passed to<br />
a successor body, the new Homes and <strong>Communities</strong> Agency.<br />
<strong>Car</strong>sharing<br />
Parking<br />
Grocery Store<br />
Figure 1: Map of GMV<br />
School<br />
Development<br />
Area Phase I+II<br />
Development<br />
Area Phase III+IV<br />
Walking and<br />
Cycling Path<br />
Parking<br />
Grocery Store
Greenwich Millennium Village 11<br />
with 20% designated as affordable housing. For the affordable<br />
housing portion of the development, GMVL is working in association<br />
with social housing partners Moat Housing. GMVL also agreed to<br />
contribute a specified sum for bus improvements in the area and to<br />
submit a parking garage management plan.<br />
In return, English Partnerships agreed to fund the Millennium<br />
Busway, a bus only lane running through the development, as well as<br />
a state of the art integrated school and health center, which opened<br />
in 2001 (see Figure 1). English Partnerships also agreed to produce an<br />
annual travel monitoring study including analysis of mode split and<br />
parking demand of GMV residents in addition to a strategy plan for<br />
reducing car use.<br />
Construction of GMV began in 1999 and the first homes were<br />
occupied by 2000. Phases 1 and 2 of the building process were completed<br />
by 2002, producing 1,095 residential units, a village square<br />
with shops, an artificial lake and an ecology park.<br />
In 2006 a new Section 106 Agreement was signed between the<br />
Greenwich Peninsula landowners, English Partnerships, and GMVL.<br />
This agreement increased the planned development size from 1,400<br />
to 2,900 residential units and increased the required share of affordable<br />
housing from 20% to 35%. The agreement laid out the plans for<br />
Phases 3 and 4 of the development which will include construction<br />
of around 1,800 additional new homes, 15,000 square feet of retail<br />
spaces, 70,000 square feet of work space, a community center and<br />
a nursery. The planned completion date for Phases 3 and 4 is 2014<br />
(English Partnerships Website).<br />
key policy and design strategy<br />
The Millennium <strong>Communities</strong> Programme has recognized reduced<br />
car dependency as a key sustainability issue. This is especially<br />
apparent in the city of London which has limited room for additional<br />
parking spaces and a high level of traffic congestion. Spurred by<br />
these concerns, GMV has incorporated several transportation<br />
demand management strategies aimed at reducing car dependency<br />
and promoting other, more sustainable forms of transport.<br />
Parking<br />
As part of its strategy to reduce car dependency, motor vehicle parking<br />
at GMV is restricted and generally located away from individual<br />
properties. Parking spaces are only available for 80% of units. Two<br />
floors of parking garage are located beneath two of the apartment<br />
buildings built during Phase 1. In Phase 2, car parking facilities were<br />
separated from apartment units and located at the edge of the development.<br />
Overall there are 884 parking spaces in the development.<br />
Further, parking spaces are unbundled from apartment units, so<br />
residents who choose to have a parking space must pay for it separately<br />
from their residence. Residents don’t pay for a specific parking space,<br />
but rather for a “right to park,” which means they can enter the parking<br />
garage and must then search for an available space. Prices per space<br />
have gone up since the development was first built, but the current price<br />
is 17,500 gbp per parking space (Marcello Burbante, pers. comm.).<br />
Only residents who have purchased a space are allowed to park in<br />
the garages; visitors are not allowed. Visitors are expected either to<br />
park temporarily in the bays on the main roads, which are frequently<br />
ticketed by the council, or in the public parking lot next to the North<br />
Greenwich transit station located 0.8 kilometers northwest of GMV.<br />
section 106 agreements<br />
These agreements refer to Section 106 of the British<br />
Parliament’s Town and Country Planning Act of 1990,<br />
which regulates the development of land in England<br />
and Wales. Section 106 permits local authorities and<br />
developers to make agreements over the use of land,<br />
including planning obligations by the developer<br />
to contribute towards sustainable communities<br />
and offset the costs of the external effects of the<br />
development. Contributions by the developer<br />
may include cash, infrastructure investments or<br />
provision of services. Examples include provision<br />
of new schools, public space, affordable housing,<br />
new roads and public transport. Section 106<br />
agreements are legally binding and are linked to the<br />
granting of planning permission. Each agreement<br />
is different and depends on the unique needs of<br />
each community. Some agreements may include<br />
measures aimed at reducing transport-related<br />
emissions. Transport-related measures that have<br />
been included by the Greenwich Council (specifically<br />
for the Woolwich Town Centre Development) include:<br />
provision of carsharing, controls on parking permits,<br />
emission-related parking charges, provision of<br />
electric vehicle charging points and use of bio-fuel in<br />
delivery vehicles (Birch 2010).<br />
However, during school holidays people are informally allowed to<br />
park in the school’s parking lot. In addition, residents often rent out<br />
their spaces to neighbors during the winter holidays by advertising<br />
on bulletin boards in the shared spaces. In this way, residents have<br />
taken it upon themselves to manage the existing parking supply as<br />
efficiently as possible, treating it as a valuable commodity.<br />
Cycling and Pedestrian Infrastructure<br />
On the flip side, GMV strives to promote cycling and walking. A<br />
network of cycle and pedestrian routes runs throughout the village<br />
and beyond, connecting the development to the surrounding areas.<br />
For example, a pedestrian walkway leads from GMV to The O2 Arena,<br />
a large sports and music venue located in the Millennium Dome on<br />
the northern side of the Greenwich Peninsula. Within GMV, secure<br />
bicycle storage facilities are provided for every housing unit and<br />
2–3 bicycle parking spaces are available per unit, including several<br />
covered, weather-protective bicycle parking facilities (Photo 4).<br />
<strong>Car</strong>sharing<br />
Two carsharing vehicles, provided by Streetcar, are located just to<br />
the north of GMV (Streetcar Website). These vehicles are located in a<br />
car bay on John Harrison Way, which boarders GMV. In addition, two<br />
Streetcar carsharing vehicles are located in a parking lot off of Tunnel<br />
Avenue, about half a kilometer south of GMV. Other than these four
12 Europe’s <strong>Vibrant</strong> <strong>New</strong> <strong>Low</strong> <strong>Car</strong>(<strong>bon</strong>) <strong>Communities</strong><br />
1<br />
Greenwhich<br />
Millennium<br />
Village<br />
2<br />
North<br />
Greenwich<br />
Transit Station<br />
The Underground<br />
is the most popular<br />
mode of transport<br />
for GMV residents.<br />
The new station<br />
was built to allow<br />
for larger volumes<br />
of passengers and<br />
provides direct<br />
connection between<br />
the Underground<br />
and 8 bus routes.
Greenwich Millennium Village 13<br />
3<br />
Millennium<br />
Busway<br />
The Millennium<br />
Busway runs from the<br />
station through GMV,<br />
with two stops located<br />
within the village.<br />
4<br />
Bicycle<br />
parking<br />
Secure bicycle<br />
storage is provided<br />
for every housing<br />
unit, and 2–3 bike<br />
parking spaces are<br />
available per unit.
14 Europe’s <strong>Vibrant</strong> <strong>New</strong> <strong>Low</strong> <strong>Car</strong>(<strong>bon</strong>) <strong>Communities</strong><br />
vehicles, no other carsharing vehicles from any other companies are<br />
located on Greenwich Peninsula. There seems to be a potential to<br />
locate more carsharing vehicles on this site, particularly inside the<br />
GMV parking garages themselves.<br />
Urban Design<br />
GMV was designed by masterplanning architect Ralph Erskine to<br />
be a modern urban village, incorporating high density residential<br />
units with green public spaces and providing opportunities for<br />
leisure activities and shopping. Erskine was known for his preference<br />
for design with limited through car traffic. He also worked on the<br />
Bo01 car-free development in Malmö. In line with these principles,<br />
Erskine’s vision for GMV was to create a community where the pedestrian<br />
has priority over the car.<br />
Street Layout and Design:<br />
Main thoroughfares run along the northwest and southwest borders<br />
of the development. Further, two main thoroughfares run through<br />
GMV. West Parkside bisects the development, while Southern Way<br />
splits off from West Parkside midway through the development and<br />
runs southward. A two-lane dedicated busway which starts at North<br />
Greenwich station passes through the village along West Parkside,<br />
turning onto Southern Way (Figure 1). The busway is separated from<br />
car lanes by a green median. The busway is distinguished by its<br />
brick-red color. On the south side of the village is a road that leads to<br />
the school parking lot. Other than these roads, the development is<br />
car-free and priority is given to cyclists and pedestrians.<br />
Public Space Design:<br />
Provision of public spaces was an important component of the design.<br />
The village includes an ecology park, a village square and landscaped<br />
courtyards. The ecology park, covering 0.2 square kilometers, includes<br />
two lakes and a thriving wildlife population. In addition, garden squares<br />
are located through-out the residential areas. The design gives priority<br />
to the cyclist and pedestrian, providing pedestrian and cycling<br />
pathways separated from motor vehicle traffic throughout the village.<br />
Furthermore, safety is enhanced through monitoring of transit stops,<br />
cycle routes and pedestrian areas by CCTV.<br />
Land Use Planning and Design:<br />
GMV was designed from the beginning as a mixed-use development<br />
combining residences, retail, commercial and leisure spaces. Phase<br />
1 of the development consists of blocks of flats 8-10 stories high,<br />
surrounding inner courtyards, with two floors of parking garages<br />
beneath. The highest buildings are located on the northern side of<br />
the development, along the Thames River, to provide more waterfront<br />
views. Phase 2 includes a mix of lower rise flats up to six stories and<br />
terraced houses situated around public squares with car parking in a<br />
separate block at the side of the development. The residential units<br />
include a mix of tenure types.<br />
The village square is located near the center of the development,<br />
conveniently located within walking distance of residential<br />
units so that residents can easily conduct shopping trips and<br />
errands by bike or on foot. The uses in the village square include<br />
a small grocery store, a pharmacy and several cafes. Overall,<br />
the development includes 4,500 square meters of commercial space<br />
along with community facilities such as a school and health center<br />
(Countryside Properties Website).<br />
quantitative analysis<br />
The policy and design measures used by GMV work. GMV has<br />
a much higher residential density than the Greenwich District,<br />
in which it is located, or London as a whole. And GMV residents<br />
are far less likely to use a private car (18%) as compared to their<br />
Greenwich neighbors (44%) or Londoners overall (42%). The<br />
car ownership rate per resident is also lower for GMV than for<br />
London (Table 1).<br />
Table 1: GMV as compared to surrounding area<br />
GMV Greenwich London<br />
Population 2,300 223,000 7,600,000<br />
Area (ha) 20 * 4,700 170,000<br />
Population density (persons/ha) 120 47 45<br />
Residential units 1,095 100,000 3,000,000<br />
<strong>Car</strong>s per 1000 residents 350 350 370<br />
<strong>Car</strong> parking spaces / residential unit 0.80 na na<br />
Mode share for all trips<br />
<strong>Car</strong> 18% 44% 42%<br />
Public transit 49% 29% 25%<br />
Bicycle 4% 1% 2%<br />
Walking 29% 26% 31%<br />
* current developed area<br />
Rutherfords, 2005;<br />
Transport for<br />
London, 2009
Greenwich Millennium Village 15<br />
<strong>Car</strong> Ownership Rates<br />
Figure 2 provides a comparison of car ownership rate per household<br />
for various segments of London. The rate for GMV falls between that<br />
of Inner London, where households are generally less car dependent,<br />
and that of Outer London, where households are typically more car<br />
dependent. The rate for GMV also falls below that for London. These<br />
figures demonstrate that many households in GMV choose to live<br />
car-free, although the car ownership rate is still not quite as low<br />
as it is in Inner London.<br />
Mode Split<br />
However, while car ownership in GMV is higher than for Inner<br />
London, car use in GMV appears to be much lower than for other<br />
areas of London, even Inner London. As seen in Figure 3, only 18%<br />
of trips made by GMV residents are by car, which is much lower than<br />
for Greenwich (44%), Inner London (29%), Outer London (51%) and<br />
London (43%). The GMV data was collected through a survey of<br />
residents conducted to fulfill the requirements for the Section 106<br />
Agreement, and included in the Travel Monitoring Study 2005 Report.<br />
Public transit use is high in GMV, particularly for trips to work.<br />
Indeed, the majority of GMV commuters (79%) travel to work by<br />
public transit. The breakdown by type of public transport shows that<br />
73% of commuters travel to work by London Underground. This is not<br />
surprising given GMV’s easy access to the Jubilee Line, connecting the<br />
development to central London, and the high cost of driving to central<br />
London due to the city’s congestion charge. Figure 4 shows that a<br />
much larger proportion of GMV residents (79%) commute to work<br />
by public transit than Inner London residents (59%), Outer London<br />
residents (38%), and overall London residents (46%). Further, the<br />
proportion of GMV residents commuting to work by car is very low.<br />
Although a small proportion of GMV residents walk or cycle to<br />
work, a much higher number walk or cycle for other trip purposes<br />
such as traveling to school and shopping (see Figure 5). Nearly onethird<br />
of those who study walk to school, however, almost a quarter<br />
drive. These results are likely due to the mix of student types; children<br />
are more likely to walk or cycle to school within the village while<br />
adults taking classes outside the district might be more likely to drive.<br />
Further, while about half of residents use their car for their main<br />
Figure 2: <strong>Car</strong> ownership of GMV as compared to surrounding area<br />
1.2<br />
0.95<br />
cars per household<br />
0.8<br />
0.4<br />
0.65<br />
0.50<br />
0.77<br />
0.0<br />
GMV<br />
(2005)<br />
Inner London<br />
(2005–06)<br />
Outer London<br />
(2005–06)<br />
London<br />
(2005–06)<br />
Rutherfords, 2005;<br />
Transport for<br />
London, 2010<br />
Figure 3: Mode split for all trips<br />
100%<br />
80%<br />
car<br />
public transit<br />
bicycle<br />
percent of trips<br />
60%<br />
40%<br />
20%<br />
walk<br />
* values shown are<br />
an average of values<br />
from 2005-2008.<br />
0%<br />
GMV<br />
(2005)<br />
Greenwich<br />
(2005–08)<br />
Inner London<br />
(2005–08)*<br />
Outer London<br />
(2005–08) *<br />
London<br />
(2005–08) *<br />
Rutherfords, 2005;<br />
Transport for<br />
London, 2009
16 Europe’s <strong>Vibrant</strong> <strong>New</strong> <strong>Low</strong> <strong>Car</strong>(<strong>bon</strong>) <strong>Communities</strong><br />
weekly food shopping trip, one-third walk or cycle for this trip. Many<br />
may travel to Sainsbury’s for this trip, the first low energy food store<br />
in Britain, which is located just south of GMV (within one kilometer<br />
of most residences). The store is 50% more efficient than a standard<br />
supermarket, incorporating use of natural light, high levels of insulation,<br />
passive ventilation and under-floor heating systems (GMV<br />
Website). However, while the supermarket has a focus on energy<br />
sustainability, it seems to have overlooked transport sustainability<br />
as it caters to the car; the store is located next to an extensive parking<br />
lot with more than 300 free to use spaces. The ease of accessible<br />
parking might encourage GMV residents to drive to the store rather<br />
than cycle or walk. The store is also accessible by bus; however,<br />
Figure 5 shows that few residents travel by bus to the grocery store.<br />
Not included in Figure 5 are those who have groceries delivered. The<br />
resident survey found that eight percent have groceries delivered to<br />
their residence (Rutherfords 2005). This reduces the number of trips<br />
made by residents, but the effect on car<strong>bon</strong> footprint of these trips<br />
depends on delivery vehicle fuel and scheduling efficiency.<br />
In addition, more than half of residents walk or cycle for other shopping<br />
trips. Providing a wide variety of shops in the village makes it more<br />
convenient for residents to walk for these trips. The survey of residents<br />
was taken in 2005, and the number of shops in the village square has<br />
been expanded since that time, so it is likely that a more current survey<br />
would show a higher proportion of walking and cycling trips.<br />
Many live/work units are provided at GMV to encourage residents<br />
to work from home, thus reducing the number of commute<br />
Figure 4: Mode of travel to work<br />
100%<br />
car<br />
80%<br />
bus<br />
train<br />
percent of residents<br />
60%<br />
40%<br />
underground<br />
bicycle<br />
walk<br />
20%<br />
0%<br />
GMV<br />
(2005)<br />
Inner London<br />
(2005)<br />
Outer London<br />
(2005)<br />
London<br />
(2005)<br />
Rutherfords, 2005;<br />
Transport for<br />
London Website<br />
Figure 5: GMV resident mode of travel for various trip types, 2005<br />
100%<br />
80%<br />
car<br />
bus<br />
train<br />
percent of residents<br />
60%<br />
40%<br />
underground<br />
bicycle<br />
walk<br />
20%<br />
0%<br />
work<br />
education<br />
main weekly<br />
grocery shopping<br />
other shopping<br />
Rutherfords, 2005
Greenwich Millennium Village 17<br />
trips. Several more live/work units are planned as part of Phases<br />
3 and 4. Overall it was found that 7% of GMV residents work from<br />
home. This is similar to the proportion for Greenwich (7%) and<br />
slightly lower than for Inner London (9%), Outer London (9%),<br />
and London (9%) (Rutherfords 2005).<br />
The results of this analysis show that the policy and design<br />
measures applied in GMV appear to have had a strong influence on<br />
reducing car trips made by residents, however potential remains to<br />
increase cycling trips, particularly within the development.<br />
lessons learned<br />
While GMV residents drive less than their neighbors due to strong<br />
policy and design measures, overall car ownership remains higher<br />
than some of the other communities we reviewed. This is due in part<br />
to the location of GMV, far from central London, which demonstrates<br />
the importance of locating new development as close as possible to<br />
existing development.<br />
The good news is, GMV’s good public transit access, combined<br />
with the existence of London’s congestion fee, have resulted in an<br />
impressive commute mode share of 79% by public transit.<br />
Yet the travel choices of residents within the GMV development<br />
could still be improved. About half of residents travel by car for their<br />
weekly grocery shopping trip. Increasing the number and diversity<br />
of stores located at GMV could encourage more walking and cycling<br />
trips within the development as opposed to driving. Eight percent<br />
of residents already have groceries delivered; stores could further<br />
promote this service to encourage shoppers to leave their cars at<br />
home. It is important to ensure that these deliveries are made using<br />
sustainable transportation practices.<br />
GMV also provides live/work units. However, at the time of the<br />
survey in 2005, the presence of these units did not seem to increase<br />
the proportion of residents working from home above that of the<br />
surrounding area. Promotion of these units and addition of units in<br />
Phases 3 and 4 may encourage more residents to work from home.<br />
Home offices have the obvious benefit of reducing commute trips.<br />
However, some studies have shown an increase in other trips due to<br />
the increased flexibility of the work schedule. This is another reason<br />
why it is essential to provide amenities within walking distance of<br />
residences in order to encourage residents to walk and cycle for their<br />
daily needs rather than traveling outside the development by car to<br />
access goods and services.<br />
sources<br />
Birch, <strong>Car</strong>olyn (2010). Using Section 106<br />
Agreements to Improve Air Quality, <strong>Communities</strong><br />
and Local Government, London.<br />
Cherry, Alan and Hodkinson, Richard (2009).<br />
Millennium Homes Revisited, Ingenia, Issue 41,<br />
December 2009. http://www.ingenia.org.uk/<br />
ingenia/issues/issue41/Cherry_Hodkinson.pdf<br />
Communication with Kim Smith, Transportation<br />
Planning and Strategy Manager, Greenwich<br />
Council, May 4, 2010.<br />
Communication with Marcello Burbante,<br />
Greenwich Millennium Village Ltd. (GMVL),<br />
September 3, 2010.<br />
Coutryside Properties website, http://www.<br />
countryside-properties-corporate.com (accessed<br />
September 21, 2010).<br />
Department for <strong>Communities</strong> and Local Government<br />
(2004). Contributing to Sustainable<br />
<strong>Communities</strong> — A <strong>New</strong> Approach to Planning<br />
Obligations, Eland House, London.<br />
English Partnerships (2007). Millennium <strong>Communities</strong><br />
Programme, London. http://www.<br />
urbandesigncompendium.co.uk/public/documents/Mill%20Comms%20May%202007.pdf<br />
English Partnerships website, http://www.<br />
englishpartnerships.co.uk/gmv.htm (accessed<br />
June 28, 2010).<br />
GMV website, http://www.gmv.gb.com/transport.<br />
htm (accessed September 21, 2010).<br />
Rutherfords — Highway & Transport Planning<br />
(2005). Greenwich Millennium Village: Travel<br />
Monitoring Study, 2005 Report, Cambridge.<br />
Streetcar website, http://www.streetcar.<br />
co.uk/location.aspx?location=633 (accessed<br />
September 21, 2010).<br />
Transport for London (2008). Central London<br />
Congestion Charging: Impacts Monitoring —<br />
Sixth Annual Report, London.<br />
Transport for London (2009). Travel in London —<br />
Key Trends and Developments Report<br />
Number 1, London.<br />
Transport for London (2010). Travel in London:<br />
Report 2, London.<br />
Transport for London website, http://www.tfl.gov.<br />
uk/ (accessed September 21, 2010).<br />
Image credits<br />
Figure 1: http://maps.google.de/maps/ms?hl=en<br />
&ie=UTF8&vps=3&jsv=298d&oe=UTF8&msa=<br />
0&msid=116478322990710211544.000491ed99c<br />
ace2d3ecac<br />
Photo 1: Andrew Sparkes, www.pinholedesign.co.uk<br />
Photo 2: Nicole Foletta, <strong>ITDP</strong> Europe<br />
Photos 3, 4: Frederique Siegel, <strong>ITDP</strong> Europe
gwl terrein site facts<br />
Developer: Ecoplan Foundation<br />
Architect: Kees Christiaanse<br />
Population: 1,400<br />
Area: 6 ha<br />
Density: 230 persons/ha<br />
Residential Units: 600<br />
Construction Began: 1995<br />
Construction Completed: 1998<br />
Distance from City Center: 3 km<br />
<strong>Car</strong>s: 190 cars/1,000 residents<br />
Parking Spaces/Residence: 0.20<br />
Non-motorized Mode Share: 80%<br />
Public Transport Mode Share: 14%<br />
Households with <strong>Car</strong>sharing: 26%
case study<br />
GWL Terrein<br />
amsterdam, the netherlands<br />
Nicole Foletta, <strong>ITDP</strong> Europe
20 Europe’s <strong>Vibrant</strong> <strong>New</strong> <strong>Low</strong> <strong>Car</strong>(<strong>bon</strong>) <strong>Communities</strong><br />
background<br />
GWL Terrein is a car-free brownfield redevelopment with limited parking,<br />
carsharing provision and good transit access. Non-motorized<br />
mode share in the development is much higher than the surrounding<br />
area and car use is much lower.<br />
GWL Terrein is located in the famously cycling-friendly city of<br />
Amsterdam. The project is in the Amsterdam West District, three kilometers<br />
from the city center at the terminus of a tram line and the very<br />
edge of the late 19th century city extensions. It makes use of a six<br />
hectare site formerly used by the municipal water utility, Gemeente<br />
Waterleidingen (GWL), from which it gets its name (Photos 1 and 2).<br />
Local residents were involved in the design and development of the<br />
project. They wanted to push forward with a new approach to development<br />
focused on car-free living, reuse of resources, conservation<br />
of energy and water, and community cohesion.<br />
The inner area of the development is car-free and only emergency<br />
vehicles are allowed on site. The original residents were asked to<br />
sign a non-obligatory declaration of support for the car-free nature<br />
of the site. None of the 600 residential units include parking spaces,<br />
however, several on-street parking spaces are located along the edge<br />
of the development and a limited number of parking permits are<br />
available for residents.<br />
GWL Terrein’s environmental and social goals make it a unique<br />
place to live. The car-free inner area creates a cleaner, safer place<br />
for neighbors to interact and children to play. The focus on energy<br />
efficient building design and promotion of sustainable transportation<br />
helps reduce the car<strong>bon</strong> footprint of residents. Furthermore, the<br />
work of the residential umbrella organization encourages sustainable<br />
living and community involvement. It is no surprise that the<br />
development consistently receives high satisfaction ratings from<br />
residents, which is further underscored by the fact that 62% of<br />
residents have lived in the development for more than eight years<br />
(GWL Terrein Website). Once residents move here they don’t seem to<br />
want to leave. What began as an idealistic experiment in combining<br />
high density housing with green principles appears to have produced<br />
a neighborhood its original proponents can be proud of, even ten<br />
years later.<br />
and energy consumption. In addition, it was decided that half of the<br />
dwellings would be reserved as renter-occupied, social housing. The<br />
other half would be sold, two-thirds of which would be grant-aided<br />
owner-occupied dwellings. Furthermore, local residents would have<br />
priority in applying for dwellings.<br />
The Westerpark Urban District commissioned two architecture<br />
firms to create a conceptual plan for the development based on the<br />
Urban Planning Schedule of Requirements. In August 1993 the plan<br />
made by architect Kees Christiaanse and landscape designer Adriaan<br />
Geuze was chosen by a panel consisting of several inhabitants,<br />
representatives of the Westerpark Urban District and the project<br />
developer. This panel, along with the architect, then collaborated to<br />
create an Urban Plan for the development, which was completed in<br />
November 1993. The Environmental Advisory Bureau (BOOM) was<br />
also involved in the process to ensure that the environmental aspects<br />
of the Urban Planning Schedule of Requirements were upheld.<br />
Given the strict environmental requirements proposed, private<br />
investors were not interested in developing the site. Ultimately five<br />
housing associations set up the Ecoplan Foundation as a joint venture<br />
to coordinate and finance the development. Future inhabitants<br />
continued to be involved in the design process. In 1994, five design<br />
teams were created, each with an architect and several inhabitants,<br />
to design various sections of the development. Construction took<br />
place in three phases, starting in 1995 and ending in 1998 (Photos<br />
2 and 3) (GWL Terrein website).<br />
planning process<br />
GWL Terrein occupies the former site of the Municipal Water Company.<br />
When the water company decided to move, residents of what<br />
was then the Westerpark District (now part of the Amsterdam West<br />
District) lobbied for the location to become a residential area,<br />
while companies operating nearby wanted the location to be zoned<br />
for industrial purposes. The residents won out and in 1989 the<br />
Amsterdam city council decided to zone the area for housing. Local<br />
residents remained actively involved in the decision process and<br />
appealed for a car-free eco-district. This idea was also supported by<br />
politicians and the local community center.<br />
In 1993 the basic principles for the site were described in an<br />
Urban Planning Schedule of Requirements (SPvE). The site was<br />
to be car-free and aimed to discourage car ownership and use by<br />
ensuring good public transport, a safe environment for pedestrians<br />
and selecting inhabitants who agreed with the ecological principles<br />
of the project. Environmental goals also included reduction in water<br />
Figure 1: GWL Terrein site map
GWL Terrein 21<br />
key policy and design measures<br />
From the start, GWL Terrein had a focus on reduced car usage and<br />
sustainable living. These sentiments came from local residents of<br />
the Westerpark District and were supported by the local government.<br />
Several policy and design strategies have been incorporated into the<br />
site to help actualize this ideal. These are described below.<br />
Urban Design<br />
As mentioned, the entire six hectare site of GWL Terrein is car-free.<br />
The development consists of 17 buildings along with the renovated<br />
pump engine building, which is now home to a café. The buildings<br />
are arranged to form a high density perimeter, while the inner areas<br />
remain open, including plenty of green public spaces, wide pathways<br />
and safe areas for children to play (Photo 4).<br />
Street Layout and Design<br />
Since cars are not allowed on site, no streets pass through the<br />
development. Furthermore, signs are posted at various entrance<br />
points, stating that no motorized vehicles are allowed on the<br />
site (Photo 5). In order to enforce this, the development is raised<br />
from street level so that cars do not have access to the inner area<br />
(Photo 6). However, ramped access points are located at certain<br />
entrances to the development, and sometimes motorized twowheelers<br />
illegally enter the development. Police officers patrol the<br />
area to limit these infractions.<br />
Van Hallstraat (Photo 7), an arterial street at the eastern border<br />
of GWL Terrein, was traffic-calmed in 1999 with on-street parking<br />
removed, speed reduced, sidewalks widened and the tram terminus<br />
rebuilt and extended (Scheurer 2001). Van Hallstraat also has a<br />
brick-colored cycle lane. Near the tram terminus, this cycle lane is<br />
bordered by the tram platform and two tram lanes. Beyond the tram<br />
lanes are two lanes of traffic, followed by car parking and another<br />
cycle lane at the furthest side of the street. For the rest of Van<br />
Hallstraat the cycle lane bordering GWL Terrein is protected by a treelined<br />
median. Beyond this median are two car lanes. At the far side of<br />
the street is a lane for car parking and another cycle path. In this way,<br />
cycle lanes are protected from moving traffic either by a row of trees,<br />
a tram platform, or a strip of parked cars.<br />
Public Space Design<br />
A variety of public spaces are available between the buildings,<br />
including public green spaces, children’s play areas, shared gardens<br />
and mixed use pathways. This is important, since in such a high<br />
density development, it is impossible to provide each residential<br />
unit with a private yard. Beyond being a more efficient use of space,<br />
these shared spaces provide residents with more chances to interact,<br />
building their sense of community.<br />
An artificial canal effectively divides the development into two<br />
parts. To the north is an urban square surrounded by a nine-story<br />
residential building with ground floor retail. To the south the site is<br />
more garden-oriented with open green spaces and children’s play<br />
areas. The children’s play areas are located away from the street<br />
and have been praised by many families as being safe places where<br />
their children can play near home. In addition, several shared garden<br />
allotments are provided; which are surrounded by a protective wall<br />
of shrubbery. Within these spaces, residents can rent a garden allotment.<br />
The gardens give residents another opportunity to interact<br />
with neighbors and also provide residents with a sense of ownership<br />
for the public spaces.<br />
The area does not have any dedicated cycle lanes, but rather<br />
provides wide, mixed use pathways (shared by pedestrians and<br />
cyclists). One perspective is that this mix of uses can actually<br />
improve safety because both cyclists and pedestrians are more<br />
aware of their surroundings, looking out for fellow travelers rather<br />
than assuming that paths will be segregated.<br />
Land Use Planning and Design<br />
The site contains a few renovated historical buildings and the GWL<br />
water tower, which acts as a landmark of the district, surrounded<br />
by blocks of high density housing, designed by five different design<br />
teams, but all with a similar color scheme to bring cohesion to the<br />
development. One elongated, 186-meter long, high-rise apartment<br />
building with nine stories runs along Waterpootweg Street, the<br />
eastern border of the development (see Figure 1). Another elongated<br />
apartment complex runs along the north and northeastern borders<br />
of the site. This building structure helps to create enclosed areas<br />
within the development without applying gates or barriers between<br />
GWL Terrein and other neighborhoods. To the east, GWL Terrein is<br />
open and pathways connect the development to the 19th century<br />
neighborhoods. Overall 17 apartment buildings are located on-site.<br />
As many dwellings as possible have an entrance at street level and<br />
access to either a private ground floor garden, a rooftop garden or<br />
an open terrace. Incorporated into these residential buildings are<br />
ground floor commercial uses, live/work units, housing for persons<br />
with mental disabilities, senior housing and wheelchair accessible<br />
housing (Photo 8).<br />
Most of the apartments have 3-4 rooms with an average of 3.44<br />
rooms per home. This is higher than the average for the Westerpark<br />
District of 2.64 rooms per home. The average home value is also<br />
higher in GWL Terrein. In 2005 the average home value in GWL Terrein<br />
was 256,000€ versus 172,000€ for the Westerpark District. The larger<br />
size of residential units and higher quality housing are attractive<br />
features for families. Furthermore, 55% of residential units are<br />
owner-occupied and 45% are renter-occupied. Of the rented units,<br />
60% are social housing.<br />
Several other uses are also located on the site such as the<br />
Westerpark Community Center. The water company’s pumping<br />
station was restored and the old engine room is now home to Café<br />
Amsterdam, a popular restaurant which attracts many visitors to the<br />
district (Photo 9). The remaining space in the historic pumping station<br />
was converted to offices and a gym. Overall, 50 businesses are<br />
located at GWL Terrein (many of them home businesses) employing<br />
216 people (GWL Terrein Website). The mix of uses provides residents<br />
with shopping, entertainment and employment options within their<br />
own neighborhood. In addition, several grocery stores, shops, pharmacies<br />
and cafes are located in the surrounding neighborhoods so<br />
that residents do not have to go far to run their daily errands, which<br />
can easily be done by bicycle or walking.<br />
Public Transportation<br />
GWL Terrein is well served by public transportation. Tram line 10 was<br />
extended and terminates just outside the development at the Van<br />
Halstraat station (Photo 10). The tram lanes are segregated from car
22 Europe’s <strong>Vibrant</strong> <strong>New</strong> <strong>Low</strong> <strong>Car</strong>(<strong>bon</strong>) <strong>Communities</strong><br />
1<br />
GWL Terrein<br />
before<br />
redevelopment<br />
2<br />
GWL Terrein<br />
after<br />
redevelopment
GWL Terrein 23<br />
3<br />
GWL Terrein<br />
development<br />
4<br />
Children<br />
playing near<br />
GWL Terrein’s<br />
main landmark,<br />
the watertower<br />
5<br />
No motorized<br />
vehicles are<br />
allowed in GWL<br />
Terrein
24 Europe’s <strong>Vibrant</strong> <strong>New</strong> <strong>Low</strong> <strong>Car</strong>(<strong>bon</strong>) <strong>Communities</strong><br />
6<br />
Bollards and raised<br />
curbs prevent<br />
motor vehicles from<br />
entering.<br />
7<br />
Family<br />
cycling on<br />
Van Hallstraat<br />
Half of all trips made<br />
in GWL Terrein are<br />
by bike.
GWL Terrein 25<br />
8<br />
Many ground floor<br />
units are reserved<br />
for seniors and the<br />
disabled and have<br />
ramped access for<br />
wheelchairs.<br />
9<br />
Café<br />
Amsterdam<br />
10<br />
Tram 10 at<br />
Van Hallstraat<br />
Station
26 Europe’s <strong>Vibrant</strong> <strong>New</strong> <strong>Low</strong> <strong>Car</strong>(<strong>bon</strong>) <strong>Communities</strong><br />
traffic lanes which helps to increase tram speeds. The tram runs at<br />
10-minute intervals. In addition, two bus lines serve the development.<br />
Bus line 21 provides service to Central Station every 10 minutes. Bus<br />
line 60 provides service to Sloterdijk Station every 10 minutes.<br />
A variety of transit ticket types are available for travel within the<br />
city of Amsterdam. Public transportation users can buy a one-hour<br />
ticket, or daily tickets, good for unlimited travel within Amsterdam<br />
by tram, bus or metro. Seasonal passes are also available including<br />
weekly, monthly and annual passes. The fares for these passes are<br />
zone-based and discounts are available for youth and seniors. All<br />
ticket types and passes can be loaded onto the recently implemented<br />
OV-chipkaart, a contactless smartcard that must be swiped upon<br />
entering and exiting the public transport vehicle or station. In addition,<br />
smartcard users may choose to pay based on the distance they<br />
travel. The OV-chipkaart can be used on all public transportation<br />
throughout the Netherlands, although fares may vary depending on<br />
the region. (GVB Website)<br />
Parking<br />
Parking for the development is extremely limited. None of the<br />
residential units have parking spaces on-site. 129 on-street parking<br />
spaces are located on the west side of the district, five of which are<br />
reserved for carsharing vehicles and two for persons with disabilities.<br />
The remaining 122 spaces, equating to 0.2 spaces per<br />
residential unit, are part of the city’s public parking supply and are<br />
therefore first-come-first-served. The spaces are metered, costing<br />
three Euros per hour (versus five Euros per hour for on-street parking<br />
in central Amsterdam). Residential parking permits for these spaces<br />
cost 16 Euros per month, which is much cheaper than hourly parking,<br />
however these permits are extremely limited. Only 110 parking permits,<br />
representing 18% of households, are available for GWL Terrein<br />
residents and those on the waitlist may wait up to seven years for<br />
a permit. Residents of GWL Terrein do not qualify for residential parking<br />
permits in the nearby neighborhoods, but some residents have<br />
been known to “borrow” parking permits in order to park their cars<br />
in the surrounding areas (GWL Terrein Website). A 480-space parking<br />
lot is located nearby which charges 3 Euros per hour for parking up<br />
to a maximum of 30 Euros per day. A variety of parking subscriptions<br />
are also available which range from 98 to 295 Euros per month<br />
(QPark Website).<br />
<strong>Car</strong>sharing<br />
Five carsharing vehicles are located in the parking spaces on the<br />
boarder of the development, belonging to two carsharing organizations:<br />
Greenwheels and Diks. Since one of the main goals of the<br />
development is to reduce car ownership, provision of carsharing is<br />
important to give residents access to a car without having to own one.<br />
The vehicles are very popular among residents. Over a quarter of households<br />
have a carsharing membership (<strong>ITDP</strong> Europe 2010). Information<br />
about the two carsharing companies can be seen in Table 1.<br />
Table 1: Information about carsharing companies in GWL Terrein<br />
Diks<br />
Greenwheels<br />
Deposit 50 € 225 €<br />
Monthly subscription fee 25 € Ranges from 5–25 €<br />
Fee per km 0.12 € 0.10 €<br />
Hourly fee 2.75 € 2.50 €<br />
Discounts available None Discount with Dutch Railway card (NS card)<br />
Company membership option No Yes<br />
Number of cars available<br />
at GWL Terrein Location<br />
3 2<br />
http://www.diks.net/<br />
autodate-tekst.html,<br />
http://www.greenwheels.nl<br />
Table 2: GWL Terrein compared to surrounding areas<br />
GWL Terrein Amsterdam West Amsterdam<br />
Population 1,400 77,510 757,000<br />
Area (ha) 6 990 22,000<br />
Population density (persons/ha) 230 78 34<br />
Number of residential units 600 na 390,000<br />
<strong>Car</strong>s per 1,000 residents 190 310 370<br />
Bikes per 1,000 residents 1,300 na 730<br />
<strong>Car</strong> parking spaces / residential unit 0.20 na 0.72<br />
Mode share for all trips<br />
<strong>Car</strong> 6% 20% 28%<br />
Public transit 14% 18% 18%<br />
Bicycle 50% 32% 29%<br />
Walking 30% 30% 25%<br />
City of Amsterdam;<br />
<strong>ITDP</strong> Europe, 2010
GWL Terrein 27<br />
Development Management and Governance<br />
The umbrella organization Koepelvereniging was created in 1996 to<br />
promote the original intentions of the development and to encourage<br />
community cohesion. The organization is funded through<br />
small fees from residents and the housing associations. Today<br />
Koepelvereniging is the one body that unifies the entire development.<br />
The organization has a website and a newsletter for residents<br />
and holds about six meetings per year to discuss community issues<br />
such as safety, maintenance and community events. The organization<br />
also employs a concierge, who is available on-site to answer<br />
questions from residents, performs minor repairs and enforces the<br />
car-free restriction (including keeping delivery vehicles from entering<br />
the development). Residents are very involved in the organization<br />
and help to plan community events, such as an annual soccer tournament<br />
held each June, followed by a community dinner (GWL Terrein<br />
Website). These efforts help to give residents a sense of community<br />
and enhanced focus on the environmental goals of the development.<br />
<strong>Car</strong>-free Declaration<br />
Initial proponents of the development had hoped to actually ban<br />
car ownership among residents, but this was not allowed. As an<br />
alternative, Ecoplan asked the initial residents of GWL Terrein to sign<br />
a non-obligatory declaration of support for the car-free nature of the<br />
site. This declaration did not require residents to live car-free, but<br />
informed them of the intention of the development. The declaration<br />
reminded residents that GWL Terrein is different from other neighborhoods.<br />
Parking in the area is difficult for a reason and sustainable<br />
forms of transportation are encouraged. Furthermore, the declaration<br />
attempted to provide residents with an enhanced feeling of community<br />
and the idea that they were involved in a unique experiment<br />
in sustainable living. However, new residents no longer go through<br />
Ecoplan. <strong>New</strong> renters are selected either by one of the five housing<br />
associations, which typically do not require a car-free declaration to<br />
be signed, or by current owners, who may freely sell their property<br />
to anyone they choose. For this reason, the umbrella organization<br />
Koepelvereniging has developed a document for new residents,<br />
explaining the goals and concepts of the project. The organization<br />
also provides advice related to sustainability and car-free living.<br />
Therefore, while new residents are no longer asked to state that they<br />
agree with the ideals of the project, they are still made aware of the<br />
project’s original intentions.<br />
quantitative analysis<br />
GWL Terrein is located in one of the world’s leading cycling cities.<br />
The City of Amsterdam has implemented many policies to encourage<br />
cycling and walking and to reduce car use such as improved bicycle<br />
infrastructure, extensive bicycle parking facilities, robust police<br />
enforcement to prevent bicycle theft, increased bicycle use education<br />
to increase bicycle safety, reduced speed limits to improve safety and<br />
increased parking prices to reduce car use (Daniel van Motman, pers.<br />
comm.). However, efforts at GWL Terrein go even further. GWL Terrein<br />
residents have a 50% bicycle mode share, compared with the already<br />
high 30% in the rest of the city, further reducing the car<strong>bon</strong> footprint<br />
of residents. A comparison of statistics for GWL Terrein, Amsterdam<br />
West and the city of Amsterdam can be seen in Table 2.<br />
Density<br />
GWL Terrein is about three times as dense as Amsterdam West,<br />
the district in which it is located, and more than five times as dense<br />
as the city of Amsterdam. It is even more dense than what is required<br />
for new growth, or Vinex, locations in the Netherlands (see Vinex<br />
Locations sidebar, p. 50). Vinex locations are required to have at<br />
least 30 homes per hectare, while GWL Terrein has 100 homes per<br />
hectare. Higher densities enable more efficient use of resources,<br />
which can contribute to reductions in car<strong>bon</strong> footprint.<br />
Parking<br />
Parking at GWL Terrein is extremely limited with only 0.20 spaces per<br />
residential unit, compared to the already low 0,72 spaces in the rest<br />
of the city. Reducing the availability of parking spaces contributes to<br />
reduced car ownership rate.<br />
Figure 2: Mode of travel for residents as compared to surrounding area<br />
100%<br />
80%<br />
car<br />
public transport<br />
bicycle<br />
percent of trips<br />
60%<br />
40%<br />
walking<br />
walk/cycle<br />
20%<br />
0%<br />
GWL Terrein<br />
(2001)<br />
GWL Terrein<br />
(2010)<br />
Amsterdam<br />
West<br />
(2000)<br />
Amsterdam<br />
West<br />
(2008)<br />
Amsterdam<br />
(2000)<br />
Amsterdam<br />
(2008)<br />
City of Amsterdam,<br />
<strong>ITDP</strong> Europe, 2010;<br />
Scheurer, 2001
28 Europe’s <strong>Vibrant</strong> <strong>New</strong> <strong>Low</strong> <strong>Car</strong>(<strong>bon</strong>) <strong>Communities</strong><br />
Figure 3: Mode of travel to work<br />
100%<br />
80%<br />
car<br />
public transport<br />
bicycle<br />
percent of residents<br />
60%<br />
40%<br />
walking<br />
20%<br />
0%<br />
GWL Terrein<br />
(2010)<br />
Amsterdam<br />
(2008)<br />
City of Amsterdam;<br />
<strong>ITDP</strong> Europe, 2010<br />
<strong>Car</strong> and Bicycle Ownership Rates<br />
In 2001 there were 172 cars per 1,000 residents in GWL Terrein<br />
(Scheurer 2001). A more recent, internet-based survey of GWL<br />
Terrein residents conducted by <strong>ITDP</strong> Europe in 2010 found that this<br />
number is slightly higher today at 190 cars per 1,000 residents (<strong>ITDP</strong><br />
Europe 2010), still far less than the 310 cars per 1,000 residents in<br />
Amsterdam West and about half of the 370 cars per 1,000 residents<br />
of Amsterdam (City of Amsterdam). Furthermore, 15% of households<br />
surveyed gave up a car after moving to GWL Terrein. The number of<br />
bicycles owned per resident has not changed significantly. The 2001<br />
survey found 1,346 bicycles per 1,000 residents, while the current<br />
survey found 1,300 bicycles per 1,000 residents. Indeed, nearly half<br />
of all respondents said that there were more than three bicycles<br />
owned by their household, and only 2% of respondents said that<br />
their household had no bikes (<strong>ITDP</strong> Europe 2010).<br />
Mode Split<br />
These policy and design measures have worked. The survey found<br />
that half of all trips taken by GWL Terrein residents are made by<br />
bike and 30% are made on foot, while only 6% are made by car<br />
(Figure 2). The share of bike trips in GWL Terrein (50%) is much<br />
higher than that for Amsterdam West (32%) and Amsterdam (29%).<br />
Furthermore, a far smaller share of trips are made by car in GWL<br />
Terrein (6%) than in West Amsterdam (20%) or Amsterdam (28%).<br />
The total share of non-motorized trips has increased slightly in<br />
Amsterdam West between 2000 and 2008 (from 59% to 62%).<br />
The share of non-motorized trips has not changed in the city of<br />
Amsterdam (54%) during the same time span, however 4% of trips<br />
have shifted from walking to cycling. By contrast, the share of nonmotorized<br />
trips in GWL Terrein has increased 7% between 2001 and<br />
2010 (from 73% to 80%).<br />
It is also interesting to compare the mode split for different<br />
types of trips. In GWL Terrein 63% of residents travel to work by bike<br />
versus 32% for Amsterdam (Figure 3). Likewise, a smaller percent<br />
of GWL Terrein residents travel to work by car (9%) than Amsterdam<br />
residents (33%). 94% of GWL Terrein survey respondents said that<br />
they do their grocery shopping by bike, 85% conduct other shopping<br />
by bike, 93% run service-related errands (banking, doctor visits, etc.)<br />
by bike and 94% visit family and friends in Amsterdam by bike (<strong>ITDP</strong><br />
Europe 2010). These statistics overwhelmingly show that cycling is<br />
the main mode of transport for residents of GWL Terrein.<br />
While the mode share of public transportation is no higher<br />
among GWL Terrein residents than Amsterdam residents, GWL Terrein<br />
residents still consider it an important option and most residents use<br />
public transit at least once per week. In 2001 it was found that 39% of<br />
residents had some sort of periodic public transit pass, although the<br />
type of pass varied (Scheurer 2001). The 2010 survey found that this<br />
number had increased to 46% of residents (<strong>ITDP</strong> Europe 2010). This<br />
is even higher than for the city of Amsterdam, where 19% of residents<br />
have a periodic transit pass (City of Amsterdam).<br />
Reduced travel distances also contribute to reduced car<strong>bon</strong><br />
footprint. GWL’s location gives residents easy access to the city<br />
center, where many jobs are located. Indeed, 44% of residents travel<br />
less than 5 kilometers to work, and only 12% travel 40 kilometers<br />
or more. Additionally, more than three-fourths of residents travel<br />
less than one kilometer to get to their grocery store (<strong>ITDP</strong> Europe<br />
2010). Having close access to destinations such as work and grocery<br />
stores encourages travel by bike and walking and reduces kilometers<br />
driven. Therefore, it is not surprising that transport-related emissions<br />
of GWL Terrein residents are less than half that of an average<br />
Amsterdam resident and one-third that of an average resident of<br />
the Netherlands, as seen in Figure 4. These estimates are based on<br />
annual kilometers traveled by residents by private and public transportation<br />
(for the year indicated), as well as estimates of emissions<br />
rates of these vehicles.<br />
lessons learned<br />
The GWL Terrein development includes many features that make it<br />
unique among neighborhoods in Amsterdam and encourage sustainable<br />
living. The context of the surrounding area and city also have a<br />
strong impact on the travel behavior of its residents. The extensive
GWL Terrein 29<br />
Figure 4: Average transport-related emissions of residents<br />
annual transport-related<br />
emissions per resident (kg CO2)<br />
1500<br />
1200<br />
900<br />
600<br />
300<br />
358<br />
899<br />
1311<br />
0<br />
GWL Terrein<br />
(2010)<br />
Amsterdam<br />
(2008)<br />
Netherlands<br />
(2007)<br />
Author’s<br />
elaboration<br />
Figure 5: Importance of various factors on GWL resident decision not to own a car<br />
bike makes car superfluous<br />
public transit makes car superfluous<br />
environmental reasons<br />
healthier lifestyle<br />
too expensive<br />
difficult to find parking near residence<br />
1 2 3 4<br />
not important<br />
very important<br />
<strong>ITDP</strong> Europe, 2010<br />
network of bicycle paths and efficient public transportation system<br />
in the city of Amsterdam allow residents of GWL Terrein to easily<br />
travel to other parts of the city using these modes. When non-carowners<br />
were asked to rank the importance of different factors in their<br />
decision not to own a car, residents gave higher importance ratings<br />
to pull measures such as ease of bicycle and public transport use<br />
and lower importance ratings to push measures such as expense of<br />
owning a car and limited parking (see Figure 5). Also, GWL Terrein’s<br />
location close to the city center has an effect on travel distances<br />
of residents. Therefore, it would appear that a new development<br />
project in a city with a focus on sustainable transportation, especially<br />
located near the center of the city, could have more potential for success<br />
than one located in a car-focused city or far from the city center.<br />
Furthermore, Koepelvereniging, the residents’ umbrella<br />
organization, seems to be an important catalyst for maintaining<br />
resident focus on sustainability, reduced car use and social<br />
interaction. It also gives residents a common source to turn to with<br />
questions or concerns about the development. Such an organization<br />
is recommended for other sites planning to implement a<br />
sustainability-focused community.<br />
sources<br />
Communication with Corine Marseille,<br />
Koepelvereniging organization, May 2010.<br />
Communication with Daniel van Motman,<br />
Department of Traffic Infrastructure and<br />
Transport, City of Amsterdam, May 2010.<br />
Communication with Hans Niepoth, City of<br />
Amsterdam, June 2010.<br />
GVB Website, http://www.gvb.nl (accessed<br />
June 10, 2010).<br />
GWL Terrein Website, http://www.gwl-terrein.<br />
nl/?english (accessed June 10, 2010).<br />
<strong>ITDP</strong> Europe (2010). Interned-based survey of GWL<br />
Terrein residents.<br />
QPark Website, http://www.q-park.nl/tabid/657/<br />
qparkParkingLocatorvw1094/parkingDetail/<br />
ParkingID/613/language/nl-NL/Default.aspx<br />
(accessed June 10, 2010)<br />
Scheurer, Jan (2001). Urban Ecology, Innovations in<br />
Housing Policy and the Future of Cities: Towards<br />
Sustainability in Neighbourhood <strong>Communities</strong>,<br />
Thesis: Murdoch University, Perth Western,<br />
Australia.<br />
Image credits<br />
Figure 1: Koepelvereniging<br />
Photo 1: Koepelvereniging<br />
Photo 2: Peter Elenbaas<br />
Photos 3, 5–10: Nicole Foletta, <strong>ITDP</strong> Europe<br />
Photo 4: Giesbert Nijhuis
hammarby sjöstad site facts<br />
Developer: Multiple *<br />
Architect: Jan Inghe-Hagström #<br />
Population: 17,000<br />
Projected Population: 24,000<br />
Developed Area: 130 ha<br />
Total Area: 160 ha<br />
Current Density: 131 persons/ha<br />
Projected Density: 150 persons/ha<br />
Current Residential Units: 8,000<br />
Projected Residential Units: 11,000<br />
Construction Began: 1999<br />
Planned Completion: 2017<br />
Distance from City Center: 3 km<br />
<strong>Car</strong>s: 210 cars/1,000 residents<br />
Parking Spaces/Residence: 0.65<br />
Non-motorized Mode Share: 27%<br />
Public Transport Mode Share: 52%<br />
Households with <strong>Car</strong>sharing: 18%<br />
* Over 30 developers; key developers are JM,<br />
Skanska, Family Housing, Swedish Housing,<br />
HSB, SKB and Borätt.<br />
# Jan Inghe-Hagström designed the strategic<br />
masterplan. Other architecture firms involved<br />
include: White Architects, Nyréns Architect Firm,<br />
and Erséus.
case study<br />
Hammarby<br />
Sjöstad<br />
stockholm, sweden<br />
Nicole Foletta, <strong>ITDP</strong> Europe
32 Europe’s <strong>Vibrant</strong> <strong>New</strong> <strong>Low</strong> <strong>Car</strong>(<strong>bon</strong>) <strong>Communities</strong><br />
background<br />
Hammarby Sjöstad is a brownfield redevelopment with mixed<br />
uses, carsharing, bikesharing, good transit access and high quality<br />
bicycle infrastructure. <strong>Car</strong> use and transport-related emissions<br />
are lower in the development than in comparable reference districts<br />
or the city as a whole.<br />
Hammarby Sjöstad is recognized around the globe for having<br />
implemented an integrated approach to district planning incorporating<br />
sustainable resource use, ecological design and low-car<strong>bon</strong><br />
transport. The 160 hectare district was built on a former industrial<br />
and harbor brownfield area located on the south side of Hammarby<br />
Lake, three kilometers south of the Stockholm city center (Photos 1<br />
and 2). The redevelopment has its roots in Stockholm’s bid to host<br />
the 2004 Olympics. Hammarby Sjöstad was meant to be part of an<br />
ecological Olympic Village. Although Stockholm did not win the<br />
bid, planning moved forward and construction of the project began<br />
in 1999, converting the site from a run-down industrial area into a<br />
modern, environ mentally sustainable, mixed-use district with good<br />
public transit connections. So far, 130 of the total 160 hectares have<br />
been devel oped including 8,000 residential units that now house<br />
some 17,000 residents. By 2017 the City anticipates the development<br />
will be complete with 11,000 residential units and 24,000 inhabitants<br />
(City of Stockholm Website).<br />
Hammarby Sjöstad’s success can be attributed to strong environmental<br />
goals that shaped the development plan, incorporating land<br />
use, transportation, building materials, energy, water and sewage,<br />
and solid waste. All of the authorities and administrations normally<br />
involved in the development process collaborated to create a plan<br />
and conceptual approach to the project with a focus on sustainable<br />
resource use. The implementation of a holistic environmental profile<br />
for a whole district was a new concept when plans began in 1996.<br />
The city imposed strict environmental requirements on buildings,<br />
technical installations and the traffic environment. The goal was to<br />
halve the environmental impact compared to a typical development<br />
built in the 1990’s. The goals related to transportation in Hammarby<br />
Sjöstad were (Fränne 2007):<br />
··<br />
80% of residents’ and workers’ journeys made by public<br />
transport, bike or foot by 2010<br />
··<br />
At least 15% of households having carsharing memberships<br />
by 2010<br />
··<br />
At least 5% of workplaces having carsharing memberships<br />
by 2010<br />
··<br />
100% of heavy transportation by vehicles meeting environmental<br />
zone requirements<br />
planning process<br />
The planning and design of this project was made easier because the<br />
City had acquired most of the land in Hammarby Sjöstad. The local<br />
authority took leadership at every stage from development of the<br />
masterplan to construction, spurred on by the City’s sustainability<br />
program which includes targets for decontamination, use of brownfield<br />
land, provision of public transport options in order to discourage<br />
car use, energy consumption, water conservation and recycling. In<br />
addition, since all planning applications in Stockholm are based on<br />
life-cycle cost analysis, it was easier for the development to justify<br />
higher initial investments in better performing building design and<br />
transportation infrastructure.<br />
The first step in the planning process was the development of<br />
the strategic masterplan, led by architect Jan Inghe-Hagström, at<br />
the Stockholm City Planning Bureau. The plan is divided into 12 subneighborhoods,<br />
which are being developed in phases. A process called<br />
“parallel sketches” is being used in which the City selects three to four<br />
architects/planners in the private sector to draw up detailed proposals<br />
Multimodal<br />
Transit<br />
Station<br />
Ferry<br />
Terminal<br />
Tram & Bus<br />
Bikesharing<br />
<strong>Car</strong>sharing<br />
On-road<br />
Bicycle<br />
Segregated<br />
Bicycle Path<br />
Tram Route<br />
Pedestrian<br />
Figure 1: Map of Hammarby Sjöstad
Hammarby Sjöstad 33<br />
for a sub-neighborhood. The city evaluates each of the sketches and<br />
combines the best features to create the agreed upon masterplan.<br />
The city planning and design team then prepares a design code<br />
for each sub-neighborhood in partnership with the developers and<br />
architects. This design code is included in the development agreement<br />
between the developer and the City. The design code is taken<br />
through the local authority political process in order to grant planning<br />
permission; the code provides an overview of the layout, form,<br />
and structure of each block including key landmark buildings, public<br />
spaces and pedestrian routes.<br />
In order to provide architectural diversity, and to inspire higher<br />
standards of design through competition, a consortium of developers<br />
and architects are then invited by the City to develop each plot or individual<br />
building within the sub-neighborhood, according to the design<br />
code. So far over 30 different developers and more than 30 architects<br />
have been identified. Key developers are JM, Skanska, Family<br />
Housing, Swedish Housing, HSB, SKB and Borätt (CABE Website).<br />
key policy and design measures<br />
The integration of transportation and land use planning was<br />
recognized as a key component affecting the sustainability of<br />
the project. Expansion of the district has been complemented by<br />
transport investments including increased bus service, cycle paths,<br />
pedestrian bridges, ferry service, and an extension of the tram line.<br />
Development has been focused on a dense settlement structure,<br />
concentrated along main transit corridors. In order to discourage car<br />
use, parking in the area is limited and is priced. Key policy and design<br />
strategies applied are described below.<br />
Substantial investments were made in public transport in the<br />
area, including an extension of the Tvärbanan tram line (Line 22),<br />
which runs through Hammarby Sjöstad with four stops in the district<br />
(see Figure 1 and Photo 3). The line operates from 5:30am to 1:00am.<br />
This orbital line incorporates several features which enhance quality<br />
of service, including level-boarding at stations (Photo 4), which<br />
allows easier access to the trains, and message boards providing<br />
real-time arrival information of the next trains. In addition to the tram<br />
line, two bus routes serve the area.<br />
The tram line serves a whopping one third of all trips made by<br />
residents (Brick 2008). Figure 2 shows a dramatic growth in ridership<br />
on the Tvärbanan line after the introduction of the central Stockholm<br />
congestion charge in 2006. Hammarby Sjöstad lies just outside of<br />
the central Stockholm congestion zone. This increase in ridership<br />
demonstrates the effectiveness of combining push (congestion pricing)<br />
and pull (improved transit) methods to shift travelers from cars<br />
to more sustainable modes.<br />
The Gullmarsplan Tunnelbanan (metro) station lies just outside<br />
the border of Hammarby Sjöstad. This station serves the T17, T18 and<br />
T19 (metro) lines and provides direct service to central Stockholm at<br />
7-8 minute frequencies during peak hours. The station also serves<br />
as a multi-modal transfer facility with connections to the Tvärbanan<br />
tram line and numerous bus lines.<br />
In addition to providing convenient access, fare structure can also<br />
help drive public transport use. Public transport tickets in Stockholm<br />
County are integrated and zone-based. The same ticket can be used<br />
on the bus, tram or metro, improving ease of transfers. Several ticket<br />
options are offered from single tickets to annual travelcards, all with<br />
both regular and reduced prices. An integrated smartcard called SL<br />
Access has recently been implemented. Transit tickets and passes<br />
can be loaded onto this smartcard. An SL Business <strong>Car</strong>d is also<br />
available for employees of participating companies. Through this<br />
program, the employee is given a travelcard at a discounted price,<br />
and the cost is deducted from his salary; the employer pays social<br />
security contributions. This is a way for companies to encourage<br />
employees to use public transport. Another feature aimed to improve<br />
ease of ticket purchase is an innovative option which allows passengers<br />
to purchase a transit ticket through a text message on a cell<br />
phone. The ticket will appear on the cell phone screen and must be<br />
shown to the bus operator upon boarding (SL Website).<br />
A ferry service was introduced which transports passengers<br />
from Hammarby Sjöstad to the Stockholm city center and to<br />
Figure 2: Ridership on the Tvärbanan line (tram)<br />
60,000<br />
50,000<br />
passengers per day<br />
40,000<br />
30,000<br />
2006:<br />
Stockholm congestion<br />
charging begins<br />
20,000<br />
2003 2004 2005 2006 2007 2008 2009<br />
* data recorded each year on an average winter day<br />
year<br />
Blomquist, 2010
34 Europe’s <strong>Vibrant</strong> <strong>New</strong> <strong>Low</strong> <strong>Car</strong>(<strong>bon</strong>) <strong>Communities</strong><br />
Sodermalm, an island located between Hammarby Sjöstad and the<br />
city center (Photo 5). More information about these two ferry lines is<br />
summarized in Table 1. Ferry service is run by the city of Stockholm.<br />
Bicycles can be taken on board all ferries and ferry terminals are<br />
located near bicycle lanes, providing an easy transition between<br />
bike and ferry. Studies have suggested that introduction of the ferry<br />
service has contributed to an increase in the use of bicycles and<br />
walking to/from Hammarby Sjöstad and that as much as 24% of<br />
travelers use the ferry for some portion of their trip (Brick 2008).<br />
Cycling and Pedestrian Infrastructure<br />
One goal was for Hammarby Sjöstad to be a healthy place for people<br />
to live; that offers opportunities for exercise, sports and culture.<br />
Numerous bike paths, pedestrian paths and footbridges (Photos 6, 7,<br />
8 and 9; Figure 1) were built to meet this goal. Many of the paths<br />
provide an opportunity for scenic strolls along picturesque canals<br />
and through a variety of green spaces. The bicycle lanes also enable<br />
improved mobility, running along thoroughfares such as Lugnets Allé<br />
and Hammarby Allé . Providing safe, accessible bicycle and pedestrian<br />
infrastructure is important to both encourage healthy activities,<br />
but also to promote use of non-motorized forms of transport.<br />
Bike Sharing<br />
Bike sharing programs are being implemented around the world<br />
to make cycling in cities more accessible. These systems are often<br />
complemented by investments in bicycle infrastructure, providing<br />
safe spaces for users to ride. The bikesharing concept consists of<br />
providing public bicycles, available from docking stations spread<br />
throughout the city, for the purpose of travel.<br />
The bikesharing program in Stockholm, called Stockholm<br />
City Bikes, began in 2006 and is operated by Clear Channel<br />
Communications. The company holds similar bikesharing programs<br />
in France (Rennes, Caen, Dijon and Perpignan) as well as in<br />
Barcelona, Oslo and Milan.<br />
There currently 85 docking stations citywide, and one in<br />
Hammarby Sjöstad (Photo 10). At each station, spaces for 9 to<br />
24 bicycles are available. The actual number of bikes available<br />
at any time depends on the number currently in use and the<br />
bicycle distribution patterns of users. Once the program is fully<br />
implemented, there will be 2,500 bicycles at 200 locations<br />
throughout Stockholm.<br />
Bike share in Stockholm operates from April to October. Bikes<br />
may be picked up between 6:00am and 10:00pm, users can take<br />
the bike for up to three hours, after which they must pay a penalty.<br />
A membership and rental card are required for use. Two types of<br />
cards are available. A seasonal card may be purchased online for 200<br />
sek (21€) or at a retailer for 250 sek (26€). A three-day card must be<br />
purchased at a retailer and costs 125 sek (13€) (City of Stockholm).<br />
There is now an option to add a Stockholm City Bike membership<br />
to an SL Access smartcard.<br />
<strong>Car</strong> Sharing<br />
There are currently 37 low emissions carsharing cars with dedicated<br />
parking spaces located in Hammarby Sjöstad, belonging to three<br />
different car sharing organizations: Sunfleet <strong>Car</strong>sharing, Bilpoolen,<br />
and City<strong>Car</strong>Club. According to a survey of residents in 2010, 18% of<br />
households have a carsharing membership (<strong>ITDP</strong> Europe 2010). In<br />
2008, 100 companies located in Hammarby Sjöstad were reported as<br />
having a car sharing membership (City of Stockholm Website).<br />
Parking<br />
Hammarby Sjöstad has approximately 0.15 on-street parking spaces<br />
per household, and an estimated 0.55 spaces per household in<br />
public or private garages. The supply of parking is not evenly spread<br />
and in some parts of the district the practical parking supply will<br />
be much lower. Overall Hammarby Sjöstad has 0.65 parking spaces<br />
per household.<br />
On-street parking in Hammarby Sjöstad is regulated in the<br />
same way as for the rest of the inner city. There is a charge to park<br />
between 9:00am and 5:00pm on weekdays (Photo 11). Evening and<br />
night time parking is free. Off-street parking is mainly operated by<br />
Stockholm Parkering, the city’s parking company, which owns a<br />
Table 1: Summary of Hammarby Sjöstad ferry service<br />
Ferry<br />
destination<br />
Travel time<br />
to destination<br />
Frequency<br />
Operating<br />
months<br />
Hours of operation<br />
Cost<br />
Sodermalm 5 minutes 10 – 15<br />
minutes<br />
Year round 06:00 to midnight Free<br />
Nybroviken<br />
(Central<br />
Stockholm)<br />
25 minutes 1 hour May 31 –<br />
October 1<br />
Weekdays: 07:30 – 17:30<br />
Weekends: 09:30 – 18:30<br />
Regular fare: 40 sek (4.3 €)<br />
Discount fare: 25 sek (2.7 €)<br />
Children under 13: free<br />
http://www.ressel.<br />
se/index.asp<br />
Table 2: Parking prices in Hammarby Sjöstad<br />
Time period On-street parking Off-street outdoor parking Off-street garage parking<br />
Per hour 15 sek (1.5 €) 12-15 sek (1.2-1.5 €) 20 sek (2 €)<br />
Per day (24hr) 50 sek (5 €) * 60-80 sek (6-8 €) 100 sek (10 €)<br />
Overnight — — 60 sek (6 €)<br />
Monthly 700 sek (73 €) * 750 sek (78 €) 1,100 – 1,500 sek (110 – 160 €)<br />
Yearly 8,400 v (870 €) * 9,000 sek (940 €) 13,200 – 18,000 sek<br />
(1,370 – 1,870 €)<br />
* with residential parking permit<br />
City of Stockholm,<br />
Traffic Administration
Hammarby Sjöstad 35<br />
number of garages and off-street parking lots in Hammarby Sjöstad.<br />
Additionally, a number of the housing co-operatives own their own<br />
parking and set their own prices for residents and there are also a<br />
few private car park operators. Table 2 shows the parking prices for<br />
Stockholm Parkering. The prices for off-street parking are comparable<br />
to other areas just outside the inner city, but a little lower than typical<br />
prices inside the inner city. Typically charging more for on-street<br />
parking spaces than for off-street spaces encourages long-term<br />
parkers to park off-street and maintains a larger number of on-street<br />
spaces available for short-term parkers, who have a faster turnover.<br />
Hammarby Sjöstad’s parking pricing structure does not follow<br />
this strategy and it is recommended to raise on-street parking prices.<br />
Urban Design<br />
The layout of Hammarby Sjöstad was designed to integrate transportation,<br />
amenities and public spaces. The spine of the district is a<br />
37.5 meter wide boulevard and transit corridor, which connects key<br />
transport nodes and public focal points, and creates a natural focus<br />
for activity and commerce (Figure 3).<br />
Street Layout and Design<br />
Two main thoroughfares, Lugnets Allé and Hammarby Allé, run<br />
through the district. These streets include tram lines in the middle<br />
of the street with boarding platforms on the outside. Beyond the<br />
boarding platforms there is one car lane in each direction and outside<br />
the car lanes are bicycle lanes followed by parking spaces and then<br />
pedestrian walkways. The bike lanes are painted on the street and<br />
cars must pass over the bike lane in order to park. Pedestrian priority<br />
is given on the main streets, complemented by speed restrictions<br />
and frequent zebra crossings. A cross section view demonstrating the<br />
layout of Hammarby Allé can be seen in Photo 12.<br />
Public Space Design<br />
A network of varied parks, green spaces, quays, plazas and walkways<br />
runs through the district, providing space for outdoor activities. All<br />
public spaces are owned and maintained by the city of Stockholm<br />
Photo 13).The initial goal for the development was to provide 25<br />
square meters of public green space per apartment unit, for a total<br />
of 300,000 square meters in the district. So far a total of 280,000<br />
square meters has been completed. The development also has a goal<br />
to provide 15 square meters of private courtyard space per apartment<br />
unit. (City of Stockholm Website)<br />
Land Use Planning and Design<br />
The general building layout of Hammarby Sjöstad is blocks built<br />
around an inner courtyard. The entire development is high density, but<br />
with the highest densities focused along the transit corridor, where<br />
buildings are 7-8 stories high. The average height of buildings in the<br />
district is 18 meters, or 6 stories. Safety on the streets is enhanced<br />
by providing a variety of ground floor uses, and facing balconies and<br />
front doors onto the street in order to increase “eyes on the street.”<br />
The architectural style utilizes contemporary sustainability technologies<br />
and follows modern architectural principles, maximizing use of<br />
daylight and providing views of water and green spaces.<br />
Figure 3: Hammarby Sjöstad Site Map
36 Europe’s <strong>Vibrant</strong> <strong>New</strong> <strong>Low</strong> <strong>Car</strong>(<strong>bon</strong>) <strong>Communities</strong><br />
1<br />
Hammarby<br />
Sjöstad before<br />
redevelopment<br />
2<br />
Hammarby<br />
Sjöstad today
Hammarby Sjöstad 37<br />
3<br />
Tvarbanan line<br />
tram stop<br />
The tram line was<br />
extended to serve<br />
Hammarby Sjöstad<br />
and now carries 33%<br />
of trips made by<br />
residents there.<br />
4<br />
Level boarding<br />
on Tvarbanan<br />
tram<br />
Level boarding is<br />
one example of<br />
the high-quality<br />
features of the tram<br />
system, which also<br />
include long hours of<br />
service and real-time<br />
arrival information<br />
in stations and<br />
connections to Metro<br />
and bus lines.<br />
5<br />
Ferry terminal<br />
Ferries connect<br />
residents to the<br />
city center. Bikes<br />
are allowed onboard<br />
and the ferry<br />
terminal is reachable<br />
by bikeways.
38 Europe’s <strong>Vibrant</strong> <strong>New</strong> <strong>Low</strong> <strong>Car</strong>(<strong>bon</strong>) <strong>Communities</strong><br />
6<br />
Pedestrian<br />
pathways<br />
7<br />
One of<br />
Hammarby<br />
Sjöstad’s<br />
many bicycle<br />
and pedestrian<br />
bridges
Hammarby Sjöstad 39<br />
8<br />
Canal-side<br />
bicycle path<br />
9<br />
Bicycle path<br />
separated from<br />
motorized<br />
traffic
40 Europe’s <strong>Vibrant</strong> <strong>New</strong> <strong>Low</strong> <strong>Car</strong>(<strong>bon</strong>) <strong>Communities</strong><br />
10<br />
One of Stockholm’s<br />
85 bikeshare<br />
stations is located in<br />
Hammarby Sjöstad.<br />
11<br />
Hammarby Sjöstad<br />
has .15 on-street<br />
parking spaces per<br />
household, parking<br />
is charged during the<br />
day and free at night.<br />
12<br />
Hammarby Allë,<br />
one of Hammarby<br />
Sjöstad’s two main<br />
thoroughfares, with<br />
center-running tram<br />
lines, driving lanes,<br />
bike lanes, parking<br />
and sidewalks.<br />
Pedestrians have<br />
priority.
Hammarby Sjöstad 41<br />
13<br />
plaza in<br />
Hammarby<br />
Sjöstad<br />
A network of parks,<br />
green spaces, quays<br />
and walkways runs<br />
throughout the<br />
development.<br />
14<br />
Hammarby<br />
Sjöstad café<br />
Hammarby Sjöstad<br />
has over 100 retail<br />
units and restaurants<br />
as well as office<br />
space and some<br />
light industrial uses,<br />
employing over<br />
5,000 people and<br />
providing convenient<br />
services for local<br />
residents.
42 Europe’s <strong>Vibrant</strong> <strong>New</strong> <strong>Low</strong> <strong>Car</strong>(<strong>bon</strong>) <strong>Communities</strong><br />
stockholm disability program<br />
In 2004, the Stockholm Local Council adopted the<br />
Disability Policy Program whose aim was to make<br />
Stockholm the most accessible city in the world<br />
by 2010. To reach this goal, the document enlists a<br />
series of wide scale measures to be undertaken. In<br />
the transportation sector, the program recommends<br />
removing all physical barriers that can easily be<br />
removed. This includes widening doorways and<br />
installing handrails in public transport stations and<br />
providing level boarding of transit vehicles. The<br />
program also stipulates that all public authorities<br />
and private companies need to integrate financing<br />
of these measures into their budgets. The goal is<br />
to provide better access to disabled persons and,<br />
consequently, enhance democracy and social equity<br />
among all Stockholmers. Due to its goal of becoming<br />
an exemplary district for the future, Hammarby<br />
Sjöstad has paid special attention to satisfying<br />
these requirements (City of Stockholm 2005).<br />
The residential units include a mix of tenures; 46% of the units are<br />
rented and 54% are owned. Most of the apartment units have one or<br />
two bedrooms, as seen in Table 3. In addition, the development has<br />
59 apartments with 24-hour care for the elderly, 30 apartment units<br />
where assisted residential care is provided and 400 student flats.<br />
The planning department recognized the importance of providing<br />
a mix of uses in order to ensure that residents have access to goods<br />
and services within walking distance. Therefore, the city initially<br />
offered a two-year rent-free subsidy in order to attract commercial<br />
operators and to ensure that service provision was established<br />
during the early phases of the development (CABE Website). This<br />
strategy was successful and today the area includes nearly 100 retail<br />
units and restaurants as well as office space and light industrial<br />
uses, employing over 5,000 people (Photo 14). In addition, at least<br />
five food stores are located throughout the development and no<br />
one lives more than one kilometer from a grocery store. The mix<br />
of uses in Hammarby Sjöstad includes the following institutional<br />
uses: twelve pre-schools (for ages 1–5), three primary schools (for<br />
ages 6–16), two high schools, a library, a cultural center, a chapel,<br />
an environmental center, childcare facilities and healthcare centers.<br />
A breakdown of the area of the various land uses can be seen in<br />
Table 4. (City of Stockholm Website)<br />
quantitative comparison<br />
Table 3: Breakdown of residential unit size in Hammarby Sjöstad<br />
Area (ha)<br />
Studios 9%<br />
1 Bedroom 35%<br />
2 Bedrooms 32%<br />
3 Bedrooms 21%<br />
4 Bedrooms 2%<br />
5+ Bedrooms < 1%<br />
Table 4: Planned breakdown of land uses in Hammarby Sjöstad<br />
Area (ha)<br />
Percent of<br />
Total Area<br />
Residential 90 56%<br />
Public green space 30 19%<br />
Other 40 25%<br />
Total land area 160 100%<br />
City of Stockholm<br />
City of Stockholm<br />
In order to quantify the benefits of the sustainability measures<br />
implemented in Hammarby Sjöstad, it is important to look at the<br />
development in the context of its location. Hammarby Sjöstad<br />
is located in one of the most progressive cities in the world with<br />
regard to sustainability. Stockholm is the winner of the European<br />
Green Capital city competition for 2010. The city has reduced car<strong>bon</strong><br />
emissions by 25% per resident since 1990 and has established<br />
a target of reducing emissions from today’s 4 tonnes of CO 2 per<br />
capita to 3 tonnes in 2015. These values are extremely low for<br />
developed countries, considering the entire country of Sweden has<br />
an average emission rate of 6 tonnes of CO 2 per capita, the average<br />
for Europe is 8 tonnes per capita and the average for the United<br />
States is 20 tonnes per capita (EIA).<br />
The City of Stockholm has recognized the connection between<br />
land use planning and transport and has taken many measures to<br />
steer development in the direction of a dense settlement structure,<br />
complemented by investments in public transportation, cycling and<br />
pedestrian infrastructure. Furthermore, the city has successfully<br />
implemented a city-center congestion charge.<br />
Density<br />
Hammarby Sjöstad compares favorably with Stockholm, which<br />
stacks up extremely favorably against most of the rest of the<br />
world. Compared to both the inner city of Stockholm and the City<br />
of Stockholm itself, Hammarby Sjöstad has a higher population<br />
density, as seen in Table 5. The provision of on-street parking is lower<br />
for Hammarby Sjöstad than for the city; however, the provision of<br />
off-street parking is higher, bringing the total to 0.65 spaces per<br />
residential unit for both Hammarby Sjöstad and the city as a whole.<br />
<strong>Car</strong> Ownership Rates<br />
We also compared Hammarby Sjöstad to the municipality of<br />
Sundbyberg, a five kilometers to the northwest of the Stockholm city
Hammarby Sjöstad 43<br />
Table 5: Hammarby Sjöstad as compared to nearby and surrounding areas<br />
Hammarby<br />
Sjöstad<br />
Sundbyberg<br />
Inner City<br />
Stockholm<br />
City of<br />
Stockholm<br />
Population 17,000 37,700 308,900 829,400<br />
Area (ha) 130 * 900 3,500 18,700<br />
Population density (persons/ha) 131 42 88 44<br />
Average income (sek/year) 356,000 272,000 na 293,000<br />
Jobs per resident 0.3 0.5 na na<br />
<strong>Car</strong>s per 1000 residents 210 295 na 370<br />
<strong>Car</strong> parking spaces/residential unit 0.65 na 0.65 0.65<br />
Mode share for all trips<br />
<strong>Car</strong> 21% 44% 17% 32%<br />
Public transit 52% 20% 36% 30%<br />
Bicycle/ walking 27% 36% 47% 38%<br />
* current developed area<br />
City of Stockholm;<br />
City of Sundbyberg;<br />
Blomquist, 2010);<br />
<strong>ITDP</strong> Europe, 2010<br />
Figure 4: Mode of travel for Hammarby Sjöstad compared to reference and surrounding areas<br />
100%<br />
80%<br />
car<br />
public transit<br />
walk/cycle<br />
percent of trips<br />
60%<br />
40%<br />
20%<br />
0%<br />
Hammarby<br />
Sjöstad<br />
(2007)<br />
Reference<br />
District<br />
(2007)<br />
Sundyberg<br />
(2006)<br />
Inner City<br />
Stockholm<br />
(2006)<br />
City of<br />
Stockholm<br />
(2006)<br />
Brick, 2008;<br />
Blomquist, 2010<br />
center which also has good public transit availability. <strong>Car</strong> ownership<br />
per resident is quite low in Sundbyberg (295 cars per 1,000<br />
residents) and is even lower in Hammarby Sjöstad (210 cars per<br />
1,000 residents). These values are both smaller than for the City of<br />
Stockholm (370 cars per 1,000 residents), which is already low by<br />
international standards in developed countries. These and other<br />
statistics are summarized in Table 5. In addition, bicycle ownership<br />
is quite high in Hammarby Sjöstad at 820 bikes per 1,000 residents<br />
(<strong>ITDP</strong> Europe 2010).<br />
Mode Split<br />
The policy and design measures employed in Hammarby Sjöstad<br />
have proven effective. Only 21% of trips made by Hammarby Sjöstad<br />
residents are by car, while 52% are by public transportation, and 27%<br />
by non-motorized modes. The percent of non-motorized trips (27%)<br />
is still not quite as high as for those in Sundbyberg (36%), Inner City<br />
Stockholm (47%), or the city as a whole (38%), as seen in Figure 4.<br />
This may be due to the high concentration of jobs in Sundbyberg<br />
and Inner Stockholm, making it possible for residents of these areas<br />
to cycle or walk to work nearby. However, compared to a reference<br />
district without integrated policy and design measures, Hammarby<br />
Sjöstad has a higher percent of trips made by bike (9%) and on foot<br />
(18%) than the reference district’s share of bike trips (7%) and walking<br />
trips (8%), as seen in Figure 5.<br />
In addition, Hammarby Sjöstad has a much higher share of trips<br />
made by public transit (52%) than Sundbyberg (20%), Inner City<br />
Stockholm (36%) or the city as a whole (30%). This demonstrates<br />
that although residents of Sundbyberg walk or bike for more trips<br />
than Hammarby Sjöstad residents, for motorized trips, residents of<br />
Hammarby Sjöstad choose public transit over the car for a far greater<br />
percentage of trips than Sundbyberg residents. The breakdown of<br />
mode split for the regions discussed can be seen in Figure 4. Figure 5
44 Europe’s <strong>Vibrant</strong> <strong>New</strong> <strong>Low</strong> <strong>Car</strong>(<strong>bon</strong>) <strong>Communities</strong><br />
Figure 5: Mode of travel (2007)<br />
100%<br />
80%<br />
car<br />
tvärbanan tram<br />
bus<br />
percent of residents<br />
60%<br />
40%<br />
bicycle<br />
walking<br />
20%<br />
0%<br />
Hammarby Sjöstad<br />
Reference District<br />
Brick, 2008<br />
Figure 6: Mode of travel to work for Hammarby Sjöstad residents<br />
shows a more detailed breakdown of mode split for Hammarby<br />
Sjöstad and a reference district. The Hammarby Sjöstad values are<br />
generated from surveys of residents. The reference district values are<br />
based on a previous overall study of comparable city districts, but<br />
have been adapted for Hammarby Sjöstad. (Brick 2008)<br />
Furthermore, an internet-based survey of Hammarby Sjöstad<br />
residents conducted by <strong>ITDP</strong> Europe in 2010 asked respondents<br />
what mode of transportation they take most often to get to work.<br />
It was found that 3% of respondents walk to work, 14% cycle, 78%<br />
take public transit and 5% drive, as seen in Figure 6. This shows that<br />
residents overwhelmingly prefer to take public transportation to<br />
work rather than driving. Stockholm’s congestion charge likely has<br />
an influence on this decision. In addition, the survey found that 39%<br />
of residents live less than 5 km from their place of work, 43% live<br />
between 5 and 10 km and 18% live more than 10 km from work. These<br />
short commute distances also make it easy to travel to work by nonmotorized<br />
modes or public transit. The average one-way commute<br />
time of residents was found to be 33 minutes. (<strong>ITDP</strong> Europe 2010)<br />
Transport-related Emissions<br />
The low car ownership rate, low car mode share and short commute<br />
distances help to reduce the car<strong>bon</strong> footprint of Hammarby Sjöstad<br />
residents. CO 2 emissions per apartment from personal transport<br />
by car are more than 50% lower in Hammarby Sjöstad than in the<br />
reference district, as seen in Figure 7. These savings alone would yield<br />
a reduction of approximately 2,373 tonnes of CO 2 per year (Brick 2008).<br />
Moreover, by measuring kilometers traveled per resident per<br />
year by both private and public transport, along with estimates of<br />
emission rates of vehicles, it is estimated that overall transportrelated<br />
emissions for residents of Hammarby Sjöstad are less than<br />
half that for an average Stockholm resident and less than a third that<br />
of an average resident of Sweden, as seen in Figure 8.<br />
The statistics presented in this section quantify some of the<br />
many benefits of integrated policy and design measures. These<br />
comparisons show that even in a city as ambitious as Stockholm,<br />
concentration of integrated policy and design measures in a single<br />
district can bring about further reductions in car<strong>bon</strong> footprint.<br />
Author’s elaboration<br />
metro<br />
29%<br />
car<br />
5%<br />
lessons learned<br />
tram<br />
23%<br />
(2007)<br />
walking<br />
3%<br />
bicycle<br />
14%<br />
bus<br />
26%<br />
A holistic approach to planning, grounded in strong environmental<br />
goals can help shape better new developments. These goals should<br />
be created as early as possible, making it possible to integrate<br />
them into every part of the infrastructure early in the planning<br />
process. These goals should be formed in close cooperation with all<br />
stakeholders and should include a discussion of possible technical<br />
solutions and their potential results within the planned district.<br />
Context is also important to new developments. In Stockholm<br />
the availability of high quality transport and a congestion charge<br />
has a strong influence on all residents, including those in this new<br />
development.<br />
Meeting environmental goals does not end once the development<br />
is built. The district plan should include information and incentives<br />
to influence the behavior of residents in the long term. Following<br />
this line of thought, new urban districts should design an evaluation<br />
process with a structure for follow-up with a clearly defined feedback<br />
process to ensure continued sustainability of the project.
Hammarby Sjöstad 45<br />
Figure 7: Average car emissions<br />
1200<br />
kg CO2 equivalents per<br />
apartment per year<br />
800<br />
400<br />
438<br />
913<br />
0<br />
Hammarby Sjöstad<br />
(2007)<br />
Reference District<br />
(2007)<br />
Brick, 2008<br />
Figure 8: Average transport-related emissions of residents<br />
1800<br />
annual transport-related<br />
emissions per resident (kg CO2)<br />
1200<br />
600<br />
402<br />
996<br />
1484<br />
0<br />
Hammarby Sjöstad<br />
(2010)<br />
Stockholm<br />
(2009)<br />
Sweden<br />
(2007)<br />
Author’s<br />
elaboration<br />
sources<br />
Blomquist, Anna (2010). Fakta om SL och Lanet<br />
2009. Stockholm, AB Storstockholms Lokaltrafik.<br />
Brick, Karolina (2008). Report Summary — Follow<br />
Up of Environmental Impact in Hammarby<br />
Sjöstad. Grontmij AB, Stockholm.<br />
CABE website, Hammarby Sjöstad Case Study,<br />
http://www.cabe.org.uk/case-studies/hammarby-sjostad/design<br />
(accessed July 14, 2010).<br />
City of Stockholm (2005). Disability Policy<br />
Programme for the City of Stockholm:<br />
Summarized Version, Malmö.<br />
City of Stockholm website, http://international.<br />
stockholm.se/Press-and-media/Stockholmstories/Sustainable-City/<br />
(accessed July 14, 2010).<br />
City of Sundbyberg website, http://www.<br />
sundbyberg.se/ (accessed July 14, 2010).<br />
Communication with Björn Cederquist, City Planning<br />
Department, City of Stockholm, August 2010.<br />
Communication with Daniel Firth, Transport<br />
Planner, Stockholm City Traffic Administration,<br />
July 2010.<br />
Communication with Malena Karlsson, GlashusEtt —<br />
the center for environmental information and<br />
communication in Hammarby Sjöstad, July 2010.<br />
EIA, <strong>Car</strong><strong>bon</strong> emissions from consumption of energy,<br />
http://www.guardian.co.uk/environment/<br />
datablog/2009/dec/07/copenhagen-climatechange-summit-car<strong>bon</strong>-emissions-data-countryworld<br />
(accessed July 14, 2010).<br />
Fränne, Lars (2007). Hammarby Sjöstad — a unique<br />
environmental project in Stockholm. GlashusEtt,<br />
Stockholm. http://www.hammarbysjostad.se/<br />
inenglish/pdf/HS_miljo_bok_eng_ny.pdf<br />
<strong>ITDP</strong> Europe (2010), internet-based survey of<br />
Hammarby Sjöstad residents.<br />
Ressel website, http://www.ressel.se/index.asp<br />
(accessed July 14, 2010).<br />
SL website, http://sl.se/ (accessed July 14, 2010).<br />
Stockholms Stad (2008). The Stockholm<br />
Environment Programme 2008-2011:<br />
Overarching goals and priorities.<br />
Image credits<br />
Figure 1: http://maps.google.de/maps/ms?hl=en<br />
&ie=UTF8&vps=3&jsv=298d&oe=UTF8&msa=<br />
0&msid=116478322990710211544.000490d42<br />
ec5947427b82<br />
Figure 3: http://www.hammarbysjostad.se/<br />
Photo 1: GlashusEtt<br />
Photo 2: Lennart Johansson, Stockholm City<br />
Planning Department<br />
Photos 3, 5, 6, 14: Luc Nadal, <strong>ITDP</strong><br />
Photos 4, 7: Cathleen Sullivan, UC Berkeley<br />
Photo 8–11: Qian Jiang, <strong>ITDP</strong> Europe<br />
Photo 12: Google Maps<br />
Photos 13: Simon Field, <strong>ITDP</strong> Europe
case study<br />
Houten<br />
utrecht, the netherlands<br />
Nicole Foletta, <strong>ITDP</strong> Europe
houten site facts<br />
Architect: Rob Derks<br />
Population: 43,900<br />
Urban Area: 820 ha<br />
Urban Density: 54 persons/ha<br />
Number of Residential Units: 18,400<br />
Distance from Utrecht City Center: 8 km<br />
<strong>Car</strong>s: 415 cars/1,000 residents<br />
Parking Spaces/Residence: 1.1<br />
Non-motorized Mode Share: 55%<br />
Public Transport Mode Share: 11%<br />
Households with <strong>Car</strong>sharing: 2%
48 Europe’s <strong>Vibrant</strong> <strong>New</strong> <strong>Low</strong> <strong>Car</strong>(<strong>bon</strong>) <strong>Communities</strong><br />
background<br />
Houten, a city in the province of Utrecht in The Netherlands, is a<br />
unique example of an entire city designed and built to prioritize<br />
the cyclist and pedestrian. It is a greenfield development with good<br />
transit access, high quality bicycle infrastructure, provision of public<br />
bikes and carsharing, and application of employer contributions<br />
and educational programs to promote cycling. Non-motorized transport<br />
use is higher in Houten than in comparable cities while<br />
car use is lower.<br />
The city’s innovative traffic layout was a departure from the<br />
norms of the time when it was developed in 1968 and approved by<br />
the city council. The design limited intra-city car use and gave priority<br />
to traffic safety for pedestrians and cyclists. Core design features<br />
include narrow roads, application of traffic calming measures and<br />
separation of bicycle paths from car traffic whenever possible.<br />
The basic layout of the city consists of two train stations, each<br />
surrounded by a ring road with a radius of approximately one kilometer.<br />
The rest of the city is covered by an extensive, 129 kilometer<br />
network of bicycle paths (Photos 1 and 2; Figure 1). There are 31<br />
residential districts, each of which is only accessible to cars via the<br />
peripheral ring roads encircling the town. However, the network<br />
of paths for cyclists and pedestrians includes a thoroughfare that<br />
passes directly through the town center, providing filtered permeability<br />
for cyclists and pedestrians. The majority of schools and<br />
important buildings are located along this thoroughfare. Due to this<br />
design, cycling is the most direct mode of transportation and is often<br />
even faster than travel by car. 1<br />
Houten’s innovative design features along with the city’s persistent<br />
policies to favor cyclists and pedestrians have resulted in numerous<br />
measured benefits, including improved cyclist and pedestrian<br />
safety, increased activity levels of residents, and reduced use of<br />
motorized vehicles. Furthermore, this case study demonstrates that<br />
innovative design features are not limited to new districts within a<br />
city, but can be applied to new cities as a whole.<br />
planning process<br />
In 1966 the national government identified Houten, then a small<br />
village with a population of about 3,000, as a high growth area and<br />
mandated a growth plan be developed to accommodate an eventual<br />
population of 100,000. In 1968 Dutch architect Rob Derks offered<br />
a plan heavily focused on filtered permeability: a dense network<br />
of direct routes for cyclists and a course network of general roads,<br />
offering limited city center access to cars (see Filtered Permeability<br />
sidebar, p. 49). The city council, which was then made up of civilians<br />
and farmers and no politicians, approved Derk’s plan, which they<br />
believed would provide a more liveable quality to their city. They<br />
hired four city advisors (including Rob Derks) with expertise in architecture,<br />
city planning and transportation engineering to implement<br />
the plan. This combination of technical and planning expertise was<br />
key to the success of the development.<br />
In 1974 an agreement was made with the national government<br />
to fund the first ring road. Construction began in 1978. Further infrastructure<br />
was publicly funded, both through the local government<br />
1 http://www.youtube.com/watch?v=p4QT5rvnfS0<br />
and using grants from the regional and national governments.<br />
In 1994 Houten was again designated as a new growth area under<br />
the government’s new Vinex Location program (see Vinex Locations<br />
sidebar, p. 50). Plans were made to construct a second train station,<br />
also surrounded by a ring road with bicycle paths and mixed use<br />
lanes throughout. This area is referred to as South Houten.<br />
To this day, city policies in Houten have a strong focus on bicycle<br />
safety and bicycle rights. The local cyclist union is also very active in<br />
advocating for cycling infrastructure and cycling rights.<br />
key policy and design measures<br />
Sustainable transportation is one of the main priorities of the City<br />
of Houten. Beyond using urban design to encourage cycling and<br />
walking, the city has also applied several other policy measures, the<br />
combination of which has had a great impact on travel behavior of its<br />
citizens. These are described below.<br />
Bicycle and Pedestrian Infrastructure<br />
As mentioned, the city of Houten has over 129 kilometers of cycle<br />
paths, which are colored brick-red. In the city center these paths are<br />
completely separated from car traffic (Photo 3), although motorized<br />
scooters are allowed to use them. (Dutch law places low-speed<br />
scooters in the same category as bicycles, therefore they cannot<br />
legally be excluded from using the paths.) In order to improve<br />
safety, speed bumps are located on cycle paths throughout the city<br />
designed specifically to slow motorized scooters while providing<br />
minimal disturbance to cyclists (Photo 4). The entrance to many of<br />
the cycle paths are blocked by bollards, so cars are physically unable<br />
to enter these pathways. Only in residential areas do bikes share<br />
roads with cars, but speeds in these areas are limited and the streets<br />
are traffic calmed to maintain safety for pedestrians and cyclists.<br />
Furthermore, signs are located on these streets stating that cars are<br />
guests on the road and must give priority to cyclists. Bicycle tunnels<br />
and bridges have been built under or over the ring roads so that neither<br />
bicycle nor car traffic are interrupted (Photo 5). In addition, cycle<br />
paths connect Houten to the city of Utrecht where many residents<br />
commute for work.<br />
This extensive focus on bicycle infrastructure and bicycle priority<br />
above the car on all city streets is unique to the city of Houten.<br />
Furthermore, infrastructure costs for Houten are no higher than for<br />
any other Vinex location in the Netherlands (Beaujon 2002; Tiemens<br />
2010). This focus makes cycling in Houten easier, safer and more<br />
convenient than in other cities. Surveys have shown that even those<br />
not predisposed to cycling cycle more as a result of living in Houten<br />
(Hilbers 2008). This demonstrates the strong impact infrastructure<br />
can have on travel choices.<br />
One issue encountered is that since so many residents cycle, it<br />
can often be difficult to find a bicycle parking spot, especially in hightrafficked<br />
areas like the city center (Photo 6). To resolve this issue,<br />
the city is currently constructing a staffed bicycle parking facility and<br />
bicycle shop under the tracks of the central train station.<br />
Urban Design<br />
Houten’s early focus on urban design is a key to the city’s current<br />
level of transport sustainability. When designing the city, Houten’s
Houten 49<br />
planning advisors considered how the location of housing and layout<br />
of roads and bicycle paths would affect resident travel behavior. They<br />
did not neglect the car in their designs, but created a layout that<br />
would give priority to cyclists.<br />
Street Layout and Design<br />
The street network in Houten consists of north and south ring roads,<br />
each with a radius of about one kilometer (Figure 1). From the ring<br />
road there are roads leading to every residence, however, generally<br />
there are no direct links between neighborhoods by car. In order<br />
to access another neighborhood, drivers must first enter the ring<br />
road and then exit again at their destination. Furthermore, even on<br />
these residential roads used to access homes, priority is given to<br />
cyclists (Photo 7). Other than these mixed-use roads the majority of<br />
streets within the city are for cyclists only and cars are restricted from<br />
entering. Due to the layout of streets and cycle ways, cyclists have<br />
much more direct access to various parts of the city, often resulting in<br />
cycling being the fastest mode of travel.<br />
Urban design features were used to mark the transitions from the<br />
ring road to the residential areas. By law, drivers are required to slow<br />
down when exiting the ring road, which has a speed limit of 90 km/hr,<br />
and entering the 30 km/hr residential areas, but these design features<br />
help to further ensure safety at ring road exits. First, large buildings<br />
are located on either side of the road at these transition points to act<br />
as a visual signal to drivers that they are entering the city. Additionally,<br />
there is a change in the road from asphalt pavement to bricks and<br />
a fork to slow down car speed. Furthermore, no residential street is<br />
straight for more than 75 meters, which helps to maintain safe vehicle<br />
speeds and heighten driver awareness of the surroundings.<br />
filtered permeability<br />
Filtered permeability is an urban planning and<br />
design technique that allows pedestrians and<br />
cyclists to travel through an area more directly than<br />
motorists. This makes travel by these modes more<br />
convenient and even faster than traveling by car,<br />
stimulating mode switching and reducing emissions.<br />
This approach may even include strategies to limit<br />
or restrict movement by cars.<br />
Filtered permeability applications often include<br />
separating pedestrian and cycling paths from roads<br />
for motorized vehicles. Houten, for example has<br />
built a limited street network for motorized vehicles<br />
while providing a more extensive network of car-free<br />
paths for pedestrians and cyclists.<br />
As a result, traveling by bike is often more direct<br />
and even faster than traveling by car. In addition,<br />
pedestrian and cycle paths have been separated<br />
from roads for motorized vehicles whenever<br />
possible, even at intersections where bicycle bridges<br />
or tunnels have been built to keep cycling traffic<br />
separate from car traffic.<br />
car-oriented street<br />
mixed use road<br />
cycle only path<br />
cyclist and pedestrian path<br />
train tracks<br />
train station<br />
Figure 1: Street Layout of Houten
50 Europe’s <strong>Vibrant</strong> <strong>New</strong> <strong>Low</strong> <strong>Car</strong>(<strong>bon</strong>) <strong>Communities</strong><br />
vinex locations<br />
Vinex Locations are areas in the Netherlands,<br />
generally in the outskirts of cities, designated for<br />
housing development. The program was created by<br />
the Dutch Ministry of Housing in 1993 as an answer<br />
to the anticipated housing shortage, mainly due to<br />
the high growth rate of the population. More than<br />
just an urban-extension program, the Vinex project<br />
was intended to metamorphose the shape of the<br />
Netherlands. Over a million houses were to be built<br />
by 2015, in new neighborhoods fulfilling special<br />
conditions. “To fit the requirements of the consumer<br />
in the 21st century,” special attention was given to<br />
quality, sustainability and social equity.<br />
The principles of Vinex housing are:<br />
··<br />
Build cohesive neighborhoods in place of existing<br />
urban gaps to reduce the fragmentation of Dutch<br />
cities and to protect green areas<br />
··<br />
Make easily accessible all urban facilities and, in<br />
particular, shopping centers in order to increase<br />
the potential customer base<br />
··<br />
Reduce car-dependency by providing easy access<br />
to urban facilities by public transport or NMT<br />
··<br />
Build a viable and social structure that will correspond<br />
to all layers of society<br />
Vinex Locations are required to create growth plans<br />
following certain standards. To avoid segregation,<br />
30% of housing is required to be social housing,<br />
which is subsidized by the government and meant<br />
for low-income households. Additionally, housing<br />
must be high density with at least 30 houses per<br />
hectare, must conform to market conditions,<br />
must maintain the relation between existing and<br />
new urban areas and must use sustainable design<br />
(Vinex Location Website).<br />
Public Space Design<br />
The city of Houten has incorporated many open public spaces and<br />
green areas into its design. Next to the central train station is a plaza<br />
surrounded by a man-made canal and home to numerous shops and<br />
cafes. The plaza is often used for public markets, making it a bustling<br />
activity center. A similar plaza with shops and cafes but incorporating<br />
a Romanesque theme, is planned for the Houten Castellum station<br />
in the south of the city. Many small play areas and parks are located<br />
throughout the city so that no one has to go far to find green space.<br />
In addition, a small forest complete with cycle paths and play areas<br />
for children was created just outside the city. The objective was to<br />
create an area near the city, accessible by bicycle or walking, where<br />
residents could escape to enjoy nature without having to drive.<br />
Land Use Planning and Design<br />
In the core of each of Houten’s rings is a train station, so that no one<br />
lives more than two kilometers away from a station. Next to each station<br />
is a plaza with shops and other amenities. Housing is arranged<br />
“like pedals of a flower” around these central areas (Beaujon 2002).<br />
This style follows the classic layout of a transit oriented development<br />
(TOD), with housing and retail focused around a central transit station,<br />
maximizing access for all residents. Furthermore, the majority<br />
of schools and important buildings are located along a bicycle thoroughfare,<br />
which runs through the center of the city, providing easy<br />
access to important destinations by bike.<br />
A business park is located in South Houten close to the border<br />
between the two rings, providing many job opportunities to<br />
residents. In addition, the historic city center of Houten is located in<br />
the southwestern part of the northern ring, which consists of a plaza<br />
surrounded by shops and restaurants as well as several historical<br />
buildings, including a protestant church that dates back to the 1500’s.<br />
Public Transport<br />
As mentioned, Houten has two railway stations, one located in the<br />
center of each ring road. Houten Castellum was recently renovated<br />
and additional track capacity was added. Every 15 minutes a train<br />
takes travelers from Houten Station to the city of Utrecht, with a journey<br />
time of 10 minutes. There are also four trains per hour running in<br />
the opposite direction, towards the town of Geldermalsen. Houten<br />
also has bus connections to Utrecht and other regional centers. The<br />
trains and buses make it easy for residents to access Utrecht and<br />
other parts of the Netherlands without needing a car.<br />
Train and bus riders in Houten may use the OV-chipkaart, a<br />
contactless smartcard that will eventually be used on all public<br />
transport in the Netherlands. Introduction of this card simplifies the<br />
process of traveling to other parts of the country. The same card can<br />
also be used in the GWL Terrein development located in Amsterdam.<br />
Public Bikes<br />
An OV-Fiets (translated as “public transport bicycle”) rental station<br />
with 35 bikes is located at a staffed bicycle parking facility near<br />
Houten’s central train station (Photo 8). OV-Fiets started as a pilot<br />
project in the Netherlands in 2002 with the aim to integrate bike<br />
rental as part of the services offered by the Dutch public transport<br />
system. There are now over 160 rental points, mainly located at<br />
train stations throughout the Netherlands. The scheme has been<br />
designed for frequent users, mainly commuters, to encourage<br />
cycle use over motorized transport for the first/ last leg of their journeys<br />
between the station and their homes or places of work. Currently<br />
50% of the nation’s rail passengers have access to the scheme<br />
(OV-Fiets (NL) 2008).<br />
OV-Fiets users must register with the system and a Dutch bank<br />
account is necessary for the subscription charges. Users can sign<br />
up using their existing annual rail season card (much like the Oyster<br />
scheme in London) or obtain a membership card. Each individual<br />
rental costs € 2.85 per 20 hour period up to a maximum of 60 hours.<br />
The yearly subscription charge is € 9.50. Members may use a bike at<br />
any location throughout the Netherlands, but must always return the<br />
bike to the station where it was obtained.<br />
The OV-Fiets system differs from bikesharing systems being<br />
introduced in many cities, such as Velib in Paris and Stockholm City<br />
Bikes, in which short trips are encouraged and users can pick-up<br />
and drop-off bikes at numerous locations throughout the city.<br />
OV-Fiets, on the other hand, has one charge per 20 hour period, so<br />
users often keep the bikes for longer periods of time. Additionally,<br />
each bike comes equipped with a lock, making it possible for users<br />
to park the bike, for example, at their office during the day, and use
Houten 51<br />
Table 1: Information about carsharing companies in Houten<br />
Wheels4All<br />
Greenwwheels<br />
Deposit 250 € 225 €<br />
Monthly subscription fee<br />
(varies based on subscription type)<br />
Several options:<br />
2.5, 5, 10, 20 or 150 €<br />
4,700<br />
Population density (persons/ha) 2.5, 5, 10, 20 or 150 € Ranges from:<br />
Fee per km (varies based on subscription type) 0.11 or 0.13 € 0.10 €<br />
Hourly fee (varies based on subscription type) 0.5, 1.6 or 2.5 € 2.50 €<br />
Discounts available No substantial discount available Discount with Dutch Railway card<br />
(NS card)<br />
Company membership option Yes Yes<br />
Number of cars available in Houten 14 2<br />
http://www.wheels4all.nl,<br />
http://www.greenwheels.nl<br />
Table 2: Houten as compared to nearby and surrounding areas<br />
Houten Zeist Milton Keynes South Houten Veldhuizen<br />
Population 43,900 60,400 196,000 18,700 9,350<br />
Urban area (ha) 820 2,500 8,900 350 190<br />
Urban density (persons/ha) 54 24 22 53 49<br />
Number of residential units 18,400 26,600 na 5,700 3,500<br />
<strong>Car</strong>s per 1,000 residents 415 530 na 449 na<br />
Mode share<br />
<strong>Car</strong> 34% 46% 70% 58% 77%<br />
Public transit 11% 11% 10% 16% 10%<br />
Bicycle 28% 29% 3% 24% 13%<br />
Walking 27% 14% 17% 2% 0%<br />
<strong>ITDP</strong> Europe, 2010;<br />
City of Houten;<br />
City of Zeist;<br />
Milton Keynes<br />
Council, 2009;<br />
Hilbers, 2008<br />
the bike throughout the day for trips or errands. The bike must then<br />
be brought back to the same station where it was checked-out.<br />
Therefore it functions as a hybrid system between bikesharing and<br />
bicycle rental.<br />
<strong>Car</strong>sharing<br />
Two carsharing companies are located in Houten: Greenwheels and<br />
Wheels4all. Greenwheels has two carsharing vehicles in Houten, one<br />
of which is located near the central station. Wheels4all has fourteen<br />
cars located throughout the city. These vehicles provide residents of<br />
Houten with access to a car when needed without having to own one.<br />
More information about these companies is included in Table 1.<br />
Employer Contributions<br />
In the Netherlands, companies are required to compensate employees<br />
for their transport to work. This money is subsidized by the<br />
government through tax deductions. Typically employers provide<br />
a variety of options that employees can choose between, such<br />
as reimbursement for fuel, free parking, transit passes, and even<br />
providing money towards the purchase of a new bike. For example,<br />
City of Houten employees can purchase a tax deductible bike every<br />
three years. The City of Houten goes beyond national policy to<br />
restrict companies from offering compensation options related to<br />
cars. Companies may only offer transport subsidies related to bikes<br />
or public transit, in order to encourage employees to choose these<br />
options over commuting by car (Tiemens 2010).<br />
Educational Programs<br />
Children are taught from an early age≠ not only about the health<br />
benefits of cycling, but also about bicycle safety. Since cycling is a<br />
primary mode of transport in Houten, it is essential that residents<br />
understand appropriate and safe bicycle use. Starting at an early age<br />
Houten’s children are given a thorough education in bicycle riding<br />
and take a compulsory bicycle exam when they are 10 years old to<br />
test their knowledge of hand signals, road rules and riding ability.<br />
Children must take this test until they pass (CylcePress 2003).<br />
quantitative analysis<br />
In order to quantify the benefits of Houten’s unique combination of<br />
urban design structure and policy measures, we compared it to Zeist,<br />
as a reference point within the Netherlands, and Milton Keynes,<br />
England, to demonstrate the difference between bike-oriented and<br />
car-oriented urban design (Table 2). Zeist has a similar population<br />
to Houten and, like Houten, is located on the outskirts of Utrecht (a
52 Europe’s <strong>Vibrant</strong> <strong>New</strong> <strong>Low</strong> <strong>Car</strong>(<strong>bon</strong>) <strong>Communities</strong><br />
1<br />
Houten<br />
2<br />
Cycle path<br />
Houten has 129 km<br />
of cycle tracks, many<br />
of which are fully<br />
separated from traffic.
Houten 53<br />
3<br />
A car yields as<br />
cyclists cross<br />
4<br />
Speed bumps slow<br />
motor scooters which<br />
are permitted by Dutch<br />
law on cycle paths.
54 Europe’s <strong>Vibrant</strong> <strong>New</strong> <strong>Low</strong> <strong>Car</strong>(<strong>bon</strong>) <strong>Communities</strong><br />
5<br />
Cycle<br />
tunnel<br />
Cycle paths cross<br />
the ring road, giving<br />
both cyclists and<br />
motorists safe,<br />
uninterrupted travel<br />
routes.<br />
6<br />
Bicycle trailer<br />
Children learn about<br />
cycling and cycling<br />
safety from an early<br />
age in Houten and<br />
many families travel<br />
together via bike.
Houten 55<br />
7<br />
Mixed use<br />
street<br />
On residential<br />
streets, bikes share<br />
space with cars, but<br />
as the sign indicates,<br />
drivers must give<br />
cyclists right-of-way.<br />
8<br />
OV-Fiets<br />
bicycles<br />
An OV-Fiets bicycle<br />
rental station near<br />
Houten’s train<br />
station is a blend<br />
between bikeshare<br />
and traditional bike<br />
rental, allowing for<br />
day-long rentals<br />
to encourage<br />
passengers to ride to<br />
and from the station.
56 Europe’s <strong>Vibrant</strong> <strong>New</strong> <strong>Low</strong> <strong>Car</strong>(<strong>bon</strong>) <strong>Communities</strong><br />
regional center with a population of 307,000). Like many cities in the<br />
Netherlands, Zeist has good bicycle and pedestrian infrastructure;<br />
however its street network is much more car-oriented than the Houten<br />
network. Milton Keynes, like Houten, was designed in the 1960’s<br />
as a new city; it was the last and largest of the British government’s<br />
new towns, under the 1946 <strong>New</strong> Towns Act. The city is located about<br />
80 km northwest of London. Unlike Houten’s bicycle and pedestrian<br />
focused, dense, urban design, Milton Keynes was designed with the<br />
car in mind, focusing on low densities and easy car access on high<br />
speed grid roads. In a further attempt to accommodate the car, the<br />
parking supply is quite high; as much as 2-3 times higher than what<br />
would be expected for a city of its size (Whiteside 2007).<br />
Additionally, the area of South Houten is compared to the<br />
neighborhood of Veldhuizen, located in the Leidsche Rijn district of<br />
the city of Utrecht. Like South Houten, Leidsche Rijn was identified as<br />
a high growth area, or Vinex Location (see Vinex Locations sidebar).<br />
Both locations were required to follow the same Vinex Location<br />
guidelines, including reserving 30% of housing as social housing,<br />
providing a density of at least 30 houses per hectare, maintaining<br />
the relation between existing and new urban areas and using<br />
sustainable design. The neighborhoods in the Leidsche Rijn district<br />
were designed individually, each with its own identity. However, the<br />
urban designers of Veldhuizen and other neighborhoods of Leidsche<br />
Rijn took a different approach to the planners of Houten, placing<br />
more focus on cars and therefore providing more parking facilities,<br />
more main roads, and improvements to public transit (Hilbers 2008).<br />
Table 2 provides a summary of statistics for the entire city of Houten<br />
(within the two ring roads), the city of Zeist, the city of Milton Keynes,<br />
the area of South Houten (within the southern ring road) and the<br />
neighborhood of Veldhuizen.<br />
<strong>Car</strong> and Bicycle Ownership Rates<br />
While the car ownership rate of Houten is not necessarily low (415<br />
cars per 1,000 residents), it is lower than the nearby city of Zeist (530<br />
cars per 1,000 residents). A survey of Milton Keynes residents found<br />
that 45% of households have two or more cars (Milton Keynes Council<br />
2009). This is higher than for the city of Houten where 36% of households<br />
have two or more cars (<strong>ITDP</strong> Europe 2010). The Milton Keynes<br />
survey did not collect exact numbers of cars owned per household.<br />
Surveys conducted in both Houten and Milton Keynes asked<br />
about the bicycle ownership rates for households. In Houten only<br />
2% of households are without a bicycle while in Milton Keynes 35%<br />
of households do not own a bike. The bicycle ownership rate is quite<br />
high in Houten at 3.4 bikes per household. The rate is much lower in<br />
Milton Keynes at 1.1 bikes per household. This is not surprising given<br />
that the Netherlands is known for having a much stronger bicycle<br />
culture than England. However, investments in bicycle infrastructure<br />
also likely contribute to this difference. The city of Houten has nearly<br />
three meters of cycle paths per resident while Milton Keynes has just<br />
over one meter of cycle paths per resident. Furthermore, the cycle<br />
paths in Houten are direct and are perceived as safe by residents,<br />
while the cycle lanes in Milton Keynes are not direct, can be difficult<br />
to follow and are perceived by some to be dangerous after dark<br />
(Whiteside 2007).<br />
Bicycle Use and Perceptions<br />
Results of a survey conducted by University of Utrecht students shows<br />
that people in South Houten are more active, on average, than people<br />
in both Veldhuizen and the Netherlands as a whole (Figure 2). Factors<br />
contributing to this increased activity are that residents of South<br />
Houten more often cycle for daily and weekly errands and also spend<br />
more hours per week on recreational cycling (2.3 hours per week<br />
for South Houten residents versus 1.4 hours per week for Veldhuizen<br />
residents). It would appear that the spatial design structure<br />
and extensive cycle network seem to encourage cycling in Houten.<br />
This is further supported by survey findings that residents of South<br />
Houten are more satisfied with the number of unhindered bike<br />
paths and give higher ratings for quality and safety of bike paths<br />
(Figure 3). In addition, more than half of survey respondents stated<br />
that their bicycle use increased after moving to South Houten<br />
(Hilbers 2008).<br />
Mode Split<br />
While Houten residents do more recreational cycling than residents<br />
in surrounding areas, encouraging more transportational cycling<br />
is key to reducing car<strong>bon</strong> emissions. A survey of South Houten and<br />
Figure 2: Activity level of residents of The Netherlands, South Houten and Veldhuizen<br />
100%<br />
80%<br />
inactive<br />
(less than 0.5 hours<br />
of exercise per week)<br />
percent of residents<br />
60%<br />
40%<br />
moderately active<br />
(0.5 – 2.49 hrs/wk)<br />
active<br />
(2.5+ hrs/week)<br />
20%<br />
0%<br />
The Netherlands<br />
(2005)<br />
South Houten<br />
(2008)<br />
Veldhuizen<br />
(2008)<br />
Hilbers, 2008
Houten 57<br />
Veldhuizen residents in 2008 found that more respondents from<br />
South Houten (24%) cycle to work than respondents from Veldhuizen<br />
(13%), as seen in Figure 4. Furthermore, 14% of respondents from<br />
South Houten cycle or walk to a public transportation stop or station<br />
and then take public transportation to work versus 9% in Veldhuizen.<br />
A far smaller proportion of South Houten residents (58%) travel to<br />
work by car than Veldhuizen residents (77%).<br />
Surveys of residents of Houten and Milton Keynes found that far<br />
more work trips made by Houten residents (31%) are by bike than<br />
work trips made by Milton Keynes residents (4%), as seen in Figure 5.<br />
In addition, far more commute trips by Milton Keynes residents<br />
(73%) are by car than in Houten (53%). This demonstrates that<br />
Milton Keynes residents are much more dependent on their cars for<br />
work trips than Houten residents.<br />
Still, many work trips made by Houten residents are by car,<br />
particularly for trips out of the city. However, by far, the most popular<br />
mode of travel for trips made within the city is cycling. The majority<br />
of Houten residents travel to the grocery store (53%), conduct other<br />
shopping (70%), run service related errands like visiting the bank or<br />
barber (79%) and visit friends and family in Houten (79%) by bike or<br />
on foot, as seen in Figure 6.<br />
Overall, more than half of all trips made by Houten residents<br />
(55%) are made by non-motorized modes of travel, which is higher<br />
than for the city of Zeist (43%) and Milton Keynes (20%). Further,<br />
higher proportions of trips made by Milton Keynes (70%) and Zeist<br />
residents (46%) are by car than for the city of Houten (34%), as seen<br />
in Figure 7. A further study found that 42% of trips shorter than 7.5<br />
kilometers in Houten are made by bike, and around 21% by foot (City<br />
of Houten Website). Another study states that car use in Houten is<br />
25% lower than in similar cities (Beaujon 2002). All of these studies<br />
support the finding that the combination of measures present in<br />
Houten have contributed to improved sustainability of travel choices<br />
of residents, particularly for trips within the city.<br />
Distance Traveled<br />
Distance traveled is a key measure for evaluating transport-related<br />
emissions. Resident surveys found that residents of South Houten<br />
have shorter commute times than residents of Veldhuizen, even<br />
while more people commute to work by bike and fewer by car. This<br />
suggests that residents of South Houten live closer to work, thus<br />
requiring less daily travel, and reducing the car<strong>bon</strong> footprint of<br />
residents (Hilbers 2008).<br />
Figure 3: Perceptions of bicycle path quality and safety in South Houten and Veldhuizen<br />
bicycle path<br />
safety<br />
Veldhuizen<br />
(2008)<br />
South Houten<br />
(2008)<br />
bicycle path<br />
quality<br />
1 2 3<br />
bad<br />
average<br />
good<br />
Hilbers, 2008<br />
Figure 4: Mode of transportation to work for South Houten and Veldhuizen residents<br />
100%<br />
car<br />
80%<br />
public transport<br />
with car as pre-transport<br />
percent of residents<br />
60%<br />
40%<br />
public transport<br />
with cycling or walking<br />
as pre-transport<br />
bicycle<br />
walking<br />
20%<br />
0%<br />
South Houten<br />
(2008)<br />
Vedhuizen<br />
(2008)<br />
Hilbers, 2008
58 Europe’s <strong>Vibrant</strong> <strong>New</strong> <strong>Low</strong> <strong>Car</strong>(<strong>bon</strong>) <strong>Communities</strong><br />
Figure 5: Mode of travel to work<br />
100%<br />
car<br />
80%<br />
public transport<br />
bicycle<br />
percent of trips<br />
60%<br />
40%<br />
walking<br />
20%<br />
0%<br />
Houten<br />
(2010)<br />
Milton Keynes<br />
(2009)<br />
Hilbers, 2008<br />
Figure 6: Houten residents’ mode of travel for various trip types (2010)<br />
100%<br />
80%<br />
car<br />
public transport<br />
bicycle<br />
percent of residents<br />
60%<br />
40%<br />
walking<br />
20%<br />
0%<br />
grocery shopping<br />
other shopping<br />
service related<br />
errands<br />
visiting family<br />
and friends<br />
<strong>ITDP</strong> Europe, 2010<br />
Indeed, surveys of residents throughout the city of Houten found<br />
that 21% of residents live within 5 kilometers of their place of work<br />
or education, and more than half live within 15 kilometers. However,<br />
the finding that almost half of residents live 15 kilometers or more of<br />
their place or work corresponds with the finding that 53% of resident<br />
commute trips are by car (Figure 5). For longer travel distances,<br />
residents are forced to travel by motorized modes since most are not<br />
able to cycle or walk such long distances. While Houten has good<br />
public transport access, it appears that many residents still choose<br />
to travel by car to work, particularly for destinations more than 25<br />
kilometers from home. Increased car travel increases the car<strong>bon</strong><br />
footprint of residents.<br />
Half of Houten residents travel less than one kilometer to their<br />
grocery store, and 18% travel a mere 500 meters or less. The average<br />
distance residents travel to a grocery store is 1.2 km (<strong>ITDP</strong> Europe<br />
2010). However, 47% of residents stated that they typically travel to<br />
the grocery store by car (Figure 6). Residents might be incentivized<br />
to drive to the store based on the low parking rates in parking<br />
garages in Houten and the high availability of parking spaces. If<br />
parking prices were increased, more residents would likely shift to<br />
cycling to the grocery store, since the majority of residents already<br />
cycle for most other trip purposes within the city (Figure 6). Indeed,<br />
many residents own bike trailers which can be used to carry goods<br />
(Photo 6). These trailers, combined with the short distance to a<br />
grocery store make shopping trips by bicycle feasible.
Houten 59<br />
Figure 7: Mode split for all trips<br />
100%<br />
car<br />
80%<br />
public transport<br />
bicycle<br />
percent of trips<br />
60%<br />
40%<br />
walking<br />
20%<br />
0%<br />
Houten<br />
(2010)<br />
Zeist<br />
(2008)<br />
Milton Keynes<br />
(2009)<br />
<strong>ITDP</strong> Europe, 2010;<br />
Rijkswaterstaat Centre<br />
for Transport and<br />
Navigation, 2008;<br />
Milton Keynes<br />
Council, 2009<br />
lessons learned<br />
Residents of Houten cycle far more and drive far less than their<br />
neighbors, and much less than their counterparts in Milton Keynes,<br />
England. However, the city has been so successful at promoting<br />
cycling and transit, that now over-crowding has become an issue.<br />
Bicycle parking facilities are filled capacity and residents complain<br />
about lack of bicycle parking. The city of Houten is aware of this<br />
issue and is currently constructing a staffed bicycle parking facility<br />
combined with a bicycle shop and bicycle repair services under the<br />
tracks of the central train station.<br />
The demand for trains leaving from Houten’s central station was<br />
also underestimated. As a result, frequency of train service to Houten<br />
was increased and the number of tracks on the line from Utrecht to<br />
the south via Houten is currently being doubled to four tracks.<br />
An important strategy not applied in Houten is to restrict parking<br />
by limiting and pricing parking. There is more than one parking space<br />
per residential unit in Houten. As a result, the majority of households<br />
own cars and the car ownership rate in the city is fairly high.<br />
In addition, two parking garages are located near the central station.<br />
The first two hours are free within these garages, then 1.50 Euros per<br />
hour is charged up to a maximum of 9 Euros per day. The shop owners<br />
in central Houten subsidize the free hours through their rent. They<br />
were worried they would lose business if people had to pay too much<br />
for parking (Tiemens 2010). However, as shown in Figure 6, most<br />
residents of Houten already walk or ride a bike for shopping trips,<br />
so parking prices could easily be raised without hurting business.<br />
Though most do cycle, the low prices for parking might encourage<br />
some residents to drive to the grocery store rather than cycle, even<br />
though they live within cycling distance of the store.<br />
Other cities that choose to replicate Houten’s model should limit<br />
or economically decouple residential parking in order to encourage<br />
reduced car ownership. In addition, non-residential parking should<br />
be priced in order to encourage residents to use other forms of transportation<br />
besides driving to do their shopping.<br />
sources<br />
Beaujon, Otto (2002). Biker’s Paradise: Houten.<br />
Bike Europe.<br />
City of Houten website, http://www.houten.nl/overgemeente-houten/projecten/houten-demarreert/<br />
internationaal/ (accessed August 9, 2010).<br />
City of Zeist website, http://www.zeist.nl/<br />
(accessed August 9, 2010).<br />
CyclePress (2003). Taking a Look at Houten City,<br />
CylcePress, No. 189, May 2003.<br />
Greenwheels website, http://www.greenwheels.nl<br />
(accessed August 9, 2010).<br />
Hilbers, Brechtje (2008). The influence of the<br />
spatial planning on bicycle use and health —<br />
Comparisons between Houten and Leidsche Rijn.<br />
University of Amsterdam.<br />
<strong>ITDP</strong> Europe (2010). Internet-based survey of<br />
Houten residents, conducted in cooperation with<br />
the City of Houten.<br />
Milton Keynes Council (2009). Milton Keynes Multi-<br />
Modal Transport Model — Report of Survey,<br />
Halcrow Group Limited, London.<br />
OV-Fiets (NL) (2008). Bikeoff Project — Design<br />
Against Crime, http://www.bikeoff.org/design_<br />
resource/dr_PDF/schemes_public_Ov_fiets.pdf<br />
Rijkswaterstaat Centre for Transport and<br />
Navigation (2008).<br />
Tiemens, Herbert (2010). Interview with Herbert<br />
Tiemens, Traffic Planner, City of Houten,<br />
May 27, 2010.<br />
Vinex website, http://vinex-locaties.nl (accessed<br />
August 9, 2010).<br />
Wheels4all website, http://www.wheels4all.nl<br />
(accessed August 9, 2010).<br />
Whiteside, Kevin (2007). MK Transport —<br />
Moving with the Times, Urban Design, Issue 104,<br />
pp. 27–33.<br />
Image credits<br />
Figure 1: City of Houten<br />
Opening spread photo: Nicole Foletta<br />
Photos 1–6, 8: Nicole Foletta<br />
Photo 7: Simon Field
sihlcity site facts<br />
Developer: Karl Steiner AG<br />
Architect: Theo Hotz Architects<br />
Developed Area: 4 ha<br />
Construction Began: 2003<br />
Year Completed: 2007<br />
Number of Businesses: 97<br />
Jobs: 2,300<br />
Visitors per Day: 19,000<br />
Visitor Parking Spaces: 800<br />
Allocated Staff Parking: 0<br />
Transit and NMT Combined Mode<br />
Share: 67%<br />
Number of <strong>Car</strong>sharing Vehicle<br />
Available: 3
case study<br />
Sihlcity<br />
zurich, switzerland<br />
Simon Field, <strong>ITDP</strong> Europe
62 Europe’s <strong>Vibrant</strong> <strong>New</strong> <strong>Low</strong> <strong>Car</strong>(<strong>bon</strong>) <strong>Communities</strong><br />
background<br />
Sihlcity is a new non-residential retail and leisure development<br />
located about 2.5 km to the south of Zurich city center (Figure 1). It<br />
is considered best practice because parking is heavily restricted, a<br />
result of a policy in Zurich to only allow new development in sites that<br />
have adequate access to public transit as well as walking and cycling<br />
facilities, thereby detering new car trips to destinations that might<br />
traditionally attract them. The city uses a “trip access contingent<br />
model” to determine what policies will help keep car trips below a<br />
certain level. In this case the process suggested a reduction in parking<br />
supply, and provided incentives for the imposition of high usage<br />
costs. Today only 33% of trips to Sihlcity are made by car.<br />
There are 75 shops, 14 cafés and restaurants, a cinema, church,<br />
library, hotel, gym and medical centre, as well as high quality public<br />
space at Sihlcity (Photo 1). The heart of the development is a fourstory<br />
mall accommodating almost all of the retail businesses. The<br />
site was previously occupied by a paper mill, ceased operations in<br />
1990. In 2003 the land was bought by the developer Karl Steiner AG,<br />
which integrated four of the historic buildings into their plans for a<br />
new non-residential quarter, named after the River Sihl bordering<br />
the site to the east. In 2008 Sihlcity received a European Shopping<br />
Centre Commendation, in recognition of the work of Theo Hotz<br />
Architects in blending the old and new, as well as the provision of a<br />
variety of businesses and services on the same compact site<br />
(Sihlcity, 2008).<br />
Large shopping centers are significant trip attractors, and without<br />
incentives not to, most people get to them by car. To prevent new<br />
traffic congestion and pollution on the routes to Silhcity, the City and<br />
Canton of Zurich invoked planning regulations to restrict car access<br />
a) as a condition of initial planning permission, and (b) in the longerterm<br />
after opening.<br />
This strategy includes parking management, better public transportation,<br />
improvements to infrastructure for cyclists and pedestrians,<br />
and the provision of a sustainable home delivery service.<br />
planning process<br />
According to the Canton of Zurich Structural Plan, “heavily frequented<br />
sites” 1 may only be located in areas that satisfy the following<br />
accessibility criteria:<br />
··<br />
A maximum distance of 300 m to a rail station served by at least<br />
one train per hour, or 150 m to a transit stop served by eight or<br />
more trams, buses or trolleybuses per hour;<br />
··<br />
Sufficient road capacity in the surrounding area for general traffic;<br />
··<br />
Proximity to existing pedestrian routes and cycle networks<br />
Having passed this initial screening, the City of Zurich approved<br />
the plans for construction of Sihlcity subject to conditions being<br />
imposed on the site owner and developer that include:<br />
1 Defined by the Canton of Zurich as sites that generate more than 3,000<br />
trips per day on more than 100 days of the year.<br />
Figure 1: Transit routes to and from Sihlcity
Sihlcity 63<br />
··<br />
Provision of “recreation quality” space within the site (Photo 1);<br />
··<br />
Provision of capital and revenue support for the following<br />
public transportation improvements: extension of platforms<br />
at Saalsporthalle S-Bahn (urban rail) station, with a new<br />
pedestrian subway giving access to the site; construction of<br />
a subterranean bus station; operation of bus route 89 and an<br />
extension to tram route 5 for two years (Photo 2);<br />
··<br />
The development must pay for the construction of new access<br />
roads and links to the existing bicycle network on three sides<br />
of the site;<br />
··<br />
Provision of a bicycle-based home delivery service;<br />
··<br />
Parking on the site is capped at a maximum of 850 spaces, all<br />
of which must be charged for, plus a cap on car trips to the site<br />
(access contingent).<br />
The access contingent model is a mechanism to impose limits<br />
on the number of trips made to/from a site by private car in a given<br />
period, with stiff financial penalties for non-compliance. This<br />
provides an incentive for the owner of a new development to make<br />
access by alternative means as attractive as possible. The first step is<br />
the calculation of the number of parking spaces permitted, based on<br />
the following criteria in the City of Zurich’s parking regulations:<br />
··<br />
Floor area per building category e.g. offices, retail, restaurants;<br />
··<br />
A reduction factor based on proximity to the city centre;<br />
··<br />
A reduction factor based on transit accessibility level;<br />
··<br />
A reduction factor where local NOx limits are exceeded;<br />
In Zurich’s central old town district, for example, a blanket<br />
reduction factor of 90% applies, i.e. the maximum number of spaces<br />
is 10% of the value based on floor space alone. For Sihlcity one<br />
parking place was allowed per 110 m 2 ground floor space, giving<br />
a total of 800 spaces.<br />
The “specific trip generation” per space per day, evening period<br />
and peak hour is capped under a formula based on the categories<br />
of expected visitors. This and estimated price elasticities then<br />
inform the level of parking charges (Table 1). The maximum car trip<br />
contingent values for Sihlcity are as follows:<br />
··<br />
10,000 trips per day, decreasing to 8,800 by 2012;<br />
··<br />
1,300 trips at night;<br />
··<br />
800 trips per peak hour.<br />
key policy and design measures<br />
A two-fold travel demand management strategy is in place at Sihlcity:<br />
high parking costs to “push” visitors and workers out of private<br />
cars, reinforced by parking restrictions in the surrounding area, and<br />
high quality local and city-wide transit and non-motorized transport<br />
infrastructure to “pull” people onto alternatives.<br />
Parking<br />
Parking management discourages trips to Sihlcity by car: spaces are<br />
few and expensive. There are 850 spaces in the on-site multi-story<br />
car park, of which 50 are allocated to park & ride season ticket<br />
holders, but none to Sihlcity workers.<br />
Parking charges are listed on the Sihlcity website and are<br />
in Table 1. A stay of up to four hours costs 7 Swiss Francs (chf),<br />
comparable with the 1–2 zones transit day ticket at 8 chf. However,<br />
residents of Zurich can avail themselves of a range of period passes<br />
for one or more zones in the Zurich Verkehrsverbund (integrated<br />
transportation authority area), a national travel pass (GA card) or<br />
national half-fare card, reducing the real and perceived costs of transit<br />
significantly 2 . As there are no discounts for those employed on the<br />
site, it is prohibitively expensive to commute by car. Table 1 shows<br />
that it costs 20 chf to park at Sihlcity for an eight-hour working day.<br />
2 Over 400,000 GA cards and 2.27 million half-fare cards were sold in<br />
2009; 35% of the Swiss population own one of these mobility passes.<br />
Sources: SBB (2009) and FSO (2010).<br />
Table 1: Sihlcity parking charges<br />
Time (hours)<br />
Daytime rate<br />
08:00 – 20:00 (chf) *<br />
Evening rate<br />
20:00 – 08:00 (chf) *<br />
< 1 2.50 2.50<br />
1 – 2 3.50 3.50<br />
2 – 3 5.00 5.00<br />
3 – 4 7.00 7.00<br />
4 – 5 10.00 8.00<br />
5 – 6 12.00 9.00<br />
6 – 7 15.00 10.50<br />
7 – 8 20.00 12.00<br />
8 – 9 25.00 13.50<br />
9 – 10 30.00 15.00<br />
10 – 11 35.00 16.50<br />
11 – 12 39.00 18.00<br />
12 – 24 39.00 39.00<br />
* 1 chf = 0.75 eur = 0.95 usd<br />
Sihlcity
64 Europe’s <strong>Vibrant</strong> <strong>New</strong> <strong>Low</strong> <strong>Car</strong>(<strong>bon</strong>) <strong>Communities</strong><br />
1<br />
Public space<br />
in the heart of<br />
Sihlcity<br />
The Sihlcity<br />
entertainment center<br />
has an ample amount<br />
of public space, as<br />
opposed to surface<br />
parking lots that are<br />
commonly seen in<br />
similar centers in the<br />
U.S. and Europe.<br />
2<br />
The site developer<br />
paid for the<br />
extension of<br />
platforms at<br />
Saalsporthalle<br />
S-Bahn station,<br />
adjacent to the<br />
Sihlcity mall.<br />
3<br />
Sihlcity underground<br />
bus station, with lift<br />
and steps to the main<br />
square.
Sihlcity 65<br />
4<br />
Prominently<br />
displayed public<br />
transport departure<br />
information in the<br />
heart of Sihlcity.<br />
5<br />
The main entrance<br />
to Sihlcity from<br />
Sihlcity Nord is<br />
reserved for cyclist<br />
and pedestrians,<br />
motorized traffic is<br />
prohibited.<br />
6<br />
Bicycle parking<br />
next to storage<br />
lockers<br />
Customers can<br />
store cold groceries<br />
while running other<br />
errands or take<br />
advantage of lowcost<br />
delivery service<br />
via electric bike.
66 Europe’s <strong>Vibrant</strong> <strong>New</strong> <strong>Low</strong> <strong>Car</strong>(<strong>bon</strong>) <strong>Communities</strong><br />
Figure 2: Recommended pedestrian (green) and cycle (orange) routes into Sihlcity<br />
A fine of 50 chf is payable by vehicle owners attempting to leave<br />
without paying the correct fee.<br />
The surrounding area is a controlled parking zone with no onstreet<br />
parking for non-residents, critical to avoid shoppers or workers<br />
from just parking on residential streets and inconveniencing the<br />
adjacent community. However, the multi-story car park is directly<br />
connected to the mall and the local road network via two new access<br />
roads. The A3 motorway from Zurich to Chur can be accessed at a<br />
junction 0.5 km to the south of Sihlcity at Brunau. Thus the limited<br />
supply and cost of parking is the only policy “stick,” with much<br />
greater reliance on the “pull” measures described below.<br />
Public Transportation<br />
The area is very well served by transit, with traffic-free access routes<br />
to the most heavily used stops. No part of the development is more<br />
than 250 m from Sihlcity Nord tram and bus stop, 150 m from the<br />
extended platforms at Saalsporthalle station (Photo 2) and 150 m<br />
from the site’s own underground bus station (Photo 3). The use of<br />
step-free, low-floor vehicles is detailed in Table 2.<br />
Transit routes and frequencies are summarized in Figure 1 and<br />
Table 2. As in most European cities, a Zurich ZVV single trip ticket<br />
allows unlimited changes to reach one’s destination, minimizing the<br />
inconvenience of interchange. Trams, buses and trains are timed to<br />
connect at many hubs, as is the case across much of Switzerland.<br />
Printed timetables, maps and fare information are displayed at all<br />
stops and in the central public square, with electronic departure<br />
boards located on the square and inside the mall (Photo 4).<br />
A comprehensive network of tram and suburban rail (S-Bahn) services<br />
form the back<strong>bon</strong>e of Zurich’s transit system, complemented<br />
by buses and trolleybuses serving lesser-used and orbital routes.<br />
Routes, timetables and fares are set by the ZVV Verkehrsverbund<br />
(transit agency), which is also responsible for information provision<br />
and marketing, allowing full intra- and inter-modal integration across<br />
the city region: the slogan “one ticket for everything” is part of the<br />
ZVV logo. The municipal operator of the city’s tram and bus network,<br />
VBZ, has heavily marketed the improved transit service to Sihlcity,<br />
focusing on the comfort and frequency of tram routes 5 and 13 with<br />
the slogan “changing makes sense.”<br />
There are location maps, route maps and timetables at all stations<br />
and you can purchase the most popular tickets with coins at<br />
most stations. An increasing number of city centre stops have touchscreen<br />
machines offering a greater variety of passes and destinations:<br />
these accept coins, credit and debit cards, and will eventually<br />
replace the coin-only terminals.<br />
Heavily-used stops feature electronic departure boards, some<br />
of which can display real-time information. All stops are shown<br />
in the online mapping service Google Maps, together with the times<br />
of the next two departures per route and links to full timetables<br />
on the ZVV website. Real-time next stop and connectional information<br />
is announced, and in most cases displayed electronically, in<br />
trams, trains and buses.<br />
Zurich has a zonal fare structure, with a range of personal (nontransferable)<br />
and transferable monthly and annual passes available<br />
for either (a) travel without restriction, or (b) travel at any time outside<br />
the hours of 05:00–09:00 on weekdays: the latter cost half the<br />
price of the unrestricted versions, starting from 693 chf, or 519 eur,<br />
for the annual personal pass covering the entire metropolitan area.<br />
75% of Zurich residents possess at least one transit season pass
Sihlcity 67<br />
Table 2: Transit routes to and from Sihlcity<br />
Route<br />
Sihlcity stops<br />
served<br />
Details<br />
Mon – Fri<br />
peak<br />
frequency<br />
Mon – Sat offpeak<br />
frequency<br />
Sunday<br />
frequency<br />
Step-free<br />
vehicles?<br />
Train S4 Saalsporthalle City radial<br />
routet<br />
Mon – Fri peak<br />
frequency<br />
20 mins 20 mins No<br />
Trams 5<br />
and 13<br />
Sihlcity Nord<br />
City radial<br />
route<br />
3–4 mins 3–4 mins 10 mins Some<br />
Trolleybus<br />
33<br />
Sihlcity Nord<br />
City inner<br />
orbital route<br />
6.5 mins 7.5 mins 10 mins Some<br />
Bus 89<br />
Sihlcity<br />
(bus station)<br />
City outer<br />
orbital route<br />
7.5 mins 15 mins No service Yes<br />
Postbuses Sihlcity /<br />
Saalsporthalle<br />
To/from rural<br />
hinterland<br />
30 mins Mostly hourly (no<br />
Saturday service)<br />
No service<br />
Yes<br />
Author’s<br />
elaboration<br />
(Stadt Zürich, 2007). Books of six one-day and single-trip tickets<br />
are also available. A Junior Travelcard costing 20 chf per year allows<br />
accompanied children up to the age of 16 to travel free. <strong>Car</strong>sharing<br />
membership can be bundled with these options.<br />
Bicycles can be carried on buses, trolleybuses and trams subject<br />
to space, and on S-Bahn trains at off-peak times.<br />
The electricity generation mix across Switzerland as a whole is<br />
55% renewable (largely hydro-electric) and 41.1% nuclear 3 , while<br />
that of the national railway system is 73.5% hydro-electric and 26.5%<br />
nuclear. This clearly demonstrates the value of modal shift from the<br />
car to electrified transit in particular, as a core element of the Swiss<br />
climate change mitigation strategy.<br />
Pedestrian and Cycling Infrastructure<br />
Within the site, the main access route from Sihlcity Nord and the<br />
central public square are free of motorized traffic and shared by<br />
cyclists and pedestrians (Photo 5). Access from the west is via a new<br />
subway under Saalsporthalle station: this and the southern access<br />
point are linked to existing cycle paths via newly constructed paths.<br />
Access routes for pedestrians and cyclists (Figure 2) are described<br />
in a printed leaflet, and were available to download from the Sihlcity<br />
website until September 2010.<br />
Bicycle lanes in the surrounding area are either on the road,<br />
separated from other traffic by yellow painted lines, or on the pavement<br />
(sidewalks), especially at the busy Sihlcity Nord junction. A<br />
dedicated traffic-free route runs along the river for approximately<br />
one kilometer towards the city centre: detailed printable and audio<br />
guides for leisure walks from the city centre are downloadable from<br />
the Sihlcity website.<br />
Bicycle use is further encouraged through the provision of 600<br />
covered parking spaces in four locations across the site (Photo 6).<br />
Storage Facilities and Home Deliveries<br />
Many people drive to shopping centers because it is usually the<br />
easiest way to transport purchases back home. Sihlcity offers a<br />
number of innovative services to encourage the use of sustainable<br />
modes by shoppers.<br />
Storage lockers of varying sizes are available on-site, with<br />
modest fees of no more than 4 chf for up to six hours. An innovation<br />
demonstrating Sihlcity attention to detail is the provision of lockers<br />
chilled to 12°C, ideal for the storage of fresh and dairy produce.<br />
A bicycle-based delivery service for groceries and other small<br />
items of up to 40 kg is provided through the community association<br />
Züriwerk, which provides opportunities for disabled people in Zurich.<br />
Goods, including chilled perishables, can be left with Züriwerk at any<br />
time between 09:00 and 20:00, avoiding the need to rent a locker,<br />
with the actual delivery taking place at a time of the customer’s<br />
choosing. The standard price is 8 chf to any destination within the<br />
city. Deliveries averaged fifty per day in 2009, up from twenty in<br />
within the first hundred days of opening.<br />
<strong>Car</strong>sharing<br />
Three carsharing vehicles, including one station wagon 4 , are available<br />
to rent from the park & ride area of the car park through Mobility<br />
<strong>Car</strong>sharing Switzerland. The annual membership fee is 290 chf, or<br />
150–190 chf for holders of national or regional annual transit passes.<br />
Members pay between 2.70 and 4.20 chf per hour, and a distance fee<br />
of between 0.25 and 0.92 chf per km, depending on vehicle type and<br />
total distance travelled. Vehicles can be located and reserved online<br />
and by telephone. More information, including eco-driving tips, is<br />
available on the Mobility <strong>Car</strong>sharing website.<br />
This organization offers cars at 190 sites in the City of Zurich, and<br />
at a total of 379 sites in Zurich Canton, putting a large proportion of<br />
the population within easy reach of one. Over 10,000 people hold a<br />
combined ZVV annual public transportation and Mobility membership<br />
pass, for an additional fee of 150 chf, plus the hire charges<br />
outlined above. Interestingly, a separate tariff for infrequent users<br />
is also offered: bundled membership is available for only 25 chf,<br />
with users paying an extra 1 chf per hour when using a vehicle. This<br />
discourages frequent use if a reasonable alternative is available.<br />
Unfortunately the cars are not available for one-way hire, requiring<br />
users to return them to Sihlcity: this implies additional trip generation<br />
rather than substitution. Unsurprisingly, use of these vehicles<br />
is low, with 1,040 recorded trips per day from Sihlcity in 2009, equivalent<br />
to about three trips per day, or one per vehicle (Schmid, 2010;<br />
pers. comm.). Alternatively, members can pick up vehicles in their<br />
own neighborhood, then drive to Sihlcity and back, although they<br />
face the same parking charges as other car users. The marginal effect<br />
3 0.005 kg CO2 / kWh. Source: Ecopassenger (2010).<br />
4 Estate or combi car.
68 Europe’s <strong>Vibrant</strong> <strong>New</strong> <strong>Low</strong> <strong>Car</strong>(<strong>bon</strong>) <strong>Communities</strong><br />
Figure 3: Mode of travel to Sihlcity<br />
100%<br />
modal share by number of trips<br />
80%<br />
60%<br />
40%<br />
20%<br />
private<br />
motorized modes<br />
other modes<br />
0%<br />
2008<br />
2009<br />
De Tommasi, 2008;<br />
De Tommasi, 2009<br />
Table 3: Quantitative comparison of the Sihlcity and Letzipark leisure and retail developments.<br />
Site<br />
Number of<br />
shops<br />
Number of<br />
restaurants<br />
and cafés<br />
Number of<br />
parking<br />
spaces<br />
Cost of<br />
parking for<br />
three hours<br />
Distance to<br />
tram stop<br />
Distance to<br />
rail station<br />
Sihlcity 75 14 850 5 chf 250 m via<br />
traffic-free<br />
route<br />
Letzipark 57 9 1,500 Free 250 m via busy<br />
streets<br />
On-site<br />
800 m<br />
Author’s<br />
elaboration<br />
of Sihlcity carsharing vehicles on travel demand might be negligible,<br />
or even slightly adverse, but the overall impact of membership on<br />
car ownership and vehicle kilometers travelled should be considered<br />
when assessing the efficacy of carsharing. Mobility <strong>Car</strong>sharing<br />
Switzerland has 90,000 members, with an estimated 18,000 fewer<br />
car movements per day as a result (Mobility <strong>Car</strong>sharing Switzerland<br />
website, accessed 15 July 2010).<br />
quantitative analysis<br />
Prior to the opening of Sihlcity, 1,350 people (boarders and alighters)<br />
used Sihlcity Nord tram stop per day. This more than doubled to<br />
an average of 3,100 per day within the site’s first 100 days of business.<br />
User surveys estimated that non-car modes accounted for 70%<br />
and 67% of visitor trips in 2008 and 2009 respectively, comfortably<br />
beating the target of 60% (Figure 3) (Sihlcity, 2010). This compares<br />
with the national figure of 8–9% of shopping trip stages being made<br />
by transit in 2005 (FSO, 2009).<br />
These data are not split further into transit vs, cycling or walking,<br />
but it is likely that transit dominates: City of Zurich statistics reveal<br />
that 64% of all trips involving two or more modes (including walking)<br />
include a transit component (Stadt Zürich Tiefbauamt, 2008).<br />
The car park has spare spaces on weekdays, but fills to capacity<br />
on Saturdays. <strong>Car</strong> users stay for 2.5 hours on average, paying 5 chf<br />
to do so. Of the daily limit of 8,800 car trips allowed under the trip<br />
contingent model, approximately 3,600 were made in 2008. Average<br />
car occupancy is 1.6 persons, consistent with the national figure for<br />
Switzerland. 30% of visitors used a car in 2009, compared with 38%<br />
for all shopping and leisure trips in Switzerland. Although there are<br />
no data available, it is highly likely that car use among Sihlcity workers<br />
is negligible owing to the lack of free allocated car parking.<br />
An interesting comparison may be made with the Letzipark<br />
shopping centre, located 2.5 km to the north-west of Zurich city<br />
centre (Table 3).<br />
Unlike Sihlcity, Letzipark is geared towards serving motorists: a<br />
petrol station and car dealership are located on-site. Public transportation<br />
comprises a radial trolleybus route, an orbital bus route and a<br />
local bus feeding the tram system. Access to high quality rail-based<br />
public transportation is considerably less convenient than in Sihlcity.<br />
More importantly, the Letzipark website (accessed 26 October 2010)<br />
boasts of 1,500 parking spaces, despite its smaller size, which are<br />
free to use for up to three hours. “Women only” bays are located<br />
close to the exits, increasing the attractiveness of multi-story car<br />
parking at night. The “how to get here” pages of each website are<br />
noticeably different: Letzipark’s displays information for car users,<br />
with a separate link to a transit route planner, whereas Sihlcity’s<br />
offers more detailed public transportation information alongside<br />
transit and car route planners. The walking and cycling map shown<br />
in Figure 2 was available on the Sihlcity website (accessed 14 July<br />
2010), but has subsequently been removed.
Sihlcity 69<br />
lessons learned<br />
Encouraging the use of sustainable modes for shopping trips is a<br />
major challenge, especially when bulky or heavy loads are purchased.<br />
Nevertheless, the City of Zurich and Sihlcity have addressed<br />
this issue by (a) using the price and limited supply of parking as the<br />
key policy tool to deter private car use, and (b) providing improved<br />
transit, storage and delivery alternatives that people find convenient<br />
to use. This was facilitated through the planning system, including<br />
the City’s stringent planning regulations for heavily frequented sites:<br />
planning permission was conditional on satisfying accessibility planning,<br />
maximum parking standards and car trip contingent criteria.<br />
This is a model that other cities could adopt as part of their spatial<br />
planning strategies and guidance.<br />
The Sihlcity strategy relies on a large proportion of visitors<br />
already owning one of the many types of integrated transit pass<br />
available (from 1.90 chf per person per day), since the cost of<br />
undiscounted one-day tickets within the city for a family of four<br />
(27.20 chf), plus bicycle-delivery (8 chf), compares poorly with the<br />
3–4 hour parking fee of 7 chf, or 7-hour stay for 15 chf. Although<br />
there are fuel and vehicle maintenance costs to consider, these are<br />
generally perceived by car users to be negligible in terms of marginal<br />
trip costs. The carsharing vehicles on site are a useful back up for<br />
car-free visitors who may have made more or heavier purchases<br />
than anticipated, but do not contribute to a reduction in motorized<br />
vehicle kilometers. A better solution for retail centers might be just<br />
increased availability of taxis and the creation of a taxi stand at a<br />
central location for customers who are too laden down with packages<br />
to take other modes.<br />
The use of non-motorized modes to access Sihlcity is believed<br />
to be relatively low. Possible ways to address this are the use of<br />
personal travel planning and awareness-raising campaigns on site.<br />
Free bicycle trailer hire could also help: this is offered by the British<br />
supermarket chain Waitrose and would be simple to integrate into<br />
the Züriwerk delivery facility.<br />
Expanding the use of low-floor vehicles on transit routes to/<br />
from Sihlcity may help maintain or even expand the already high<br />
number of people who use transit to reach the site. Happily, the<br />
transit agency has a strategy to convert S-Bahn route S4 by 2014 and<br />
eliminate remaining high-floor trolleybuses by the end of 2013 (ZVV,<br />
2008): this will improve accessibility for those laden with shopping<br />
bags and using pushchairs, as well as the elderly and disabled. In<br />
contrast, the key priority for the tram system is expansion, including<br />
the “Glattalbahn” tram network in the north of the city, rather than<br />
the replacement of older vehicles or the addition of low-floor centre<br />
sections to a further batch of “Tram 2000” vehicles. However, the<br />
Swiss Disability Discrimination Act requires that transit buildings<br />
and vehicles be fully accessible to the disabled by the end of 2023<br />
(Federal Office of Transport, 2006).<br />
In terms of the transferability of the Sihlcity experience, a prerequisite<br />
is a comprehensive, frequent, reliable, affordable, clean<br />
and comfortable transit system. Simply increasing the cost of parking<br />
alone is unlikely to be successful, given the availability of alternative<br />
retail and leisure facilities with free or low-cost parking.<br />
sources<br />
Cairns S., Sloman, L., <strong>New</strong>son, C., Anable, J.,<br />
Kirkbride, A. and Goodwin, P. (2004). Chapter<br />
Eight in Smarter Choices: Changing the Way We<br />
Travel. Department for Transport, London.<br />
De Tommasi, R. (2008). Heavily Frequented Sites:<br />
<strong>New</strong> Playgrounds for Mobility Management.<br />
Presentation at the 2008 ECOMM Conference,<br />
London.<br />
De Tommasi, R. (2009). A good example of<br />
integration: Sihlcity, Zürich, Switzerland. Online<br />
presentation for the EPOMM project “MAX:<br />
Successful Travel Awareness Campaigns &<br />
Mobility Management Strategies.”<br />
Ecopassenger (2010). http://ecopassenger.<br />
hafas.de/hafas-res/download/Ecopassenger_<br />
Methodology_Report.pdf (accessed 21 July 2010).<br />
Federal Office of Transport (2006). http://www.<br />
bav.admin.ch/mobile/01244/01258/index.<br />
html?lang=en (accessed 27 October 2010).<br />
FSO (2009). Mobility and Transport: Pocket<br />
Statistics 2009. Swiss Federal Statistical Office,<br />
Neuchâtel.<br />
FSO (2010). http://www.bfs.admin.ch/bfs/portal/<br />
en/index/themen/01/01/key.html (accessed 27<br />
October 2010).<br />
Letzipark: http://www.letzipark.ch<br />
Mobility <strong>Car</strong>sharing Switzerland: http://www.<br />
mobility.ch<br />
SBB (2009). http://mct.sbb.ch/mct/en/konzern_<br />
kennzahlen (accessed 15 July 2010).<br />
Schmid, S. (2010). E-mail correspondence from<br />
Stefan Schmid of Mobility <strong>Car</strong>sharing, received<br />
27 July 2010.<br />
Sihlcity (developer website): http://www.sihlcity.ch<br />
Sihlcity (2008a). http://www.sihlcity.ch/<br />
downloads/medienberichte_de/PR_<br />
Shopping%20Center_Award_17_04_08.pdf<br />
(accessed 8 June 2010).<br />
Sihlcity (2010). http://www.sihlcity.<br />
ch/downloads/medienberichte_de/<br />
Medienmitteilung-Geschaeftsjahr_2009.pdf<br />
(accessed 14 July 2010).<br />
Stadt Zürich (2007). Mobilität und Verkehr 5/2007.<br />
Stadt Zürich Statistik, Zürich.<br />
Stadt Zürich (2008). Wegtypen und<br />
Aktivitätsmuster im Verkehrsraum Zürich.<br />
Datengrundlage Mikrozensus Verkehrsverhalten<br />
2005. Stadt Zürich Tiefbauamt, Zürich.<br />
ZVV (2008). Strategie 2011–2014. Zürcher<br />
Verkehrsverbund, Zurich. http://www.zvv.<br />
ch/export/sites/default/common-images/<br />
content-image-gallery/unternehmen-pdfs/ZVV_<br />
Strategiebericht_farbig2011-2014.pdf (accessed<br />
27 October 2010).<br />
Image credits<br />
Figures 1, 2: Sihlcity.<br />
Photo 1: Andre Lardon via Flickr<br />
Photos 2–4, 6: Simon Field, <strong>ITDP</strong> Europe<br />
Photo 5: Sihlcity<br />
We would like to thank Roberto de Tommasi<br />
for providing additional information.
case study<br />
Stellwerk 60<br />
cologne, germany<br />
Simon Field, <strong>ITDP</strong> Europe
stellwerk 60 site facts<br />
Developer and Architect: Kontrola<br />
Treuhand<br />
Developed Area: 4.2 ha<br />
Total Area: 6.1 ha<br />
Planned Completion: 2011<br />
Population: 750<br />
Density: 123 persons / ha<br />
Net Housing Density: 95 units / ha<br />
Completed Housing Units: 320<br />
Planned Housing Units: 400<br />
Jobs On-site: 0<br />
Distance from City Center: 2.5 km<br />
Parking Spaces/Residence: < 0.3<br />
<strong>Car</strong>s: 60 per 1,000 residents<br />
NMT Mode Share: 26% *<br />
Transit Mode Share: 53% *<br />
Households with <strong>Car</strong>sharing<br />
Membership: 67%<br />
Number of <strong>Car</strong>sharing Vehicles<br />
Available: 17<br />
* by distance travelled
72 Europe’s <strong>Vibrant</strong> <strong>New</strong> <strong>Low</strong> <strong>Car</strong>(<strong>bon</strong>) <strong>Communities</strong><br />
background<br />
Stellwerk 60 is a “car-free” development of 700 homes in the Nippes<br />
district of Cologne, a German city of almost 1 million inhabitants. It<br />
was chosen for this study as an evolution of the Vauban model, with<br />
totally car-free residential streets as well as spatially and fiscally<br />
separated parking. <strong>Car</strong> ownership is 20% of that in the surrounding<br />
neighborhood, and per capita transport-related CO 2 emissions are<br />
half those of the city as a whole.<br />
Built on the site of a former railway repair works, the genesis<br />
of the project was a local citizens’ petition calling for a new type of<br />
residential area for people wanting to live free from the nuisance of<br />
motorized traffic. This led to a master planning competition, with<br />
Kontrola Treuhand selected as sole developer to realize the vision<br />
of a car-free district on a site close to existing services and transit<br />
routes, and within cycling distance of the city center. The development<br />
includes a range of home types and tenures, from apartments<br />
to town houses, for rent or sale on the open market, offering between<br />
61 and 106 m 2 of floor space (Figure 1).<br />
On-street parking is prohibited within Stellwerk 60 and on nearby<br />
residential streets, and the requirement that all car owners pay for<br />
a parking space in a peripheral garage. Non-car owners are required<br />
to sign a legal declaration that they will not bring a car to the site or<br />
attempt to park it in the surrounding area.<br />
planning process<br />
Stellwerk 60 residents began with the intention to create a trafficfree<br />
community. The project took some time to come to fruition owing<br />
to negotiations regarding the unique legal status of Stellwerk 60 as<br />
“car-free housing.” The project could not get a total exemption to<br />
German minimum parking standards, so the developers comprised<br />
on an “optically car-free” plan, with a separate garage providing the<br />
negotiated minimum of 120 parking spaces for 400 planned housing<br />
units, or 0.3 spaces per unit. Special contracts between the developer<br />
and the city, and the developer and residents, were drawn up to<br />
satisfy the planning authority.<br />
The future provision of car parking within the development is<br />
prohibited under a City of Cologne land use plan and building law,<br />
and the interior is officially designated as a pedestrian zone.<br />
key policy and design measures<br />
In addition to the absence of parking within the development,<br />
and the policy requirement for car-owners to purchase a space in<br />
a garage that is physically and financing separated from the<br />
residences, there are several measures that make other modes of<br />
transportation more attractive.<br />
Urban Design<br />
There is a driving and parking ban for motor vehicles developmentwide<br />
(all roads marked in yellow in Figure 1), enforced simply through<br />
the “limited access” model with physical access restrictions at each<br />
of the three entrances (Photo 1). Retractable bollards allow access for<br />
the emergency services and municipal vehicles, but general drop-offs<br />
and deliveries are not permitted. In addition, at around 2.5 m in width<br />
the residential streets are not physically wide enough for parking,<br />
unlike those found in the “parking free” streets of Vauban.<br />
Local shopping facilities, a daily farmers market, a primary<br />
school, kindergarten and hospital are all available within 600 m of<br />
the development, reachable via pleasant residential streets with outdoor<br />
cafés (Photo 2). Small play areas within the site, together with<br />
an adjacent park, mean that travel is not required to reach recreation<br />
and green space.<br />
Figure 1: Stellwerk 60 site plan. <strong>Car</strong>s may not access the streets marked in yellow.
Stellwerk 60 73<br />
In addition, home owners and tenants must sign a legal contract<br />
to indicate that they agree not to (a) drive motorized vehicles within<br />
the development, (b) create parking spaces and (c) park in specified<br />
areas in the surrounding district.<br />
These conditions ensure the entire residential area is completely<br />
free of moving and parked cars, releasing land for recreational space<br />
and significantly reducing the convenience of car ownership.<br />
Parking<br />
State minimum parking standards require that provision be made<br />
for vehicle owners. Since there is no parking within the residential<br />
area of Stellwerk 60, this problem was addressed by providing a<br />
total of 120 spaces in the peripheral car park depicted in Photo 3:<br />
0.2 residents’ spaces per unit, plus 0.1 spaces for visitors. This also<br />
houses six Cambio <strong>Car</strong>sharing vehicles. Under the same planning<br />
rules, which require a minimum of 0.3 spaces per unit, land adjacent<br />
to the car park has been set aside to cater for a possible future upturn<br />
in car ownership.<br />
<strong>Car</strong> owners must purchase a parking space at a cost of 16,000 eur<br />
and pay a maintenance fee of 70–80 eur per month. The high cost of<br />
the parking — set to reflect the true cost of providing such facilities on<br />
valuable urban land — are a significant deterrent to car ownership. At<br />
the time of writing, a total of 45 car parking spaces (56% of the total<br />
for residents) had been sold.<br />
Public Transportation<br />
A dense network of heavy rail routes, the most frequent of which<br />
are branded “S-Bahn,” and Stadtbahn 1 lines form the back<strong>bon</strong>e of<br />
transit provision in Cologne. These routes offer combined S-Bahn<br />
and Stadtbahn frequencies of ten minutes and at least every five<br />
minutes respectively, to the city center and beyond during the daytime<br />
on weekdays (Photo 4). Every home is within 500 m of a stop,<br />
with one bus stop located immediately outside the north entrance<br />
to the site (Photo 5).<br />
An additional outer-orbital Stadtbahn line provides direct services<br />
to key interchange in other parts of the city, removing the need<br />
to make lengthy journeys via the city centre. Three bus routes complete<br />
the local network, including a popular new route direct to the<br />
University. Operating since December 2009, this has been a victim<br />
of its own success, as overcrowding threatens to suppress demand.<br />
Happily, this is likely to be addressed by increasing the peak frequency<br />
in December 2010: it is important that operators or tendering<br />
authorities respond quickly, to avoid turning passengers away.<br />
A timetable is provided at every stop, with the majority offering<br />
comprehensive maps and fare information. All local stops are<br />
unstaffed, but S-Bahn stations feature standard Deutsche Bahn<br />
touch-screen ticket machines. Tickets for journeys commencing by<br />
bus must be purchased on board, and not all bus stops are equipped<br />
with waiting shelters.<br />
All transit services other than the outer-orbital tram offer step-free<br />
access, with lifts to station platforms in good working order when<br />
a site audit was conducted in March 2010. Bicycles can be carried on<br />
transit subject to space and purchase of a separate bike ticket.<br />
1 In Cologne these are light rail routes in tunnel in the central area,<br />
where underground stations are branded “U-Bahn,” with a mix of<br />
segregated and on-street surface running elsewhere. The vehicles<br />
closely resemble conventional trams. Stadtbahn is the generic<br />
term for this type of system.<br />
Cologne is in the Verkehrsverbund Rhein-Sieg (VRS) integrated<br />
public transportation authority area. VRS single trip and period tickets<br />
allow unlimited changes to reach one’s destination within one or<br />
more zones of validity, minimizing the inconvenience of interchange.<br />
Within the large Cologne City zone, fares include:<br />
··<br />
20-minute “short trip”: 1.60 eur;<br />
··<br />
Transferable monthly season: 66.50 eur;<br />
··<br />
Transferable off-peak (after 09:00) monthly season: 46.40 eur.<br />
The monthly passes compare very favorably with the monthly<br />
maintenance fee of at least 70 eur for owners of car parking spaces<br />
in the Stellwerk 60 garage. VRS has a comprehensive website<br />
with timetables, fares, maps and details of how to register for<br />
the purchase of single-trip and one-day tickets by mobile phone<br />
(HandyTickets). A “mobility guarantee” is offered by VRS: a transit<br />
delay of twenty minutes entitles a ticket holder to travel by longdistance<br />
express trains or taxi as appropriate, with a full refund of<br />
additional rail fares incurred, or up to 20 eur in the case of taxi fares.<br />
This provides additional reassurance to intending transit users.<br />
Google Maps includes Cologne U-Bahn and S-Bahn stations, but<br />
no timetable data or any bus information at the present time.<br />
Pedestrian and Cycling Infrastructure<br />
A shared cycle and pedestrian path is provided from the south-west<br />
entrance to Nippes S-Bahn station. Local streets are one-way and/<br />
or traffic-calmed with humps, street furniture or by narrowing,<br />
encouraging the use of non-motorized modes for local journeys, and<br />
many of the former permit contra-flow cycling, maximizing convenience<br />
for cyclists.<br />
Metro Station<br />
(Stadtbahn)<br />
Local Train<br />
Station (S-Bahn)<br />
Bus Stop<br />
<strong>Car</strong>sharing<br />
Bikesharing<br />
Parking<br />
Figure 2: Map of the area surrounding Stellwerk 60<br />
Site Entrance<br />
Bicycle Path<br />
Bicycle Lane<br />
Segregated Walking<br />
and Cycling Path
74 Europe’s <strong>Vibrant</strong> <strong>New</strong> <strong>Low</strong> <strong>Car</strong>(<strong>bon</strong>) <strong>Communities</strong><br />
1<br />
Southwest<br />
entrance to<br />
Stellwerk 60<br />
<strong>Car</strong>s are restricted<br />
with retractable<br />
bollards, which can<br />
allow emergency<br />
vehicle access when<br />
necessary.<br />
2<br />
A public square on<br />
the walking route to<br />
the shopping area on<br />
Neusser Straße.
Stellwerk 60 75<br />
3<br />
The Stellwerk 60<br />
parking garage is<br />
located at the edge<br />
of the development,<br />
making driving less<br />
convenient. Space<br />
in the foreground is<br />
reserved for future<br />
expansion if needed.<br />
4<br />
Every household in<br />
Stellwerk 60 is within<br />
500 m of a transit<br />
stop. Trains have<br />
daytime frequencies<br />
of between 5-10<br />
minutes, making<br />
transit extremely<br />
convenient.
76 Europe’s <strong>Vibrant</strong> <strong>New</strong> <strong>Low</strong> <strong>Car</strong>(<strong>bon</strong>) <strong>Communities</strong><br />
5<br />
Sechzigstraße<br />
bus stop<br />
Street narrowing<br />
serves as an<br />
effective trafficcalming<br />
feature.<br />
6<br />
Cycle parking<br />
outside row<br />
houses
Stellwerk 60 77<br />
7<br />
A Cambio<br />
carsharing<br />
station<br />
Three vehicles were<br />
used within the<br />
course of a 15-minute<br />
site survey.<br />
8<br />
Delivery<br />
vehicles<br />
All motorized traffic<br />
is banned from<br />
Stellwerk 60, including<br />
delivery vehicles,<br />
so the development<br />
offers free “rental”<br />
of human-powered<br />
cargo vehicles for<br />
residents to haul<br />
in goods.<br />
9<br />
Advertising for<br />
the most recently<br />
completed<br />
apartments: “Rental<br />
of exclusive living<br />
space / dreams!<br />
<strong>Car</strong>-free living area –<br />
Stellwerk 60.”
78 Europe’s <strong>Vibrant</strong> <strong>New</strong> <strong>Low</strong> <strong>Car</strong>(<strong>bon</strong>) <strong>Communities</strong><br />
Roads within Stellwerk 60 are for the exclusive use of cyclists<br />
and pedestrians. An average of one cycle parking space is provided<br />
per 30 m 2 of residential floor space, and the vast majority of this is<br />
provided in the form of parking cellars easily accessed by ramps.<br />
Each row house has three racks (Photo 6).<br />
Covered bicycle parking is available at S-Bahn and Stadtbahn<br />
stations, although the short distances from Stellwerk 60 are easily<br />
walkable. The city center is around 10–12 minutes away by bicycle,<br />
along direct routes with a mixture of on-road cycle lanes and paths<br />
shared with pedestrians (Figure 2).<br />
<strong>Car</strong>sharing<br />
Sixteen Cambio <strong>Car</strong>sharing vehicles are available on-site, split between<br />
the general car park and ten spaces adjacent to the north-east entrance<br />
to the development (Photo 7). These include small and medium-sized<br />
cars, as well as small and transit-sized vans. Membership fees are<br />
waived for residents, with discounted usage fees: these vary by<br />
frequency of rental, distance traveled and vehicle class. 2<br />
Interestingly, the rival carsharing firm Flinkster has a single vehicle<br />
2 For more information, see the Cambio <strong>Car</strong>sharing website<br />
stationed adjacent to the main car park. Unlike Cambio, it aims for the<br />
image-conscious market by offering an Alfa-Romeo sports car, albeit<br />
one with a relatively modest 1.4 liter engine. Market differentiation is<br />
likely to be important in broadening the appeal of carsharing.<br />
Deliveries<br />
As previously mentioned, there are very few exceptions to the noaccess<br />
rule for motorized vehicles, presenting quite a challenge for<br />
the delivery of heavy and bulky goods. To address this problem,<br />
a “mobility center” located close to the south-west entrance to the<br />
site has a range of human-powered trolleys and trailers (Photo 8) for<br />
free rental by residents. This service is paid for by the developer on<br />
an ongoing basis. Thus the last leg of every delivery is extremely lowcar<strong>bon</strong>,<br />
and the safe and noise-free nature of Stellwerk 60<br />
is maintained.<br />
Home deliveries of beer and other drinks are made by a supplier<br />
once a week, under a special contract granting access to the development<br />
by motorized van, in return for the waiving of delivery fees normally<br />
payable by customer. This service is slowly increasing in popularity.<br />
Thus far this is the only example of residents accepting a compromise<br />
in the zero-tolerance approach towards motor vehicle access.<br />
Figure 3: Modal split for all trip types<br />
100%<br />
car<br />
80%<br />
public transport<br />
percent of distance travelled<br />
60%<br />
40%<br />
bicycle<br />
walking<br />
20%<br />
0%<br />
Stellwerk 60<br />
Nippes District<br />
Cologne<br />
Mantau, 2010;<br />
Stadt Köln, 2008<br />
Figure 4: <strong>Car</strong> ownership in Stellwerk 60 as compared to surrounding area<br />
600<br />
504<br />
cars per 1000 residents<br />
400<br />
200<br />
60<br />
309<br />
391<br />
412<br />
0<br />
Stellwerk 60<br />
Nippes<br />
Neighborhood<br />
Cologne:<br />
inner city<br />
Cologne:<br />
entire city<br />
Germany<br />
(2008)<br />
EC, 2010;<br />
Mantau, 2010;<br />
Stadt Köln, 2010
Stellwerk 60 79<br />
Marketing<br />
The development is heavily marketed as being car-free, suggesting<br />
that this is regarded as a positive term by the developer and landlords,<br />
rather than indicative of being denied something desirable.<br />
Advertising for the next phase of the development alludes to<br />
the peaceful and relaxing nature of a site free of traffic nuisance<br />
(Photo 9). Although existing “car-free choosers” are drawn to developments<br />
such as Stellwerk 60, given their rarity, the marketing is<br />
likely to be of broad appeal to anyone seeking a better quality of life<br />
(see also Figure 8).<br />
quantitative analysis<br />
We are grateful for access to survey data collected by University of<br />
Cologne student Fabian Mantau. An online survey with a total of<br />
75 questions on actual travel behavior and attitudes towards the<br />
development was launched in April 2010, following the distribution of<br />
flyers to every household in advance. 3 This was done in cooperation<br />
with Autofreie Siedlung Köln, the association that has promoted the<br />
concept and district since 1999. 53 people completed all or most of the<br />
survey, equivalent to a response rate of 16.5% on a household basis.<br />
3 http://www.i.am./car-freeinKoeln (accessed 12 August 2010)<br />
Mantau, 2010<br />
Figure 5: Stellwerk 60 residents: when did you give up your car?<br />
not yet<br />
13%<br />
when<br />
moving to<br />
Stellwerk 60<br />
21%<br />
a long<br />
time ago<br />
38%<br />
never<br />
had one<br />
38%<br />
Modal Split<br />
Mode share data by distance traveled are presented shown in<br />
Figure 3 (data by number of trips are unavailable). More than half<br />
the total distance traveled is by transit, with the bicycle accounting<br />
for a fifth, the same proportion as the car.<br />
Over half of the respondents cited using a bicycle, with railbased<br />
transit as second-most popular choice. This result reflects<br />
the concentration of economic activity in the nearby city center and<br />
in other districts easily reached by bicycle, S-Bahn or Stadtbahn.<br />
62% of residents have a commute of between 2 and 10 km, ideal<br />
for cycling within a typical 30–45 minute travel time budget. In addition,<br />
2% of homes serve as a place of work.<br />
89% and 77% of respondents cycle and walk (respectively) to<br />
shops on a regular basis, suggesting the frequent use of local facilities<br />
rather than weekly shopping runs by car. Cycling plays a pivotal<br />
role in the everyday mobility — and sustainability — of Stellwerk 60<br />
residents.<br />
Vehicle Ownership<br />
96% of respondents have a driving license, meaning that a carfree<br />
lifestyle is a deliberate choice. 71% of Stellwerk 60 households<br />
do not own a car, 29% have one car and no households have<br />
more than one car. In contrast, only 21% of German households<br />
do not have a car (Figure 4).<br />
Stellwerk 60 has achieved a seven-fold reduction in car ownership,<br />
with only 45 registered vehicles among the current population<br />
of 750 residents (Figure 4). In contrast, every household owns at<br />
least one bicycle, with 37% also possessing a bicycle trailer.<br />
Respondents were also asked to indicate when they had given<br />
up “their” car, and provide the reasons for not owning one (Figures 5<br />
and 6). 66% of those sampled had either never owned one (or made<br />
use of a company vehicle) or gave it up “a long time” before moving<br />
to Stellwerk 60.<br />
These percentages are of the subset of residents who have<br />
either given up a car, or intend to do so: a fifth of respondents<br />
disposed of their vehicle around the same time as moving. Figure 5<br />
suggests that two thirds of residents had made a decision to go carfree<br />
independently of moving to the development: Stellwerk 60 has<br />
attracted people who already live car-free. Respondents were asked<br />
to indicate all the factors influencing their decision, from the choice<br />
of answers shown in Figure 6.<br />
Almost 70% of respondents believe that they simply do not need<br />
a car, with around half attributing this to bicycle use and transit<br />
Figure 6: Reasons for Stellwerk 60 residents giving up their carº<br />
a car is not required<br />
bike makes car superfluous<br />
public transport makes car superfluous<br />
altruistic reasons<br />
financial reasons<br />
other<br />
health reasons<br />
0% 20% 40% 60% 80%<br />
percent of respondents<br />
Mantau, 2010
80 Europe’s <strong>Vibrant</strong> <strong>New</strong> <strong>Low</strong> <strong>Car</strong>(<strong>bon</strong>) <strong>Communities</strong><br />
provision. Having an environmental conscience plays a significant<br />
role for 46% of residents.<br />
CO 2 emissions<br />
Per capita CO 2 emissions from private car use in Stellwerk 60 are<br />
64% lower than in the wider district, and 75% lower than the average<br />
for Cologne (Figure 7). The importance of decar<strong>bon</strong>izing public transportation<br />
can be seen from the doubling of Stellwerk 60 residents’<br />
transit emissions, although their overall emissions are significantly<br />
lower — halved compared to the city as a whole — thanks to the<br />
drastic reduction in car use.<br />
Residents’ Views on Stellwerk 60<br />
The survey probed residents’ thoughts on why they moved to<br />
Stellwerk 60 (Figure 8). A safe and pleasant environment for young<br />
families was the most cited reason, followed by a reference to<br />
“green living” and being free from the externalities of car use. When<br />
comparing the development with “elsewhere,” Stellwerk 60 scored<br />
highly in two specific areas: (i) 92% think that Stellwerk 60 sound<br />
levels are either “better” or “very good,” and (ii) 90% regard the<br />
carsharing service to be “better” or “very good.”<br />
With an almost zero-tolerance approach to motor vehicles within<br />
the site, and a choice of 17 carsharing vehicles on offer (as opposed<br />
to one in the 3,000 resident Kronsberg development in Hannover),<br />
these results are easily explainable. Indeed, 67% of respondents use<br />
carsharing vehicles, with a quarter stating that they use the service<br />
several times per month.<br />
However, a majority of respondents indicated that public<br />
transportation, the cycle network and shopping, medical and school<br />
facilities are on a par with other districts. On a negative note, 68%<br />
feel that a better local recreation area is required, with insufficient<br />
green space within the development. This is certainly noticeable<br />
in comparison with Vauban, but it is expected that the green space<br />
north of the parking garage will eventually be improved.<br />
Figure 7: Transport-related CO 2 emissions<br />
1600<br />
residents' land transport-related CO2 emissions<br />
(kg per capita per anum)<br />
1200<br />
800<br />
400<br />
445<br />
301<br />
258<br />
835<br />
225<br />
1238<br />
public transport<br />
private transport<br />
0<br />
Stellwerk 60<br />
Nippes District<br />
Cologne<br />
Mantau, 2010;<br />
Stadt Köln, 2008<br />
Figure 8: Why did you move to Stellwerk 60?<br />
child-friendly environment<br />
makes ecological sense<br />
to live without car noise & air pollution<br />
“carefree” label played a large role<br />
architecture-related<br />
feeling of community<br />
other<br />
interested in something new<br />
financial reasons<br />
ecological construction<br />
personally recommended to us<br />
0% 10% 20% 30% 40% 50% 60%<br />
percent of respondents<br />
Mantau, 2010
Stellwerk 60 81<br />
lessons learned<br />
Stellwerk 60 is a clear success in terms of vehicle ownership, which<br />
is the primary determinant of car use, and modal split. It’s proximity<br />
to local facilities, the city center and the availability of a robust public<br />
transport and cycling facilities make living car-free simple. The development<br />
has its origins in a local group’s determination to live free<br />
from car noise, pollution and danger, suggesting that it is grassroots<br />
demand for radical concepts such as car-free living areas that will see<br />
them rolled out more widely. German planning rules made the visually<br />
intrusive parking garage necessary, but this does offer a choice<br />
for those who want to “have their cake and eat it.” The family-friendly<br />
nature of housing with a car-free or heavily car-reduced immediate<br />
environment is an essential selling point of such developments,<br />
whilst avoiding the high cost of underground parking.<br />
An estimated 20 people signed the car-free declaration but own<br />
a car, which they park in the garage or in neighboring streets that are<br />
not yet part of the Nippes controlled parking zone. This is a source of<br />
irritation to other residents. A possible solution is for parking enforcement<br />
officers in the Nippes controlled parking zone to work with the<br />
residents’ association to patrol the car park. The Stellwerk 60 model<br />
should provide an incentive for the developer, Kontrola Treuhand, to<br />
fund this and other measures required to recover lost revenue.<br />
Is the Stellwerk 60 model transferable? This model requires<br />
grassroots support and intention of a community to live car-free.<br />
However, many of the best practices including proximity to existing<br />
jobs and destinations, provision of high quality transit and cycling<br />
facilities, limiting and spatially separating parking, and designing<br />
narrow streets to discourage driving could all be applied to other<br />
developments, even in less extreme cases.<br />
Specific improvements that could be made at and around this<br />
development, and with respect to transit provision, include:<br />
··<br />
Making better use of the park to the north of the parking<br />
garage, as well as making the land set aside for future car park<br />
expansion more attractive;<br />
··<br />
Improving the attractiveness of the elevated S-Bahn stations,<br />
which suffer from graffiti, poor lighting and a lack of natural<br />
surveillance;<br />
··<br />
Providing more bicycle parking in the shopping area, and more<br />
covered parking at other popular destinations;<br />
··<br />
Enhancing capacity on the new bus service to the University, as<br />
well as on the Stadtbahn in the morning peak period.<br />
Only the first of these is the direct responsibility of the developer,<br />
highlighting the importance of a holistic approach to maintaining<br />
high quality infrastructure and services on- and off-site, requiring<br />
interventions by a variety of actors.<br />
future research recommendations<br />
Further detailed research may help establish the potential demand<br />
for car-free living, and the circumstances that might precipitate it.<br />
This would help to persuade local authorities to consider the concept<br />
more pro-actively, and assuage developers’ fears that developments<br />
of this kind are less profitable. A study examining the re-sale values<br />
of privately-owned homes would add value in this regard, although<br />
anecdotal evidence suggests data would be difficult to acquire, given<br />
low property turnover in Vauban and Stellwerk 60.<br />
The overall effect of Stellwerk 60’s parking management is clear,<br />
but it might be instructive to conduct travel surveys in the neighboring<br />
Lokomotivstraße development: this is of similar size, age and tenure,<br />
but with a conventional street layout and one bundled parking space<br />
per residential unit, mostly located within a few meters of each home.<br />
Such an exercise would provide more evidence for the success of<br />
Stellwerk 60 to be attributed to measures peculiar to the development,<br />
rather than external factors associated with the Nippes district.<br />
sources<br />
ADD-HOME (EU IEE-funded research project):<br />
http://www.add-home.eu<br />
Autofrei Wohnen: http://autofrei-wohnen.de/<br />
proj-d-nippes.html<br />
Autofreie Siedlung Köln: http://www.autofreiesiedlung-koeln.de<br />
Cambio <strong>Car</strong>sharing: http://www.cambiocarsharing.de<br />
EC (2010). Energy and Transport in Figures 2010.<br />
European Commission, Luxembourg.<br />
Flinkster: http://www.flinkster.de<br />
Institut für Verkehrswesen, Universität Karlsruhe<br />
(2008). Panelauswertung 2007. Deutsches<br />
Mobilitätspanel (MOP) — Wissenschaftliche<br />
Begleitung und erste Auswertungen.<br />
Mantau, F. (2010). Unpublished Diploma research<br />
undertaken at Universität Köln.<br />
Nachbarn 60: http://www.nachbarn60.de<br />
Stadt Köln (2008). Mobilitätsentwicklung: Köln<br />
bis 2025.<br />
Stadt Köln (2010a). Die Kölner Stadtteile in Zahlen.<br />
2. Jahrgang 2010.<br />
Stadt Köln (2010b). Statistisches Jahrbuch<br />
2008/2009. Kapitel 4: Verkehr.<br />
Stellwerk 60 (developer website): http://www.<br />
stellwerk60.de<br />
Verkehrsverbund Rhein-Sieg: http://www.<br />
vrsinfo.de<br />
Image credits<br />
Figure 1: Stellwerk 60<br />
Figure 2: Google Maps<br />
Photos 1–9: Simon Field, ITPD Europe<br />
Thanks to Stellwerk 60 resident Hans-Georg<br />
Kleinmann for granting an interview and providing<br />
additional information, Fabian Mantau for sharing<br />
his research data and Christian Dörkes of Stadt<br />
Köln for providing additional statistics.
västra hamnen site facts<br />
Developer: Multiple<br />
Architect: Multiple *<br />
Population: 4,326<br />
Projected Population: 10,000<br />
Developed Area: 76.5 ha<br />
Total Area: 175 ha<br />
Current Density: 56.5 persons/ha<br />
Projected Density: 57.1 persons/ha<br />
Current Residential Units: 2,558<br />
Construction Began: 1998<br />
Planned Completion: 2015<br />
Distance from City Center: 2 km<br />
<strong>Car</strong>s: 440 cars/1,000 residents<br />
Non-motorized Mode Share: 60%<br />
Public Transport Mode Share: 17%<br />
Residents with <strong>Car</strong>sharing: 3%<br />
* Over 20 architects have been involved; some of<br />
the most notable architects include Klas Tham,<br />
Ralph Erskine, and Santiago Calatrava.
case study<br />
Västra Hamnen<br />
malmö, sweden<br />
Nicole Foletta, <strong>ITDP</strong> Europe
84 Europe’s <strong>Vibrant</strong> <strong>New</strong> <strong>Low</strong> <strong>Car</strong>(<strong>bon</strong>) <strong>Communities</strong><br />
background<br />
Västra Hamnen is a brownfield redevelopment which provides a mix<br />
of uses, high quality cycling and pedestrian infrastructure, good<br />
transit access and carsharing, and places an emphasis on mobility<br />
management. Non-motorized transportation use is higher and car<br />
use is lower in Västra Hamnen than in the city as a whole.<br />
Västra Hamnen (the western harbor) has, in a couple of decades,<br />
been transformed from an industrial park into a lively district focused<br />
on knowledge and sustainable living. Since the closing of Kockums<br />
Machine Halls, the district has become home to new parks, swimming<br />
areas, business campuses, schools, and residences. The Västra<br />
Hamnen campus of Malmö University opened in 1998 and three years<br />
later was the opening of the European Home Fair for Bo01. These two<br />
milestones marked the beginning of a new urban district coming to<br />
life in Malmö.<br />
The aim for Västra Hamnen is to become an leading example of<br />
environmental adaptation of a densely built urban district. It will be<br />
a powerful demonstration of Malmö’s commitment to increased environmental<br />
sustainability. The planning, building and construction of<br />
the district was guided by an ecological approach.<br />
The first phase of the Västra Hamnen regeneration project was<br />
called Bo01. The vision for Bo01 was to create a new and modern<br />
mixed use neighborhood, committed to sustainable principles. The<br />
development was featured in the 2001 European Housing Expo. The<br />
350 residential units presented at the Expo were comprised of a mix<br />
of tenures and were built following a set of guidelines for architectural<br />
quality, choice of materials, energy consumption, sustainable<br />
transportation, green issues and technical infrastructure. It has<br />
served as a model for subsequent phases of development in Västra<br />
Hamnen, which have also been constructed following ecological<br />
guidelines and incorporating a sustainability focus.<br />
The most distinctive visual icon of Västra Hamnen is the “Turning<br />
Torso” tower (Photo 1), designed by Spanish architect Santiago<br />
Calatrava. It consists of nine rotating cubes containing 54 floors,<br />
accommodating offices at the bottom, conference facilities at the<br />
top, and in between 147 apartments, twisting 90 degrees from top to<br />
bottom, with a rooftop observation deck. At 190 meters it is the tallest<br />
residential building in the European Union.<br />
Västra Hamnen has received international acclaim, both for its<br />
innovative sustainability features and its striking architecture. It<br />
demonstrates that modern development can both be environmentally<br />
conscious and attractive.<br />
planning process<br />
Västra Hamnen was primarily used as a port and industrial area,<br />
and was home to the Kockums shipyard from the 1990’s until the<br />
late 1970’s when the shipping industry began to decline. In 1979<br />
the Swedish government took over Kockums Machine Halls. By<br />
the 1990’s the city of Malmö began to recognize the potential of<br />
this attractive waterfront area, located close to the city center, and<br />
decided to convert this once industrial zone into a new urbanized district<br />
with a focus on education and sustainable living. It was decided<br />
in connection with Malmö City’s Vision Project in 1994/95 to locate a<br />
new campus of Malmö University in Västra Hamnen. The university<br />
opened in 1998 (Guide Western Harbor 2009).<br />
The Western Harbour facts and figures 2008<br />
Flagghusen<br />
Bo01<br />
The Turning Torso<br />
Dockan<br />
Universitetsholmen<br />
Figure 1: Vasträ Hamnen Neighborhoods
Västra Hamnen 85<br />
The city also decided to build an eco-village as an international<br />
example of sustainable development. The Bo01 project aka the “City<br />
of Tomorrow” was showcased at the 2001 European housing expo.<br />
The primary investors in Bo01 were the national government, the<br />
City of Malmö, and Sydkraft (a regional power company). The City<br />
of Malmö received money from the national government through<br />
a Local Investment Program, covering environmental measures in<br />
Bo01. This money was used for technical systems, soil decontamination,<br />
infrastructure, and educational projects. The European Union<br />
also gave financial support for energy efficiency measures, the EU<br />
required the developers to conduct a scientific evaluation to learn<br />
from Malmö’s experience and share lessons with future projects both<br />
locally and internationally. Ongoing research is still being conducted<br />
on topics as diverse as soil decontamination, traffic, mobility<br />
management, energy efficiency, green structure, storm water reuse,<br />
recycling, and sustainable development (Malmö Stad Website).<br />
Expansion of Bo01 continued after the housing expo, including<br />
construction of the district’s landmark, the HSB Turning Torso tower.<br />
The city authorities regarded a tall building in this location as important<br />
in terms of giving Malmö a new landmark, and therefore granted<br />
the scheme planning permission.<br />
<strong>New</strong>er developments in Västra Hamnen include the residential<br />
neighborhoods of Dockan and Flagghusen and the University District<br />
of Universitetsholmen (Figure 1). These incorporate high density<br />
residential units with businesses, schools, service facilities, parks<br />
and recreational facilities. So far 76.5 ha of the total 175 ha have been<br />
developed, as seen in Table 1. Plans for Västra Hamnen include three<br />
additional residential neighborhoods, in addition to blocks dedicated<br />
to education and training facilities, a conference center and<br />
concert hall, and office buildings. All of these development projects<br />
Table 1: Developed area of Västra Hamnen<br />
Land area (ha)<br />
Bo01 (mixed use neighborhood) 22<br />
Dockan (mixed use neighborhood) 11<br />
Flagghusen (mixed use neighborhood) 4<br />
Universitetsholmen (university district) 21.5<br />
Green space 18<br />
Total developed area 76.5<br />
Total land area of Västra Hamnen 175<br />
City of Malmö<br />
Mälmo Main<br />
Station<br />
Bus Stop<br />
<strong>Car</strong>sharing<br />
Developed<br />
Area<br />
Bicycle<br />
Path<br />
Västra<br />
Hamnen<br />
200 m<br />
1000 ft<br />
Figure 2: Map of Vasträ Hamnen
86 Europe’s <strong>Vibrant</strong> <strong>New</strong> <strong>Low</strong> <strong>Car</strong>(<strong>bon</strong>) <strong>Communities</strong><br />
are being undertaken with a focus on sustainability. The district is<br />
planned to eventually house 10,000 residents and provide facilities<br />
for 20,000 employees and students.<br />
The most recently completed development in Västra Hamnen is<br />
the Flagghusen residential area, which consists of 16 buildings and<br />
more than 600 apartment units. Planning of included a dialogue<br />
between citizens and the developer in order to develop the best<br />
solutions for those involved. Important concerns were safety and<br />
security, reasonable cost of living, low maintenance costs, parking,<br />
energy efficiency, use of non-toxic substances, and local surface<br />
water handling. As a result, Flagghusen has set new standards for<br />
social, economic and ecological sustainability, demonstrating that<br />
Västra Hamnen is continuing to push forward as a modern example<br />
of sustainable development (Guide Western Harbor 2009).<br />
key policy and design measures<br />
Västra Hamnen was planned to minimize future transport needs<br />
and car dependency, in large part by emphasizing cycling. There are<br />
420 kilometers of cycle paths throughout the city of Malmö, which<br />
prides itself on being one of the world’s leading cycling cities. In<br />
Västra Hamnen alone there are 8,185 meters of new cycle paths.<br />
Many improvements have also been made in Västra Hamnen in order<br />
to make public transport more attractive, including the addition of<br />
buses connecting central parts of Malmö with vital areas of Västra<br />
Hamnen (Figure 2). These and other policy and design measures,<br />
discussed below, aim to reduce car dependency of residents and<br />
make Västra Hamnen a quality place to live.<br />
Bicycle and Pedestrian Infrastructure<br />
Västra Hamnen has a focus on promoting cycling and walking<br />
(Photos 2 and 3). Cyclists and pedestrians are given priority in the<br />
Bo01 neighborhood and the area is nearly car-free. Cycling and<br />
pedestrian paths are incorporated throughout the Västra Hamnen<br />
district, including more than 8,185 meters of new cycle paths alone<br />
(Malmö Stad Website).<br />
A long cycling route runs through Malmö from the southern<br />
part of the inner city to Universitetsholmen, the university district<br />
in Västra Hamnen. A variety of innovative features are being tested<br />
along this stretch, aimed at improving bicycle safety and ease of use.<br />
These solutions include rails at traffic lights which cyclists can rest<br />
against so that they do not need to put their foot down, and mirrors<br />
placed at low-visibility intersections so that cyclists can see what<br />
is happening around the corner. Different types of lighting will be<br />
tested along the route to improve night time visibility. In addition,<br />
several mini service stations have been set up where cyclists can<br />
pump air into their tires and carry out simple repairs.<br />
The city of Malmö has even given cyclists priority at thirty traffic<br />
lights across the city. Radar sensors have been fitted at these crossings<br />
to detect approaching cyclists and give them a green light. This allows<br />
cyclists to flow more smoothly in traffic and clearly demonstrates the<br />
city’s commitment to promoting cycling (Malmö Stad 2009).<br />
Public Transport<br />
Västra Hamnen is well served by public transport. At least one bus<br />
stop is located within 300 meters of every apartment, and buses run<br />
at seven minute intervals throughout the day (Photo 4). Many investments<br />
have been made to improve the quality of public transport<br />
in the area. Buses are given priority at traffic lights. Bus stops have<br />
elevated platforms to make boarding faster and easier, and many<br />
stops now have weather protection to make waiting more comfortable.<br />
In addition, over 100 stops across the city are equipped with<br />
electronic timetables so passengers know how long they must wait<br />
for the next bus to arrive (Photo 5). Real-time bus arrival information<br />
is also available on mobile phones using either mobile internet or a<br />
downloadable program.<br />
In addition, from the southern border of Västra Hamnen it is just<br />
one kilometer to Malmö Central Station. This station will be connected<br />
to the Øresund Bridge through the new City Tunnel, which was<br />
scheduled to open in December 2010 and will link train travel north<br />
of the city to southern connection points including Copenhagen. The<br />
City Tunnel will consist of 17 kilometers of railway and 6 kilometers<br />
of tunnel, representing the largest investment in public transport in<br />
Malmö’s history (Malmö Stad Website).<br />
Public transportation in Malmö is run by Skånetrafiken, the<br />
regional public transportation authority and operator in Southern<br />
Sweden. Skånetrafiken uses a zone-based fare system with integrated<br />
tickets between different transport modes and for travel<br />
between southern Sweden and Denmark. Public transit tickets may<br />
be purchased onboard buses, at automated ticket machines in train<br />
stations or at staffed customer service centers. In addition, bus<br />
tickets can be purchased and displayed on mobile phones. In 2009<br />
Skånetrafiken introduced a contactless smartcard called “Jojo.”<br />
Patrons can load transit tickets, monthly travel passes and discount<br />
travel cards onto this smartcard. Children pay a discounted price and<br />
discounts are also available for family members traveling together.<br />
(Skånetrafiken Website)<br />
Efforts have also been made to reduce emissions from buses. In<br />
2003, a pilot project was launched in which two city buses operating<br />
in the area were fueled by a mixture of 8% hydrogen gas from<br />
wind power and 92% vehicle fuel (Guide Western Harbor 2009). The<br />
project was very successful and now a majority of buses in the city<br />
use this fuel mixture. These buses are green in color and promote the<br />
efficient fuel mixture through a message on the bus stating “Gas bus<br />
for a greener and more beautiful Malmö.”<br />
<strong>Car</strong>sharing<br />
In 2005 the city of Malmö started a program (supported by The<br />
CIVITAS Initiative) to introduce carsharing to Malmö. The program<br />
is part of the city’s aim to develop a transport system where citizens<br />
are not dependent on traditional private car ownership for all of their<br />
mobility. Membership in a carsharing organization can eliminate<br />
the need to own a private car and can reduce the number of car trips<br />
taken and vehicle miles traveled. The first Sunfleet <strong>Car</strong>sharing site<br />
was opened in 2005 close to Malmö Central Station. In 2006 the<br />
second carsharing site was established in Västra Hamnen. During<br />
2007 two additional carsharing sites were opened in the inner city. By<br />
the summer of 2008 all five carsharing sites were opened with a total<br />
of 15 cars operating in the city and over 200 members. All of Sunfleet<br />
<strong>Car</strong>sharing’s cars are green vehicles, which either run on natural gas,<br />
biogas or E85 fuel (85% ethanol and 15% petroleum).<br />
A survey found that local awareness of carsharing grew from 28%<br />
in 2003 to almost 47% in 2008. By virtue of the shift from petrol to<br />
green fuels, there appeared to be a reduction in emissions from the<br />
use of carsharing vehicles in Malmö. The emissions reduction estimates<br />
for 2008, based on distance traveled by participating vehicles,<br />
are detailed in Table 2 (The CIVITAS Initiative).
Västra Hamnen 87<br />
Today there are two carsharing locations in Västra Hamnen. One<br />
location is situated next to Bo01 and has seven vehicles. The other<br />
location is in Universitetsholmen and has one vehicle (Figure 1). A<br />
survey in 2010 found that 3% of Västra Hamnen residents have a<br />
carsharing membership (<strong>ITDP</strong> Europe 2010).<br />
Parking<br />
The planners of Västra Hamnen have recognized the importance of<br />
limiting parking in order to reduce car use, however implementation<br />
of this strategy has proved challenging. Parking in the Bo01 development<br />
was limited to 0.7 parking spaces per household, as compared<br />
with the typical Malmö requirement of 1.1 parking spaces per household.<br />
However, local residents’ demand for parking exceeded that<br />
available, indicating that the scheme had ecological expectations<br />
more ambitious than current behavior warranted. Eventually, a multistory<br />
parking garage was built in conjunction with the HSB Turning<br />
Torso (Roberts 2008).<br />
The parking issue was readdressed during the planning process<br />
of Västra Hamnen’s newest neighborhood, Fullriggaren which<br />
requires just 0.75 parking spaces per household. The policy is not<br />
a restriction on the number of parking spaces allowed to be built;<br />
it is a decrease of the number of parking spaces that are required<br />
to be built. It does seem that only 0.75 spaces per household will<br />
be built, at least initially. The passage of this policy is at least one<br />
step towards limiting the number of parking spaces provided in the<br />
district (Magnus Fahl, pers. comm.).<br />
Västra Hamnen also uses parking pricing to discourage excess<br />
driving. The city of Malmö has three parking pricing zones for public,<br />
on-street parking, as outlined in Table 3. Like the city center, the<br />
neighborhoods of Bo01 and Flagghusen are classified as red zones<br />
and therefore have the highest on-street parking fees in the city. The<br />
University District, Universitetsholmen, is classified as a green zone.<br />
The neighborhood of Docken, however, does not have a parking zone<br />
classification and therefore people may park in this neighborhood for<br />
free for up to 24 hours.<br />
Urban Design<br />
Over twenty architectural firms were involved in the design of Västra<br />
Hamnen. Some of the most notable architects include Swedish<br />
architect Klas Tham, architect/planner Ralph Erskine, and innovative<br />
Spanish architect Santiago Calatrava. Klas Tham, in particular, was<br />
instrumental in the development and conceptual plan of the district,<br />
which includes a variety of notable design features.<br />
Street Layout and Design<br />
The street network of Västra Hamnen consists of a mix of individually<br />
designed streets, pedestrian ways, alleyways and open squares<br />
(Photo 6). Swedish architect Klas Tham himself describes the street<br />
layout as a “grid that has been distorted by the wind” (Natural Space<br />
Website). The district generally has a grid street network, however<br />
within the neighborhoods the streets are narrower and take on a<br />
more organic form. Further, the inner area of Bo01 is car-free, consisting<br />
of only pedestrian ways and cycle paths. This structure makes it<br />
easy for cars to cross Västra Hamnen, but provides a safer environment<br />
with reduced car traffic within its various neighborhoods.<br />
Public Space Design<br />
Västra Hamnen has several parks including Ankarparket and<br />
Daniaparken. The planners wanted citizens to be able to walk from<br />
Västra Hamnen to the city center of Malmö through parks and green<br />
spaces. They therefore created Stapelbäddsparken, which beyond<br />
providing a green pedestrian way also acts as an activity center<br />
including cafes, a climbing wall, a skateboard park, and an ecological<br />
playground for children. This mix has made the park a meeting place<br />
for all age groups, offering a broad range of activities promoting the<br />
health and well-being of visitors.<br />
The conceptual planning architect Klas Tham also had the idea<br />
to transform a strip of the waterfront into a promenade. While the<br />
idea was controversial at first, today Sundspromenaden is a popular<br />
place for citizens and visitors to socialize, sunbathe and enjoy the<br />
waterfront views (Photo 7).<br />
Table 2: Emissions reductions from shift to carsharing vehicles in Malmö (2008)<br />
Emissions reductions<br />
Percent reduction<br />
2,530 kg CO 2 42%<br />
1,255 g NOx 60%<br />
15 g PM 10 12.5%<br />
http://www.civitas-initiative.org<br />
Author’s<br />
elaboration<br />
Table 3: Pricing by zone for the City of Malmö<br />
Price per hour<br />
Charging period<br />
Green Zone 10 sek (1.1 €) 09:00 – 18:00 Weekdays<br />
White Zone 15 sek (1.6 €) 09:00 – 18:00 Weekdays<br />
Red Zone 20 sek (2.2 €) 09:00 – 20:00 Weekdays<br />
09:00 – 16:00 Saturdays<br />
Author’s<br />
elaboration
88 Europe’s <strong>Vibrant</strong> <strong>New</strong> <strong>Low</strong> <strong>Car</strong>(<strong>bon</strong>) <strong>Communities</strong><br />
1<br />
Turning Torso<br />
Tower<br />
Västra Hamnen<br />
is known for high<br />
quality urban design<br />
and architecture.<br />
Its most famous<br />
landmark is the<br />
Turning Torso Tower<br />
designed by Santiago<br />
Calatrava.<br />
2<br />
The inner part of the<br />
B001 neighborhood<br />
is completely carfree.<br />
The city built<br />
8 km of new cycle<br />
paths through the<br />
development.<br />
3<br />
Bike parking<br />
near waterfront
Västra Hamnen 89<br />
4<br />
All households in Västra<br />
Hamnen are within<br />
300 m of a bus stop.<br />
5<br />
Buses offer real-time<br />
arrival information at<br />
stations and get priority<br />
at traffic signals.<br />
6<br />
Plaza in<br />
Västra Hamnen<br />
7<br />
Västra Hamnen<br />
waterfront
90 Europe’s <strong>Vibrant</strong> <strong>New</strong> <strong>Low</strong> <strong>Car</strong>(<strong>bon</strong>) <strong>Communities</strong><br />
no ridiculous car journeys<br />
A large number of “ridiculously short car journeys”<br />
(journeys shorter than five kilometers) are made<br />
every day in Malmö. The No Ridiculous <strong>Car</strong> Journeys<br />
campaign aims to encourage people to think about<br />
how they use their cars and to cycle instead of<br />
making these short trips by car. One initiative in the<br />
campaign was a contest to win a bike by providing<br />
the details of a ridiculous car journey made in<br />
Malmö. When the campaign was launched in 2007,<br />
half of all Malmö residents were aware of it, and as<br />
a result, many have since switched their ridiculously<br />
short car trips to bike. No Ridiculous <strong>Car</strong> Journeys<br />
has gained widespread attention, both internationally<br />
and in other Swedish cities. Helsingborg,<br />
Kristianstad and Umeå have already used this<br />
campaign, and more cities are planning to do so. In<br />
Malmö the No Ridiculous <strong>Car</strong> Journeys campaign will<br />
be repeated every spring. (Malmö Stad 2009)<br />
Table 4: Breakdown of residential unit size in Västra Hamnen<br />
Area (ha)<br />
Studio (without kitchen) 11%<br />
1 Room 5%<br />
2 Rooms 30%<br />
3 Rooms 36%<br />
4 Rooms 13%<br />
5+ Rooms 5%<br />
City of Malmö<br />
Building Layout and Design<br />
The architectural firms working in Västra Hamnen were given<br />
freedom of expression to create new, innovative design structures.<br />
One outcome of this is the building layout of Bo01, designed by Klas<br />
Tham, which consists of a row of high-rise (5– 7 story) flats forming a<br />
wall along the sea, creating an effective climate barrier on the southwest<br />
side of the district, with a small scale interior including lower<br />
rise buildings, pedestrian ways and intimate plazas. This mix gives<br />
the area a unique character.<br />
Santiago Calatrava’s HSB Turning Torso tower is another example<br />
of innovative design, not only its appearance, which has won international<br />
acclaim, but also due to its energy efficiency features and<br />
mix of uses.<br />
The housing in Västra Hamnen has a mix of tenures including<br />
tenant-owned apartments, rental apartments and private housing.<br />
This mix guarantees social diversity in the district. The size of residential<br />
units also varies, as seen in Table 4.<br />
Beyond housing, Västra Hamnen contains a mix of uses including<br />
Malmö University, the Kickum Fritid Sports Complex, the Salt<br />
& Brygga restaurant, Orkanen (Malmö’s new Teacher Training<br />
Department), the Malmö Business Incubator (MINC), and many other<br />
businesses, schools, restaurants and other service centers. Overall<br />
the district is home to 262 businesses and employs over 9,000<br />
people (The Western Harbour Facts and Figures 2010). The development’s<br />
expansion plans include additional residential uses, as well<br />
as a focus on education, training and knowledge centers.<br />
Mobility Management<br />
Malmö has recognized that simply building a sustainable development<br />
is not enough; ongoing effort is needed to encourage residents<br />
to adopt sustainable lifestyles. Therefore, Västra Hamnen was<br />
provided with its own Mobility Management office to carry out<br />
travel habit inquiries, develop informational material, and create<br />
campaigns to encourage sustainable mobility habits. One such campaign<br />
was recently carried out in Flagghusen. The project, entitled<br />
“<strong>New</strong> Address — <strong>New</strong> Travel Patterns — Flagghusen,” was based on<br />
a similar project implemented by the Ardeo Centre of Excellence for<br />
the City of Malmö in 2006-2007. The Flagghusen project, conducted<br />
in November-December 2008, consisted of three steps: 1. A welcome<br />
letter was sent by mail to residents, 2. Residents were contacted<br />
by phone, and 3. Mobility advisors provided customized mobility<br />
advice to residents and mailed information based on the telephone<br />
conversation. The phone conversations discussed travel habits,<br />
attitudes towards different modes of transport, car ownership, how<br />
to take advantage of public transit and cycle paths, advantages and<br />
disadvantages of different modes of transport, and information on<br />
carsharing. Results from the previous study found that it is most<br />
effective to approach residents when they are new to a neighborhood<br />
and before they establish travel habits, in order to have a<br />
greater influence on their travel choices. The aim of the project was<br />
to provide tips and ideas on ways to simplify and improve residents’<br />
stay in the neighborhood while taking into account the environment<br />
and other residents.<br />
Residents were given various offers, depending on their travel<br />
choices, in order to encourage them to use more sustainable modes<br />
of transport. For example, those who mainly drive and do not own a<br />
bike were offered a free bike for a month. In addition, those owning<br />
a car or planning to purchase a car were offered a three month free<br />
trial membership to Sunfleet <strong>Car</strong>sharing. Respondents were also<br />
asked what type of mobility information they would be interested<br />
to receive. The most popular item was a map of bicycle paths (69%),<br />
47% wanted information on cycling, 34% wanted eco-driving information,<br />
and 23% wanted information on carsharing. The idea is that<br />
although many residents support the idea of sustainable transport,<br />
many need an extra push or incentive to try a more sustainable<br />
option for the first time. This first step is often the biggest hurdle to<br />
making a change in transport habits (Ardeo 2008).<br />
quantitative analysis<br />
Västra Hamnen is located in Malmö, the third largest city in Sweden.<br />
The city has recognized transport’s role in producing harmful emissions<br />
and has taken many steps to reduce this effect. In particular,<br />
Malmö participated in the CIVITAS SMILE initiative between 2005<br />
and 2009, during which the city implemented several measures<br />
aimed to reduce car dependency, lower hazardous emissions from<br />
city traffic and create a modal shift towards public transport, cycling<br />
and carsharing.
Västra Hamnen 91<br />
Table 5: Västra Hamnen compared to surrounding area<br />
Västra Hamnen<br />
City of Malmö<br />
Population 4,326 290,000<br />
Area (ha) 76.5 * 15,600<br />
Population density (persons/ha) 57 19<br />
Residential units 2,558 146,700<br />
<strong>Car</strong>s per 1,000 residents 440 480<br />
<strong>Car</strong> parking spaces/residential unit 0.8 na<br />
Residents with carsharing membership 3% 2%<br />
Mode share<br />
<strong>Car</strong> 23% 41%<br />
Public transit 17% 16%<br />
Bicycle 31% 23%<br />
Walking 29% 20%<br />
* current developed area<br />
City of Malmö<br />
Table 6: Residential unit densities of various neighborhoods in Västra Hamnen<br />
Land Area (ha)<br />
Population<br />
Number of<br />
Dwellings<br />
Dwelling Unit<br />
Density (units/ha)<br />
Bo01 (including Turning Torso) 22 2,293 1,394 63<br />
Dockan 11 943 547 50<br />
Flagghusen 4 1090 617 154<br />
Total 37 4,326 2,558 69<br />
City of Malmö<br />
Figure 2: Mode of travel for various trip types<br />
100%<br />
car<br />
80%<br />
train<br />
bus<br />
percent of residents<br />
60%<br />
40%<br />
20%<br />
bicycle<br />
walking<br />
VH = Västra Hamnen<br />
(2010)<br />
M = Malmö<br />
(2008)<br />
0%<br />
VH M VH M VH M VH M<br />
work<br />
grocery store other shopping services<br />
<strong>ITDP</strong> Europe 2010 and City of Malmo 2008<br />
Density<br />
The following analysis compares statistics from Västra Hamnen<br />
to the City of Malmö to show that even within a city as ambitious as<br />
Malmö, further reductions in the car<strong>bon</strong> footprint of residents were<br />
possible due to the combination of policy and design measures present<br />
in Västra Hamnen.<br />
Västra Hamnen has a more dense settlement structure than the<br />
City of Malmö (57 persons/ha in Västra Hamnen versus 19 persons/ha<br />
in Malmö), as seen in Table 5. Increased density increases<br />
efficiency of resource use. The density of residential units in various
92 Europe’s <strong>Vibrant</strong> <strong>New</strong> <strong>Low</strong> <strong>Car</strong>(<strong>bon</strong>) <strong>Communities</strong><br />
Figure 3: Mode split for all trips<br />
100%<br />
car<br />
80%<br />
public transport<br />
bicycle<br />
percent of trips<br />
60%<br />
40%<br />
walking<br />
20%<br />
0%<br />
Västra Hamnen<br />
(2010)<br />
Malmö<br />
(2008)<br />
<strong>ITDP</strong> Europe 2010<br />
and City of<br />
Malmo 2008<br />
Figure 4: Distance to work for Västra Hamnen residents (2010)<br />
40%<br />
37%<br />
percent of residents<br />
30%<br />
20%<br />
10%<br />
21%<br />
19%<br />
14%<br />
8%<br />
0%<br />
less than 5km 5–10km 11–25km 26–50km more than 50km<br />
<strong>ITDP</strong> Europe 2010<br />
and City of<br />
Malmo 2008<br />
neighborhoods within Västra Hamnen varies, as seen in Table 6.<br />
The residential unit density in Flagghusen is particularly high at<br />
154 units per hectare.<br />
<strong>Car</strong> Ownership Rate<br />
The car ownership rate is actually quite high in Malmö, and the value<br />
for Västra Hamnen is slightly lower. In Västra Hamnen there are 440<br />
cars per 1,000 residents while in the City of Malmö there are 480 cars<br />
per 1,000 residents.<br />
Mode Split<br />
Figure 2 compares the mode split of various trip types between<br />
Västra Hamnen residents and City of Malmö residents. The Västra<br />
Hamnen values come from an internet-based survey of residents<br />
conducted by <strong>ITDP</strong> Europe (in collaboration with the City of Malmö)<br />
in 2010; the Malmö values are taken from the city’s 2008 resident<br />
travel behavior report. The non-motorized mode share for Västra<br />
Hamnen is higher than the City of Malmö for all trip types. In Västra<br />
Hamnen, 44% of residents commute to work by non-motorized modes<br />
(walking or cycling) versus 36% of Malmö residents. Furthermore, a<br />
smaller percent of Västra Hamnen residents commute by car (33% vs.<br />
45%). Västra Hamnen’s non-motorized mode share for grocery store<br />
trips is only slightly higher than Malmö’s (63% vs. 62%), and Västra<br />
Hamnen’s mode share by car is actually higher (36% vs. 32%). This<br />
demonstrates a potential to shift grocery store trips of Västra Hamnen<br />
residents to more sustainable transport modes. Västra Hamnen’s<br />
non-motorized mode share for other shopping trips is much higher<br />
than for the city of Malmö (79% vs. 46%) and its non-motorized mode<br />
share for service-related trips is higher as well (67% vs. 47%).<br />
Looking at overall trips taken by residents (Figure 3), Västra<br />
Hamnen has a more sustainable mode split than the city of Malmö,<br />
as seen in Figure 3. 41% of trips made by Malmö residents are by<br />
car and only 23% in Västra Hamnen. Further, more trips are made<br />
by bicycle (31%) and on foot (29%) in Västra Hamnen than in Malmö<br />
(23% and 20% respectively). The share of public transport trips is<br />
similar for both.<br />
Distance Traveled<br />
Looking at distance traveled can reveal the potential for using<br />
non-motorized travel modes. People are much more likely to walk
Västra Hamnen 93<br />
or cycle for a trip that is less than 5 km than for a trip that is 25 km<br />
or more. According to the 2010 survey, the average distance to work<br />
for a Västra Hamnen resident is 18 km (Figure 4) and the average<br />
one-way commute time is 30 minutes. Figure 3 shows a breakdown of<br />
travel distance to work for Västra Hamnen residents. More than 35%<br />
of residents travel less than 5 km to get to work. These short travel<br />
distances make it easier for residents to commute by walking, cycling<br />
or public transit. Shorter travel distances also help reduce emissions<br />
generated by motorized forms of transportation. In addition, 27% of<br />
survey respondents stated that they work from home at least one day<br />
per week. Working from home reduces the need to travel and thus<br />
has the potential to reduce emissions.<br />
Residents of Västra Hamnen also do not have to travel far to get<br />
to a grocery store. A third of residents travel less than 500 m to get<br />
to a grocery store and half travel less than 1 km. Based on survey<br />
responses, it is estimated that the average distance a resident of<br />
Västra Hamnen travels to reach a grocery store is 1.2 km. This is not<br />
measuring the distance to the closest grocery store, but rather the<br />
store at which the resident chooses to shop, which may or may not<br />
be the closest store. These short distances make it easy for residents<br />
to travel to the store by foot or bicycle. Furthermore, 4% of survey<br />
respondents stated that they have groceries delivered at least once<br />
per month. Having groceries delivered also has the potential to<br />
reduce emissions.<br />
Luckily, the city of Malmö has recognized this issue and is making<br />
more of an effort to advertise the district specifically as an ecodistrict,<br />
with a focus on reduced car use and ownership. In addition,<br />
a Mobility Management office has been developed to encourage<br />
residents to shift away from car use to more sustainable forms of<br />
transport such as walking, biking and public transport.<br />
<strong>New</strong> sustainable districts in other cities should keep in mind that<br />
residents are attracted by a variety of features, not just environmental<br />
ones. Therefore it is important to market the focus on sustainable<br />
living and reduced car ownership from the beginning and also to<br />
provide an on- going effort (such as a mobility management office) to<br />
encourage sustainable transport habits.<br />
lessons learned<br />
Today Västra Hamnen attracts residents based as much because of<br />
its attractive location near the water and city center and high quality<br />
housing as because of its sustainability features. Therefore, many<br />
new residents own cars and want to use them. This has caused<br />
increased demand for parking and as discussed, although Bo01 was<br />
initially planned as a neighborhood with limited parking, eventually<br />
a multi-story parking garage was built to provide more parking.<br />
Catering to car users and making the district more car-friendly works<br />
in opposition to many of the core goals of the project.<br />
sources<br />
Ardeo (2008). Ny adress — nya resvanor Inflyttade i<br />
Flagghusen Gatukontoret, Malmö.<br />
CIVITAS Initiative website,<br />
http://www.civitas-initiative.org/measure_sheet.<br />
phtml?lan=en&id=246 (accessed July 9, 2010).<br />
CIVITAS SMILE Initiative website, http://<br />
www.civitas-initiative.org/project_<br />
sheet?lan=en&id=1 (accessed July 9, 2010).<br />
Communication with Csaba Gyarmati,<br />
Transportation and Highways Department, City<br />
of Malmö, August 2010.<br />
Communication with Magnus Fahl, Streets and<br />
Parks Department, City of Malmö, May 2010.<br />
Guide Western Harbor (2009). Malmö Stad -<br />
Environmental Department, Malmö.<br />
Roberts, Hanna (2008). Urban Design Best Practice<br />
Case Study — Bo01, Malmö, Sweden. Bo01 City of<br />
Tomorrow, Malmö.<br />
Malmö Stad (2003). Västra Hamnen — The Bo01<br />
Area: A City for People and the Environment,<br />
Malmö.<br />
Malmö Stad (2008). Malmöbornas resvanor och<br />
attityder till trafik och miljö 2008, Malmö.<br />
Malmö Stad (2009). Improving Malmö’s Traffic<br />
Environment, Malmö.<br />
Malmö Stad website, http://www.malmo.se/<br />
English/Western-Harbour.html (accessed July<br />
9, 2010).<br />
Natural Space website, http://www.naturalspace.<br />
com/sweden_broadband/swedentext.htm<br />
(accessed July 9, 2010).<br />
Øresundsbro Konsortiet (2009). Øresundsbron<br />
Annual Report, Copenhagen and Malmö.<br />
The Western Harbour Facts and Figures 2010<br />
(2010). Malmö City Planning Office, Malmö.<br />
Image credits<br />
Figure 1: googlemaps http://maps.google.de/<br />
maps/ms?hl=en&ie=UTF8&vps=2&jsv=298d&<br />
oe=UTF8&msa=0&msid=1164783229907102115<br />
44.0004925639cfb8b3008bf<br />
Figure 2: City of Malmö<br />
Opening spread photo: La-Citta-Vita on Flickr<br />
Photos 1, 6: Simon Field, <strong>ITDP</strong> Europe<br />
Photos 2, 3: Streets and Parks Department,<br />
City of Malmö<br />
Photos 4: Nicole Foletta, <strong>ITDP</strong> Europe<br />
Photo 5: http://www.norden.org/<br />
Photo 6: visitsweden.com, Frederik Tellerup/<br />
Malmö Turism
case study<br />
Vauban<br />
freiburg, germany<br />
Simon Field, <strong>ITDP</strong> Europe<br />
vauban site facts<br />
Developers: Multiple, mainly small<br />
building cooperatives<br />
Architect: Kohlhoff & Kohlhoff<br />
(masterplan)<br />
Construction Began: 1998<br />
Year Completed: 2010<br />
Population: 5,000<br />
Total area: 41 ha<br />
Density: 122 persons / ha<br />
Net Housing Density: 95 / ha<br />
Housing Units: 2,000<br />
Jobs On-site: 600<br />
Distance from City Center: 3 km<br />
Parking Spaces/Residence:
96 Europe’s <strong>Vibrant</strong> <strong>New</strong> <strong>Low</strong> <strong>Car</strong>(<strong>bon</strong>) <strong>Communities</strong><br />
background<br />
Vauban is one of the most celebrated “model sustainable districts,”<br />
comprising 2,000 low-energy homes in an attractive location in the<br />
foothills of the Black Forest in Freiburg, south-west Germany. It is a<br />
car-reduced brownfield redevelopment with parking-free residential<br />
streets: car ownership and use are half that seen in a comparable<br />
reference district.<br />
A bottom-up approach to the planning of Vauban was taken from<br />
the outset, with groups of potential residents (including those who<br />
lobbied for the adopted street design) designing their own homes<br />
on allocated plots of land alongside established developers. This<br />
has resulted in an architecturally diverse and colorful district with a<br />
strong sense of community (Photo 1). With its relatively high density,<br />
high standards of thermal insulation 1 and the use of solar energy,<br />
renewable woodchip district heating, generous green space provision<br />
and communal gardens, Vauban has become a magnet for urban<br />
designers and students of architecture.<br />
Vauban, like Stellwerk 60 in Cologne, limits and separates parking<br />
from the majority of housing units, but car access to residential<br />
streets is permitted for picking up and dropping off (Figure 1).<br />
1 65 kWh/m 2 maximum, with 100 “passive houses”<br />
requiring only 15 kWh/m 2 .<br />
planning process<br />
In 1992 the City of Freiburg held a masterplanning competition for a<br />
new mixed-use eco-suburb on 70 ha of previously-developed land<br />
on the western edge of the city. This became Rieselfeld, a brownfield<br />
redevelopment project with 3 – 5 story energy-efficient buildings,<br />
on-site services and jobs, no through traffic, traffic-calmed streets<br />
and a new tram line, which opened in 1997. The same model was<br />
to be applied to Vauban, a 41 ha site vacated by the French army in<br />
1992. However, a group of local environmental campaigners formed<br />
the association Forum Vauban in an attempt to introduce more radical<br />
design measures into the masterplan, explicitly to deter car use<br />
and create safe streets where children could play safely. This led to<br />
the design of Vauban’s characteristic U-shaped streets off a main<br />
thoroughfare, with no on-street parking in front of homes in the first<br />
and second phases of the development.<br />
A key principle of the Forum Vauban masterplan was that car<br />
use should be less convenient than the alternatives. But planners<br />
where prevented from completely restricting parking because the<br />
Baden Württemberg Land law requires every home to have access to<br />
a parking space. Forum Vauban, negotiated a compromise resulting<br />
in a parking ratio of less than 0.5 per housing unit, with most parking<br />
located in parking garages on the edge of the district. Pricing for the<br />
spaces was based on land value and the cost of construction. A legal<br />
framework to satisfy the City was drawn up, in which residents of<br />
Figure 1: Site plan. Parking-free blocks are in orange and tram route 3 is indicated by a solid blue line.<br />
<strong>Car</strong>-owning residents of the parking-free blocks must park in one of the peripheral garages.
Vauban 97<br />
parking-free streets have to purchase a parking space in one of<br />
two peripheral parking garages, initially costing 16,000 eur plus<br />
a monthly service charge. If residents wish to avoid paying this fee,<br />
they must prove they will not own a car by signing a legal declaration<br />
to that effect. However, in order to comply with State laws, the<br />
development was still required to set aside land to provide for expansion<br />
of parking facilities if future demand requires it. Residents had<br />
to help fund this, to the tune of 3,500 eur. An Association of <strong>Car</strong>free<br />
Living was created to administer this system. To this day the City<br />
of Freiburg does not publicly support the parking-free streets model,<br />
serving as a reminder that such radical initiatives are only likely to be<br />
considered if grassroots campaigns to demand them<br />
are mounted by the electorate.<br />
The architects Kohlhoff & Kohlhoff of Stuttgart blended the<br />
ideas of Forum Vauban into the final masterplan shown in Figure 1. A<br />
lengthy waiting list of potential residents for the parking-free streets<br />
formed rapidly after publication of the final masterplan, but riskaverse<br />
developers were unwilling to invest in such an untested concept,<br />
despite the cost savings associated with not building expensive<br />
underground parking. Forum Vauban was tasked by the City to help<br />
coordinate groups of interested architects, residents and financiers<br />
into building cooperatives (“Baugruppen” in German), each being<br />
sold small plots of land on which to build housing consistent with the<br />
densities and minimum energy standards set out in the masterplan<br />
and Freiburg’s planning regulations. Uptake was enthusiastic, with<br />
this model of development accounting for most of the buildings constructed<br />
in the first two phases of development, which commenced in<br />
1998 and was completed by 2004.<br />
Although most of the original military buildings were demolished,<br />
three were incorporated into the new Vauban: “Haus 37” became a<br />
pub and offices, accommodating Forum Vauban and the Association<br />
for <strong>Car</strong>-free Living; a second block formed part of the student village;<br />
and a third became part of the S.U.S.I. low-cost, communal living (cohousing)<br />
project. Around 10% of all homes are social housing (rented<br />
to low-income residents at below market rates), with the remainder<br />
almost entirely owner-occupied. One part of the first construction<br />
phase was provided with bundled underground parking (grid ref.<br />
B5 in Figure 1), and third phase blocks at the western end of the site<br />
(marked in brown on the map) also include underground and some<br />
on-street parking. Construction was completed in 2010, later than<br />
anticipated owing to the global economic downturn. Although Forum<br />
Vauban has been dissolved, a thriving residents’ association known<br />
as Stadtteil Vauban continues to promote the area and organise<br />
events such as a summer festival.<br />
key policy and design measures<br />
Vauban limits car use through parking-free residential streets,<br />
spatially and fiscally separated parking and filtered permeability<br />
to prevent through traffic. Attractive alternatives include: frequent<br />
rail-based transit system and extensive, high quality non-motorized<br />
transport infrastructure.<br />
Urban Design<br />
Street design<br />
Vauban is fully accessible to private motorized traffic approaching<br />
from the east, but parking is not permitted on the U-shaped streets<br />
freiburg transportation policy<br />
Freiburg’s achievements in sustainable transport since<br />
the 1960s include the exclusion of cars from the historic<br />
city core; an air quality environmental zone since<br />
2010; reduced city centre car parking with fees of up<br />
to 2.20 eur per hour; extensions of the tram system to<br />
Rieselfeld and Vauban; a doubling of local “S-Bahn”<br />
train frequencies; re-building of the main rail station<br />
to include a new transit interchange and 1,000-space<br />
bike storage facility; city-wide 30 km/h or lower speed<br />
limits; and “naked junctions” that force drivers to<br />
negotiate them at low speed.<br />
Freiburgers have elected a Green Mayor since 2002,<br />
suggesting strong local eco-awareness and popular<br />
support for “green” transportation policies (Photo 2).<br />
serving the blocks shown in orange in Figure 1. These roads are<br />
around 4 m in width (including drainage channels) and are signed<br />
“Stellplatzfrei” play streets, meaning “no parking places” (Photo 2).<br />
Vehicles must be driven at walking pace, giving priority to other<br />
road users, and may stop only for the purposes of picking up and<br />
dropping off. The same rules apply to streets around the residential<br />
blocks shown in brown in Figure 1, which are provided with on-site<br />
underground parking. In the absence of parked cars, these roads are<br />
used as social space, especially by children, many of whom can be<br />
seen playing unattended.<br />
A boulevard for pedestrians and cyclists runs along the north<br />
side of Vaubanallee, with a further network of non-motorized traffic<br />
routes on the northern side of the development. Fixed posts prevent<br />
unauthorized access by car users.<br />
Direct access to the neighboring district of St. Georgen from<br />
the western end of Vaubanallee is only possible by non-motorized<br />
modes, preventing through traffic and thus a major source of noise,<br />
air pollution and danger (Photo 3).<br />
Land Use<br />
Residential buildings in Vauban are of four or five stories, with a net<br />
density 2 of approximately 95 units per hectare.<br />
Several large green spaces separate the residential blocks,<br />
providing recreation areas for the many young families in Vauban and<br />
contributing to urban cooling. 3 On the other side of each block are<br />
communal (non-fenced) gardens (Photo 4). 4 Additional greenery and<br />
walking trails adjoin the stream forming the southern boundary of<br />
the site, providing yet another draw for families and minimizing the<br />
need to travel out of the district in search of pleasant recreation areas<br />
(Photo 5).<br />
A supermarket, neighborhood grocery store, two cafés, pubrestaurant,<br />
fast-food take-away, bakery, offices, doctor’s surgery,<br />
2 Inclusive of green and other open space<br />
3 The opposite of the urban heat island effect caused by heat-radiating<br />
hard surfaces<br />
4 A local law entitles all Freiburgers to rent small (off-site) allotment<br />
plots for a low fee
98 Europe’s <strong>Vibrant</strong> <strong>New</strong> <strong>Low</strong> <strong>Car</strong>(<strong>bon</strong>) <strong>Communities</strong><br />
1<br />
Distinctive<br />
architecture and<br />
car-free streets<br />
in Vauban<br />
2<br />
A “play street” where<br />
the primary use is<br />
walking and playing.<br />
Motor vehicles are<br />
permitted but must<br />
travel at walking<br />
speed.
Vauban 99<br />
3<br />
<strong>Car</strong>s are discouraged<br />
from many streets,<br />
and additional greenway<br />
paths make<br />
walking and cycling<br />
even more direct and<br />
convenient.<br />
4<br />
Inner courtyards<br />
and communal<br />
gardens
100 Europe’s <strong>Vibrant</strong> <strong>New</strong> <strong>Low</strong> <strong>Car</strong>(<strong>bon</strong>) <strong>Communities</strong><br />
5<br />
Public space<br />
and bicycle<br />
paths<br />
6<br />
Freighburgh’s tram<br />
system was extended<br />
to Vauban in 2006. All<br />
households are within<br />
400 m of a tram stop.
Vauban 101<br />
7<br />
Tram tracks on<br />
Vaubanallee<br />
Trams run on unpaved<br />
surfaces to help reduce<br />
noise and mitigate<br />
stormwater runoff.<br />
8<br />
Tram and bus stop at<br />
the western entrance<br />
to Vauban, showing<br />
access restrictions,<br />
“bike and ride”<br />
parking and direct<br />
interchange between<br />
bus and tram.
102 Europe’s <strong>Vibrant</strong> <strong>New</strong> <strong>Low</strong> <strong>Car</strong>(<strong>bon</strong>) <strong>Communities</strong><br />
pharmacy and primary school are all located along the main spine<br />
of the development. In addition, an organic supermarket, cosmetics<br />
store and discount supermarket are all located on Merzhauser<br />
Straße. A public square in front of the pub is used for a weekly farmers’<br />
market and community events.<br />
Parking<br />
The overall residential parking space to unit ratio is less than 0.5,<br />
provided with underground and street parking in three parts of the<br />
development, and a total of 470 spaces in two peripheral parking<br />
garages. Residents of the “parking-free” blocks (orange in Figure 1)<br />
must either sign a legal contract with a specially created <strong>Car</strong>-free<br />
Living Association, agreeing not to own a car, or purchase a space<br />
in one of the two garages on the edge of the district. These offer<br />
a total of 470 spaces, each of which currently costs 18,500 eur<br />
(Solargarage) or 22,500 eur (Glasgarage) (Linck, 2010: pers. comm.),<br />
with a further monthly maintenance charge of 70 eur. Almost all<br />
residents of the “parking-free” blocks live closer to a tram stop<br />
than one of the car parks, helping to influence modal choice in carowning<br />
households, especially for short trips. This demand management<br />
effect is reinforced through inner city car parking fees of<br />
up to 2.20 eur per hour.<br />
Public parking for non-residents is available in the form of 220<br />
metered spaces on Vaubanallee and in the garages. Enforcement<br />
of parking and vehicle ownership restrictions is the responsibility<br />
of the <strong>Car</strong>-free Living Association, and thus far has been limited to<br />
taking legal action against two residents known to own a car despite<br />
claiming otherwise.<br />
Parking infractions are not evenly distributed across Vauban,<br />
perhaps reflecting varying levels of community pressure on neighbors<br />
to abide by the rules. Unfortunately the problem is particularly<br />
noticeable in some blocks, where significant numbers of residents<br />
park in front of their homes. The absence of police or local authority<br />
enforcement is thought to be a source of frustration for those who<br />
moved to Vauban for the benefit of an essentially car-free immediate<br />
environment.<br />
Public Transportation<br />
Transit routes to Vauban are summarized in Table 1 below. An extension<br />
of Freiburg’s tram system to Vauban opened in 2006, connecting<br />
the district with the heart of the city and the rail station in 14 and 18<br />
minutes respectively (Photo 6). No home is more than 400 m from a<br />
stop and all trams offer step-free access. Since 2009 the municipal<br />
transit operator has purchased “green energy” to power the tram<br />
system, and many vehicles use regenerative braking to return energy<br />
to the overhead wires for use by other trams. Approximately hourly<br />
night buses operate at weekends, and a longer-distance bus route to<br />
the rural Hexental area runs at least at least every hour seven days<br />
a week. Land has been set aside for a local rail station (grid A2 in<br />
Figure 1), but a lack of capacity means this must wait for the completion<br />
of track doubling on the main line to Switzerland.<br />
Trams run on a grassed central reservation along Vaubanallee<br />
(Photo 7): this contributes to noise reduction and decreases the<br />
amount of impervious surfaces and run-off, it is also aesthetically<br />
pleasing. A shelter, timetable, map and real-time electronic departure<br />
information are provided at all tram stops throughout Freiburg.<br />
Table 1: Transit routes to and from Vauban<br />
Route<br />
Stops<br />
served<br />
Mon – Sat daytime<br />
frequency (mins)<br />
Mon – Sat evening<br />
frequency (mins)<br />
Sun frequency<br />
(mins)<br />
Tram 3 to city center<br />
and rail station<br />
Three stops along<br />
Vaubanallee<br />
7.5<br />
(10 Sat. p.m.)<br />
15 15<br />
Bus 11 to rail station,<br />
conference center, large<br />
IKEA store<br />
Innsbrucker Straße<br />
(at western end<br />
of Vauban)<br />
30<br />
(irregular Sat p.m.)<br />
No service 30<br />
VAG Freiburg<br />
Table 2: Vauban compared to the reference district Rieselfeld<br />
Vauban<br />
Rieselfeld<br />
Population 5,000 9,000<br />
Area (ha) 41 70<br />
Population density (persons/ha) 122 129<br />
Jobs per resident 0.12 0.09<br />
<strong>Car</strong>s per 1000 residents 160 299<br />
<strong>Car</strong> parking spaces/residential unit < 0.5 1.2<br />
Transit journey time to city center (mins) 14 19<br />
Mode share for all trips<br />
<strong>Car</strong> 16% 30%<br />
Public transit 19% * 25%<br />
Bicycle/walking 64% 45%<br />
* prior to opening of the tram extension to Vauban<br />
EC, 2010;<br />
Nobis, 2003;<br />
Stadt Freiburg<br />
Statistics, 2010
Vauban 103<br />
Tickets are available from convenience stores, in-vehicle ticket<br />
machines (coins and some debit cards only) and from tram drivers.<br />
Freiburg has developed a reputation for innovative, low-cost<br />
ticketing since the introduction of transferable monthly passes in<br />
1984, which led to a doubling of transit patronage in the decade that<br />
followed (Fitzroy and Smith, 1998). Fares include:<br />
··<br />
City single ticket, valid for 1 hour: 2.10 eur;<br />
··<br />
24-hour city ticket: 5.30 eur (1 adult and up to 4 children), or 9<br />
eur for up to 5 adults;<br />
··<br />
Transferable monthly season ticket for the Breisgau<br />
region: 47.00 (or 41.10 eur per month as part of an annual<br />
subscription).<br />
A further benefit for RegioKarte holders is free travel for a<br />
second adult on Sundays. These fares are low in absolute terms, and<br />
compare very favorably with the monthly Vauban car park service<br />
charge of 70 eur. In addition, residents in the first parking-free block<br />
to be constructed were given a free annual RegioKarte and national<br />
rail discount pass upon moving in. Transit services and fares are<br />
coordinated by the Regio-Verkehrsverbund Freiburg (RVF) agency,<br />
which has a comprehensive website with timetables, fares, maps<br />
and a sales portal for single-trip and one-day cell phone e-tickets.<br />
“Mobility guarantees” are offered by the municipal transit operator<br />
and RVF, offering free taxi rides in the event of missed connections<br />
and delays.<br />
Pedestrian and Cycling Infrastructure<br />
The district has been designed to make access by non-motorized<br />
modes safe and pleasant, with a dedicated network of streets<br />
free of motorized traffic (described above). Every home has at least<br />
one bike parking space, often in secure cellars accessed by ramps.<br />
A community bicycle repair store offering free labor is located within<br />
the district.<br />
Both the city center and rail station are reachable in about 12 minutes<br />
by bicycle, with good on-road and sidewalk cycle lane provision<br />
(Photo 8). A leafy, lightly-trafficked lane through the city vineyard is a<br />
popular alternative route during the hours of daylight.<br />
<strong>Car</strong>sharing<br />
Twelve carsharing vehicles are available across Vauban, five of which<br />
are located in the solar parking garage. The not-for-profit <strong>Car</strong>-Sharing<br />
Südbaden Freiburg organization offers a total of 80 cars across the<br />
city. Annual membership fees are 350 eur for an individual, or 600<br />
eur per household; usage fees vary by length of rental, distance travelled<br />
and vehicle class, with no hourly fee for overnight use (when<br />
transit service is limited).<br />
A combined transit and carsharing pass known as the<br />
RegioMobil<strong>Car</strong>d offers significant discounts on a range of mobility<br />
services: for an additional 10 eur per month on an annual RegioKarte<br />
subscription, this pass offers:<br />
··<br />
<strong>Car</strong>sharing membership for 200 eur per person, and a 20%<br />
reduction on carsharing usage fees;<br />
··<br />
A 20% discount on bicycle parking and cycle hire from the<br />
“Mobile” bicycle center at the rail station;<br />
··<br />
20% off pre-booked taxis from Taxi Freiburg;<br />
quantitative analysis<br />
This section mainly draws on survey data from May 2002 (Nobis,<br />
2003), post completion of the parking-free blocks but prior to the<br />
opening of the extension of tram route 3 into Vauban. Nobis compared<br />
Vauban with Rieselfeld, a larger but demographically similar<br />
development located 3.5 km from the city center.<br />
A comparison of the two sites (Table 2) is particularly interesting<br />
given the conception of Vauban as “Rieselfeld II,” i.e. with a range of<br />
local services, “play streets” and infrastructure for non-motorized<br />
transport users, but retaining free on-street parking or underground<br />
spaces bundled into the cost of residential units. In contrast to the<br />
Vauban situation, the tram system was extended to Rieselfeld in<br />
advance of redevelopment: today both routes operate at the same<br />
frequencies.<br />
Figure 2: Mode split for all trips<br />
100%<br />
80%<br />
car<br />
transit<br />
NMT<br />
percent of trips<br />
60%<br />
40%<br />
20%<br />
0%<br />
Vauban<br />
Rieselfeld<br />
Freiburg<br />
R+T, 1999;<br />
Scheurer, 2001
104 Europe’s <strong>Vibrant</strong> <strong>New</strong> <strong>Low</strong> <strong>Car</strong>(<strong>bon</strong>) <strong>Communities</strong><br />
Modal Split<br />
<strong>Car</strong> use in Vauban is around 50% of that recorded in the reference<br />
district and the city of Freiburg, with NMT accounting for almost two<br />
thirds of all trips (Figure 2).<br />
Cycling rates stand out as the key difference in travel behavior<br />
among Vauban residents (Figure 3). 5 Across the city as a whole, the<br />
bicycle accounted for 34% of commuter trips in 2002, compared<br />
with 61% and 91% for Vauban’s car-owning and car-free households<br />
respectively. A majority of residents in both groups prefer to do daily<br />
grocery shopping within Vauban, reflecting the excellent provision<br />
of local facilities.<br />
Turning to bulk shopping, one of the most difficult trip types to<br />
shift away from the private car, a car is used for only 6% of trips by<br />
members of car-free households. In contrast, those with access to a<br />
household car make 73% of these trips by car.<br />
Data for the main mode used for leisure trips are shown in<br />
Figure 4 (Freiburg data are from 1999). Individuals without access<br />
to a household car make an impressive 83% of such trips by nonmotorized<br />
means, with significantly greater bicycle use compared to<br />
car-owning Vauban residents and all households in Freiburg.<br />
Only 2% of leisure trips made by residents from car-free households<br />
are by car, clearly demonstrating that car ownership is the primary<br />
determinant of car use. The data are not broken down by transit<br />
pass ownership, but these and the comprehensive local network are<br />
likely to play a significant role in supporting car-free residents’ mobility<br />
in the region and beyond.<br />
Among car owners, 41% use a bicycle more frequently than<br />
before moving to Vauban, but transit use is low, or at least it was prior<br />
to the introduction of tram services in 2006. The findings with respect<br />
to transit use should be treated with caution, since they applied to a<br />
bus service that neither entered the development nor the city center<br />
tram and pedestrian zone, leaving passengers with short walks at<br />
both ends of the journey. Since then, it is likely that some NMT trips<br />
5 Nationally, the bicycle accounted for 2.6% of distance travelled for<br />
all trip purposes in 2004.<br />
have been switched to the tram among both car-owning and car-free<br />
residents, especially in winter.<br />
Vehicle Ownership and <strong>Car</strong>sharing<br />
Considering only the parking-free blocks, approximately 40%<br />
of households do not own a car according to the 2002 survey.<br />
Figure 5 is based on Stadt Freiburg data from January 2010 unless<br />
stated otherwise.<br />
Although Vauban has a greater proportion of low-income residents<br />
and students, this is offset by having twice as many households<br />
with children, a demographic group expected to be car-reliant,<br />
compared with Freiburg. Rieselfeld has succeeded in reducing car<br />
ownership to the level of Freiburg’s inner districts (300 per 1,000<br />
population), but Vauban has almost halved this.<br />
In 2002, 39% of Vauban households were registered with a carsharing<br />
organization, broken down into 59% of individuals in car-free<br />
households and 11% of those in car-owning households. At the time,<br />
only 0.1% of German drivers were carsharing members. In addition,<br />
70% of respondents without a car use carsharing more often than<br />
they did before moving to Vauban.<br />
There is a question of causality: do residents give up their car as a<br />
result of Vauban’s parking concept, or has the decision to live car-free<br />
been made long before moving in? In answer to this, the Nobbys<br />
research revealed that 81% of the inhabitants of car-free households<br />
previously owned a car: 57% gave up their car just before moving to<br />
Vauban. Interestingly, 65% of residents moved to Vauban from elsewhere<br />
in Freiburg (Stadt Freiburg Vauban Website). These statistics<br />
suggest that more than half of those without a car were persuaded<br />
to do so by the unique combination of carrots and sticks offered<br />
by the district.<br />
In summary, the inhabitants of Vauban are enthusiastic walkers<br />
and cyclists, but car-owning residents tend to default to the car for<br />
awkward trips, such as those involving heavy loads, and are more<br />
likely to jump in the car for longer leisure trips beyond the range of<br />
non-motorized modes.<br />
Figure 3: Bicycle use among Vauban residents<br />
100%<br />
80%<br />
Vauban:<br />
car-free<br />
households<br />
percent of respondents<br />
60%<br />
40%<br />
Vauban:<br />
car-owning<br />
households<br />
20%<br />
0%<br />
commuting<br />
daily shopping<br />
bulk shopping<br />
Nobis, 2003
Vauban 105<br />
Transit Use<br />
56% of car-free households in the parking-free area own at least one<br />
RegioKarte transit pass for the region, compared with 47% of carowning<br />
households on parking-free streets and 32% of car-owning<br />
households in the conventional area. In addition, 72% of car-free<br />
Vauban residents and 49% of car-owning residents own a national<br />
rail discount card 6 , as opposed to the national figure of 10% (Nobis,<br />
2003). These findings (prior to the opening of the tram extension<br />
into Vauban) can be interpreted as an indication of the importance of<br />
local transit for day to day mobility, and rail as a substitute for the car<br />
for medium to longer-distance journeys.<br />
6 The national Bahn<strong>Car</strong>d, which at that time cost 120 eur per year and<br />
gave holders a 50% discount on all second class tickets.<br />
Residents’ Views on Vauban<br />
In 2002, 81% of residents from car-free households stated they<br />
found organizing their life without their own car “easy” or “very<br />
easy.” This finding can be attributed to the high quality NMT infrastructure,<br />
the convenience of bicycle use compared with walking to<br />
one of the parking garages, the provision of local services, proximity<br />
to the city center, good regional transit links and the availability of<br />
a carsharing service.<br />
However, 67% of car-owning residents in parking-free streets<br />
reported being dissatisfied with being unable to park outside their<br />
home. Given that almost 60% of parking-free households have a car,<br />
this implies that approximately 40% of these residents considered<br />
Vauban’s advantages to outweigh this inconvenience, but a significant<br />
proportion would like to have “the best of both worlds,” helping<br />
to explain the parking infractions.<br />
Figure 4: Mode split for leisure trips<br />
100%<br />
car<br />
80%<br />
transit<br />
bicycle<br />
percent of residents<br />
60%<br />
40%<br />
walking<br />
other<br />
20%<br />
0%<br />
Vauban:<br />
all households<br />
Vauban: parking-free<br />
households<br />
without a car<br />
Vauban: parking-free<br />
households<br />
with a car<br />
Freiburg:<br />
all households<br />
(1999)<br />
Nobis, 2003;<br />
R+T, 1999<br />
Figure 5: Vauban <strong>Car</strong> ownership as compared to surrounding area<br />
600<br />
504<br />
cars per 1000 residents<br />
400<br />
200<br />
160<br />
240<br />
299<br />
393<br />
0<br />
Vauban:<br />
all households<br />
Vauban:<br />
car-owning households<br />
Rieselfeld Freiburg Germany<br />
(2008)<br />
EC, 2010;<br />
Nobis, 2003;<br />
Stadt Freiburg<br />
Statistics, 2010
106 Europe’s <strong>Vibrant</strong> <strong>New</strong> <strong>Low</strong> <strong>Car</strong>(<strong>bon</strong>) <strong>Communities</strong><br />
lessons learned<br />
Vauban is a success story, with greatly reduced car ownership and<br />
bicycle substitution of routine car trips as tangible benefits of the<br />
policy and design strategies. Key to this is decoupled parking,<br />
meaning both car ownership and habitual use are no longer default<br />
scenarios: 40% of parking-free households do not have a car, and<br />
41% of car-owners use a bicycle more than they did before moving.<br />
The second vital component is the ease with which people can go<br />
about their lives without a car, made possible through the provision<br />
of local services and jobs, proximity to the city center, extensive NMT<br />
infrastructure and good, low-cost regional transit services. In these<br />
circumstances developments such as Vauban can attract people not<br />
pre-disposed to an altruistic car-free lifestyle: 57% of residents<br />
in car-free households gave up their car when they moved to Vauban.<br />
High quality transit should be in place from the outset: a criticism<br />
is that the tram extension had not opened by the time most residents<br />
had moved in, a factor which could have contributed to greater<br />
car ownership and the desire of developers to build later blocks<br />
with bundled parking.<br />
Transferability of the economically and spatially decoupled parking<br />
model into other new developments is possible, although this is<br />
unlikely to be accepted in the absence of carrots of the quality seen<br />
in Vauban and the wider Breisgau region. Masterplanning competitions<br />
have been successful in Vauban and Stellwerk 60, working to<br />
sustainability guidelines developed by local and regional planning<br />
authorities. Both developments have demonstrated that legal barriers<br />
in the form of minimum parking standards can be overcome:<br />
it would help further if these were abolished or could be determined<br />
at the local development plan level. The sale of small plots of<br />
publicly-owned land to several different associations of developers,<br />
architects and potential residents (“Baugruppen”) is a model<br />
that could be replicated elsewhere, helping to mitigate the<br />
unpopularity of and lack of a sense of community in unappealing,<br />
anonymous estates of identical homes.<br />
The dissatisfaction among car-owning residents could be ameliorated<br />
through personalized travel planning, including advice on<br />
how to navigate the transit system, incorporate walking and cycling<br />
into daily routines (including for shopping), and how to plan leisure<br />
trips without a car. Greater marketing for the RegioMobil<strong>Car</strong>d could<br />
be worthwhile, building on the awareness-raising effect of the free<br />
annual RegioKarte issued to residents of parking-free households<br />
upon moving in.<br />
There is a significant and growing problem of illegal parking in<br />
the parking-free streets, which until now has been largely selfpoliced<br />
by residents applying pressure on their neighbors. Formal<br />
warnings should be issued to offenders in the first instance, to avoid<br />
possible future tensions between residents. Legal action may be<br />
required against the small subset of car-owning residents who claim<br />
to live car-free and therefore evade parking fees.<br />
sources<br />
Broaddus, A. (2010). A Tale of Two Eco-Suburbs<br />
in Freiburg, Germany: Parking Provision and<br />
<strong>Car</strong> Use. Paper presented at TRB 2010 Annual<br />
Meeting.<br />
<strong>Car</strong>-Sharing Südbaden – Freiburg: https://<br />
www.car-sharing-freiburg.org/goto/kosten/<br />
(accessed 12 Aug 2010).<br />
EC (2010). Energy and Transport in Figures 2010.<br />
European Commission, Luxembourg.<br />
FitzRoy, F. and Smith, I. (1998). Public transport<br />
demand in Freiburg: why did patronage double in<br />
a decade? Transport Policy 5: 163 – 173.<br />
Freiburg GreenCity: http://www.fwtm.freiburg.de/<br />
servlet/PB/menu/1174649_l1/index.html<br />
Linck, H. (2010). E-mail correspondence received<br />
from Hannes Link (Verein für autofreies Wohnen<br />
e.V.) on 14 September 2010.<br />
Melia, S. (2006). On the Road to Sustainability:<br />
Transport and <strong>Car</strong>-free Living in Freiburg.<br />
University of the West of England.<br />
Nobis, C. (2003a). Bewohnerbefragung<br />
Vauban: Bericht im Rahmen des Projektes<br />
“Umsetzungsbegleitung des Verkehrskonzeptes<br />
im Stadtteil Freiburg-Vauban.” Deutsches<br />
Zentrum für Luftund Raumfahrt e.V., Berlin.<br />
Nobis, C. (2003b). The Impact of <strong>Car</strong>-free Housing<br />
Districts on Mobility Behaviour — Case Study.<br />
In: Beriatos, E., Brebbia, C.A., Coccossis, H.<br />
and Kungolos, A. (eds) (2003). Conference<br />
on Sustainable Planning and Development<br />
pp 701–720. WIT, Dorset.<br />
R+T (1999). Verkehrsentwicklungsplan Freiburg.<br />
Teil A: Problemanalyse. R+T, Freiburg.<br />
Scheurer, J. (2001). Urban Ecology, Innovations in<br />
Housing Policy and the Future of Cities: Towards<br />
Sustainability in Neighbourhood <strong>Communities</strong>.<br />
Murdoch University <strong>Institute</strong> of Sustainable<br />
Transport, Perth.<br />
Stadt Freiburg Statistics: http://freiburg.de/<br />
servlet/PB/menu/1143602_l2/index.html<br />
(accessed 12 August 2010).<br />
Stadt Freiburg Vauban Website:<br />
http://www.freiburg.de/servlet/PB/<br />
menu/1167123_l1/index.html (accessed 12<br />
August 2010).<br />
Stadtteil Vauban: http://www.vauban.de<br />
Umweltbundesamt (2009). Daten zum Verkehr.<br />
Ausgabe 2009. Umweltbundesamt, Dessau-<br />
Roßlau.<br />
URBED: http://www.urbed.com/<br />
VAG Freiburg (municipal transit operator): http://<br />
www.vag-freiburg.de/<br />
Image credits<br />
Figure 1: Stadtteil Vauban (adapted).<br />
Photos 1, 3–8: Simon Field, <strong>ITDP</strong> Europe<br />
Photo 2: Payton Chung
Comparative Analysis 107<br />
building low car(<strong>bon</strong>) communities<br />
Comparative Analysis<br />
Case Study Physical Characteristics<br />
In order to better understand the potential transferability of the<br />
strategies presented in these case studies, it is worth noting some of<br />
the basic characteristics of each of the sites including size, density<br />
and distance from city center. These are shown in Table 1.<br />
Overview of Policy and Design Strategies<br />
These case studies have shown a variety of smart urban growth<br />
strategies to discourage private car use and encourage more<br />
walking, cycling and transit use, many of which could be deployed<br />
in other developments, both old and new. Most of the case study<br />
developments employ several strategies in tandem for maximum<br />
effect. A comparison of the main measures applied at each of the<br />
sites is provided in Table 2. The colorless cells in the table indicate<br />
a best practice approach, the light gray cells indicate a satisfactory<br />
approach and the dark gray cells indicate a poor approach.<br />
Push Measures<br />
The most widely used push measures make parking more difficult<br />
for residents. This can include limiting the parking supply, pricing<br />
parking and spatially separating parking from residential units, making<br />
access to a car less convenient. Decoupling the cost of parking<br />
encourages residents to consider reducing their car ownership, with<br />
physical separation leading to the use of alternative modes, particularly<br />
for short trips where access time to a remote parking facility<br />
would account for a large proportion of the total journey time. Many<br />
of the sites applied all three of these strategies. The city of Houten<br />
stands out as not applying any: parking spaces are readily available,<br />
located near housing and are not priced. It is therefore unsurprising<br />
that the car ownership rate for Houten is among the highest of all<br />
the sites studied.<br />
Pull Measures<br />
The most widely used pull measures include provision of high quality<br />
public transportation, cycling and pedestrian infrastructure, carsharing,<br />
and urban design features. Public transportation provision and<br />
quality of urban design are summarized in Table 2, but are described<br />
more thoroughly in the following sections. Several other innovative<br />
measures such as bikesharing systems and car-free declarations,<br />
were only applied at a handful of sites.<br />
At a minimum all the developments provide safe, segregated<br />
bicycle and pedestrian paths and sufficient bicycle parking facilities.<br />
Sihlcity is rated slightly lower than the other sites mainly because<br />
the site can be difficult to access by bicycle.<br />
All of the sites provide <strong>Car</strong>sharing vehicles. Stellwerk 60 has a<br />
large program with one <strong>Car</strong>sharing vehicle for every 63 residents. The<br />
availability of vehicles is lower in Houten, GMV and Västra Hamnen.<br />
<strong>Car</strong>sharing services are generally geared towards residential areas,<br />
giving citizens access to a car near their home, and therefore it is not<br />
especially useful to consider carsharing in Sihlcity.<br />
Public Transportation<br />
Great, cost-effective, easy to access public transportation is an<br />
important factor in the success of these development. It might<br />
also be one of the most difficult to replicate in other contexts since<br />
the decisions that create the quality and access might happen at<br />
a scale much larger than the individual development. For example<br />
all of the sites considered in this report have transit service with<br />
at least 15 minute frequencies and many have some form of public<br />
transport operating in the area 24 hours per day. While developers<br />
can advocate for these features, these decisions are likely made at a<br />
higher level. Therefore the pre-existence of good transit in the region<br />
may serve as a criteria for siting new developments, while planners<br />
should seek to optimize service to the new development.<br />
Table 1: Summary of site characteristics<br />
Development<br />
Current<br />
population<br />
Total area<br />
(hectare)<br />
Residential<br />
units<br />
Net housing<br />
density +<br />
(units/hectare)<br />
On-site jobs<br />
per resident<br />
Parking<br />
spaces per<br />
residential<br />
unit<br />
Distance<br />
from city<br />
center (km)<br />
Greenwich<br />
Millennium Village<br />
2,310 29 1,095 55 n/a 0.8 9<br />
GWL Terrein 1,400 6 600 100 0.15 0.22 3<br />
Hammarby Sjöstad 17,000 160 8,000 50 0.31 0.65 3<br />
Houten 43,900 820 18,400 22 0.46 1.1 8 *<br />
Sihlcity — 4 0 — — — 2.5<br />
Stellwerk 60 750 6.1 320 95 0 0.3 2.5<br />
Västra Hamnen 4,326 175 2,558 33 2.10 0.8 2<br />
Vauban 5,000 41 2,000 95 0.12 < 0.5 3<br />
+ Number of residential units per hectare of developed land<br />
* Distance from Utrecht city center
108 Europe’s <strong>Vibrant</strong> <strong>New</strong> <strong>Low</strong> <strong>Car</strong>(<strong>bon</strong>) <strong>Communities</strong><br />
Table 2: Overview of sustainable transportation measures used at each site<br />
Development Parking strategy Public transport<br />
Ped/cycling<br />
infrastructure<br />
Greenwich Millennium<br />
Village<br />
Limited, priced, spatially<br />
separated<br />
High provision High quality<br />
GWL Terrein<br />
Limited, spatially<br />
separated<br />
Good provision<br />
High quality, cars<br />
physically excluded<br />
Hammarby Sjöstad Limited, priced High provision High quality<br />
Houten None Good provision High quality<br />
Sihlcity Limited, priced Good provision Good quality<br />
Stellwerk 60<br />
Limited, priced, spatially<br />
separated<br />
Good provision<br />
High quality, cars<br />
physically excluded<br />
Västra Hamnen Limited, priced High provision High quality<br />
Vauban<br />
Limited, priced,<br />
spatially separated<br />
High provision High quality<br />
<strong>Car</strong>sharing Urban design Other<br />
1 vehicle per<br />
1,155 residents<br />
Good quality<br />
Residents association,<br />
sustainable use of resources<br />
1 vehicle per<br />
280 residents<br />
High quality<br />
<strong>Car</strong>-free declaration, umbrella<br />
organization, sustainable use<br />
of resources<br />
1 vehicle per<br />
460 residents<br />
Good quality<br />
Bikesharing, sustainable use<br />
of resources<br />
1 vehicle per<br />
2700 residents,<br />
High quality<br />
Public bikes, employer<br />
contributions, educational<br />
programs<br />
1 vehicle per<br />
6,300 visitors<br />
Good quality<br />
Storage facilities, bicycle delivery<br />
service, smart measures<br />
1 vehicle per<br />
63 residents<br />
Good quality<br />
<strong>Car</strong>-free declaration, mobility<br />
center, marketing, low-energy<br />
homes<br />
1 vehicle per<br />
1,040 residents<br />
Good quality<br />
Mobility management,<br />
sustainable use of resources<br />
1 vehicle per<br />
417 residents<br />
High quality<br />
<strong>Car</strong>-free declaration, smart<br />
measures, residents association,<br />
low-energy homes
Comparative Analysis 109<br />
Table 3: Overview of public transportation provision<br />
Development Type<br />
Peak hour<br />
frequency<br />
(minutes)<br />
Weekday operating<br />
hours<br />
Max distance<br />
to stop<br />
Level<br />
boarding<br />
Real time arrival<br />
information<br />
Priority Smart-card<br />
Greenwich Millennium<br />
Village<br />
Metro 2 – 6<br />
05:30 – 01:00<br />
19.5 hrs/day<br />
1.2 km Yes Yes<br />
Completely<br />
segregated<br />
Bus 5 – 8 24 hrs/day 200 m Yes No Bus only lane Yes<br />
Yes<br />
GWL Terrein<br />
Tram 10<br />
06:00 – 00:00<br />
18 hrs/day<br />
300 m No No Segregated tramway Yes<br />
Bus 10 24 hrs/day 200 m Yes No Bus only lane Yes<br />
Hammarby Sjöstad<br />
Tram 7 – 8<br />
05:30 – 01:00<br />
19.5 hrs/day<br />
400 m Yes Yes<br />
Bus 5 – 7 24 hrs/day 400 m Yes Yes<br />
Segregated bus/<br />
tramway<br />
Segregated bus/<br />
tramway<br />
Yes<br />
Yes<br />
Houten<br />
Train 15<br />
06:00 – 00:30<br />
18.5 hrs/day<br />
1.8 km Yes Yes<br />
Bus 15 24 hrs/day 1.2 km Yes No<br />
Completely<br />
segregated<br />
Bus only lanes, traffic<br />
signal priority<br />
Yes<br />
Yes<br />
Train 10<br />
05:00 – 23:00<br />
18hrs/day<br />
200 m No Partial<br />
Completely<br />
segregated<br />
No<br />
Sihlcity<br />
Tram /<br />
Metro<br />
3 – 4<br />
05:00 – 23:00<br />
18 hrs/day<br />
300 m Partial Partial<br />
Partial segregation,<br />
traffic signal priority<br />
No<br />
Bus 6 – 8<br />
05:00 – 23:00<br />
18 hrs/day<br />
300 m Partial Partial<br />
Limited bus only<br />
lanes<br />
No<br />
Train 10<br />
04:30 – 00:30<br />
20 hrs/day<br />
500 m Yes No<br />
Completely<br />
segregated<br />
Trial national<br />
scheme<br />
Stellwerk 60<br />
Tram 5<br />
05:00 – 00:30<br />
19.5 hrs/day<br />
500 m Partial No<br />
Completely<br />
segregated<br />
No<br />
Bus 10 – 20<br />
06:00 – 22:30<br />
16.5 hrs/day<br />
400 m Yes No None No<br />
Västra Hamnen Bus 5 – 7<br />
05:00 – 00:30<br />
19.5 hrs/day<br />
300 m Yes<br />
Yes,<br />
at some stations<br />
Bus only lanes, traffic<br />
signal priority<br />
Yes<br />
Vauban<br />
Tram 7 – 8<br />
05:15 – 00:30<br />
19 hrs/day<br />
400 m Yes Yes<br />
Mostly segregated,<br />
traffic signal priority<br />
No<br />
Bus 30<br />
05:30 – 20:30<br />
15 hrs/day<br />
600 m Yes Yes None No
110 Europe’s <strong>Vibrant</strong> <strong>New</strong> <strong>Low</strong> <strong>Car</strong>(<strong>bon</strong>) <strong>Communities</strong><br />
Table 4: Overview of smart urban design features<br />
Development<br />
Green space<br />
provision<br />
Public space<br />
provision<br />
Residential<br />
density<br />
Greenwich Millennium<br />
Village<br />
High High High<br />
GWL Terrein High High High<br />
Hammarby Sjöstad High High High<br />
Houten High High Medium<br />
Sihlcity <strong>Low</strong> High —<br />
Stellwerk 60 Medium Medium High<br />
Västra Hamnen High High Medium<br />
Vauban High High High<br />
Ped/cyclist<br />
priority<br />
Medium:<br />
most of the site is<br />
car-free<br />
High:<br />
entire site is car-free<br />
Medium:<br />
many pedestrian<br />
and cycle paths<br />
High:<br />
all streets have<br />
cyclist priority<br />
Medium:<br />
public spaces<br />
are car-free<br />
High:<br />
entire site is car-free<br />
Medium:<br />
Bo01 is car-free,<br />
other areas are not<br />
High:<br />
much of site<br />
is parking-free<br />
Mix of uses<br />
Filtered<br />
permeability<br />
Medium<br />
diversity<br />
Medium<br />
Medium<br />
diversity<br />
High<br />
High diversity <strong>Low</strong><br />
High diversity High<br />
Medium<br />
diversity<br />
<strong>Low</strong><br />
<strong>Low</strong> diversity High<br />
High diversity Medium<br />
High diversity High<br />
Traffic<br />
calming<br />
Medium:<br />
colored pavement,<br />
speed limit<br />
High:<br />
colored pavement,<br />
speed limit, road<br />
narrowing<br />
Medium:<br />
speed limit, road<br />
narrowing<br />
High:<br />
colored pavement,<br />
road narrowing,<br />
speed limit, speed<br />
bumps<br />
Medium: motor<br />
vehicles excluded in<br />
public spaces<br />
High:<br />
motor vehicles<br />
excluded<br />
Medium:<br />
speed limit, road<br />
narrowing<br />
High: speed limit,<br />
road narrowing, tram<br />
priority
Comparative Analysis 111<br />
Table 3 summarizes and compares several public transport<br />
features that can affect system accessibility, quality of service and<br />
ease of use. The colorless cells in the table indicate a best practice<br />
approach, the light gray cells indicate a satisfactory approach and<br />
the dark gray cells indicate a poor approach. Services with a high frequency<br />
and long operating hours ensure that public transport is available<br />
when residents need it, reducing the need to use or own a car.<br />
System Accessibility<br />
Accessibility is characterized by maximum distance to a stop and<br />
availability of level boarding. A maximum walking distance of 250 m<br />
to bus stops, 500 m to tram stops and up to 1 km to rail services<br />
is recommended, but good bicycle infrastructure such as covered<br />
cycle parking can increase the catchment areas significantly. The<br />
furthest distance residents in these case studies would need to<br />
travel to reach a train station is 1.8 km in Houten, and many residents<br />
cycle to get there.<br />
Level boarding of transit vehicles ensures that the mobilityimpaired,<br />
including wheelchair users and passengers with children in<br />
strollers, have easier access to public transport.<br />
Quality of Service<br />
Real time arrival information, transit priority and smartcards improve<br />
the quality of service of public transport systems. Electronic message<br />
boards are provided at transit stops in GMV, Hammarby Sjöstad,<br />
Houten, Västra Hamnen and Vauban providing real time arrival information.<br />
Although most of these signs in Zurich display scheduled<br />
rather than real-time information, reliability and punctuality are both<br />
excellent. Many cities now also provide real time arrival information<br />
online or through cell phone sms messages.<br />
Transit priority increases transit vehicle speeds, and can be<br />
in the form of segregated right-of-way and transit priority at traffic<br />
signals. Transit priority at traffic signals means that public transport<br />
vehicles get a green light or “proceed aspect” as they approach<br />
an intersection.<br />
Finally, smartcards improve quality of service by improving the<br />
ease and speed of payment. Details of other innovative ticketing and<br />
fare systems, such as time-limited single-trip tickets, carnets and<br />
transferable passes, can be found in the individual case studies.<br />
Urban Design<br />
A variety of urban design features were also applied at each of the<br />
sites. Some are more geared towards encouraging walking and<br />
cycling (incorporating high quality design and public space as well<br />
as safety features) while others discourage car use (including the<br />
use of filtered permeability to limit through traffic by vehicles).<br />
A summary and comparison of these features is shown in Table 3.<br />
The colorless cells in the table indicate a best practice approach, the<br />
light gray cells indicate a satisfactory approach and the dark gray<br />
cells indicate a poor approach.<br />
All the sites provided public space including parks, gardens and<br />
green pathways, plazas and children’s play areas.<br />
Most of the sites provide a mix of uses so that residents do not<br />
have to go far to access grocery stores, pharmacies, health care<br />
facilities and even schools. This proximity encourages shorter, nonmotorized<br />
trips. In addition, all of the sites other than Sihlcity have a<br />
relatively high density making walking more attractive and convenient.<br />
All of the sites provide some form of pedestrian or cyclist priority.<br />
The low-car environments provide safer conditions for cyclists and<br />
pedestrians who do not have to compete with cars for use of the space.<br />
Filtered permeability (also known as a “traffic cell” system)<br />
ensures that residents can move from one part of the development to<br />
another more easily by cycling and walking than by car. For internal<br />
area trips, cars must drive circuitously out to a ring road, around, and<br />
Table 5: Mode share and car ownership rates for study sites and reference areas<br />
Mode share (proportion of all trips)<br />
Location by car by transit by bicycle on foot<br />
<strong>Car</strong>s per 1,000<br />
residents<br />
Greenwich Millennium Village 18% 49% 4% 29% 350<br />
Greenwich District 44% 29% 1% 26% 350<br />
GWL Terrein 6% 14% 50% 30% 190<br />
Amsterdam West 20% 18% 32% 30% 310<br />
Hammarby Sjöstad 21% 52% 9% 18% 210<br />
Stockholm Reference District 35% 50% 7% 8% n/a<br />
City of Houten 34% 11% 28% 27% 415<br />
City of Zeist (The Netherlands) 46% 11% 29% 14% 530<br />
Sihlcity: visitor trips 30% 70% (transit, cycling, walking combined) —<br />
Letzipark: visitor trips n/a n/a n/a n/a —<br />
Stellwerk 60 21% * 53% * 31% * 29% * 60<br />
Nippes District 61% * 33% * 3% * 3% * 309 +<br />
Västra Hamnen 23% 17% 31% 29% 440<br />
City of Malmö 41% 16% 23% 20% 480<br />
Vauban # 16% 19% 64% (bicycle/walking combined) 160<br />
City of Freiburg # 30% 18% 28% 24% 393<br />
* Mode share based on distance traveled.<br />
+ Data for the smaller Nippes Stadtteil.<br />
# Mode share data from 1999/2000 (prior to extension of the tram system to Vauban).
112 Europe’s <strong>Vibrant</strong> <strong>New</strong> <strong>Low</strong> <strong>Car</strong>(<strong>bon</strong>) <strong>Communities</strong><br />
Figure 1: Land transport emissions per resident<br />
1600<br />
1400<br />
1200<br />
public<br />
transport<br />
percent of residents<br />
1000<br />
800<br />
600<br />
400<br />
200<br />
private<br />
transport<br />
0<br />
GWL Terrein<br />
Amsterdam<br />
Hammarby<br />
Sjöstad<br />
Stockholm<br />
Stellwerk 60<br />
Cologne<br />
Västra Hamnen<br />
Malmö<br />
Houten<br />
Netherlands<br />
then back, while trips on foot or by bike can be made by very direct<br />
dedicated pathways. This means most trips within the area take less<br />
time by bike than by car, thus encouraging bicycle use. Houten is the<br />
best example of this among the areas reviewed.<br />
Traffic calming measures attempt to encourage vehicles to drive<br />
more slowly, thus providing a safer environment for cyclists and<br />
pedestrians. Traffic calming measures include pavement of a different<br />
color or material, street furniture, street narrowing, speed limits<br />
(with varying levels of enforcement) and speed bumps.<br />
Quantifying Success<br />
As we have shown in each of the case studies individually, these<br />
strategies work. <strong>Car</strong> ownership rates, car usage and transportrelated<br />
emissions are lower in the case study developments than<br />
in comparable areas. It is worth comparing the case studies cities<br />
to each other to further understand the implications of the various<br />
ways measures were applied and what the outcomes were. Table 5<br />
compares mode share and car ownership rate between each case<br />
study site and a reference district, while Figure 1 shows a comparison<br />
of transport-related emissions of five of the case study sites.<br />
<strong>Car</strong> Ownership Rate<br />
The car ownership rate per 1,000 residents varies greatly between<br />
the various sites, from 60 cars per 1,000 residents at Stellwerk 60 to a<br />
high of 415 cars per 1,000 residents in Houten, which has applied fewer<br />
policy and strategies than the other sites studied here. Still, car ownership<br />
in Houten is lower than in many other areas that lack designs or<br />
policies to reduce car use and encourage other forms of transportation.<br />
Mode Split<br />
<strong>Car</strong> ownership is important but we should also ask how often are<br />
people using these cars. People may continue to own cars for longer<br />
trips, but measures can encourage residents to use alternative forms<br />
of transportation for short, everyday trips. For all of the sites, the<br />
private motorized vehicle mode share was less than 35%, meaning<br />
the majority of trips are made by alternative modes. Furthermore, all<br />
of the sites have a lower private motorized vehicle mode share than<br />
reference sites without integrated policy and design measures.<br />
GWL Terrein has an especially sustainable mode share: 30% of<br />
all trips taken by residents are on foot, 50% by bike, 14% by public<br />
transport and only 6% by car. Houten and Västra Hamnen also have<br />
high non-motorized mode shares. In Houten 27% of trips are made<br />
on foot and 28% by bike. In Västra Hamnen 29% of trips are made on<br />
foot and 31% by bike. These results demonstrate that even in areas,<br />
such as Houten and Västra Hamnen, where car ownership is relatively<br />
high, residents may choose to make a majority of trips by nonmotorized<br />
modes. Likewise, among Vauban’s car-owning population,<br />
61% of commuting and daily shopping trips are made by bicycle.<br />
These choices are likely influenced by the comprehensive application<br />
of policy and design measures in these locations. As the analysis of<br />
Houten shows, most trips made within the city appear to be made by<br />
bike or walking. However, the high car ownership rate leads to longer<br />
trips being made by car.<br />
Land Transport Emissions<br />
While mode share gives a general idea of resident travel behavior,<br />
it cannot be used to accurately calculate CO 2 emissions. For five of<br />
the sites studied, data on average distance traveled per mode per<br />
resident were collected. A simple estimate was made of transportrelated<br />
emissions per resident per year by multiplying average<br />
distance traveled per motorized mode (including both private and<br />
public transport) by emissions estimates per passenger-km traveled<br />
for each mode. A more rigorous CO 2 evaluation would consider the<br />
effect of vehicle speed and trip length on the CO 2 emission rate per<br />
PKT, which would reflect the higher CO 2 intensity per PKT for short<br />
motor vehicle trips. Figure 1 shows a breakdown of emissions from<br />
private transport (e.g. cars) and public transport (e.g. bus, train, tram,<br />
metro), and compares emissions between the case study sites and<br />
the city or country in which they are located. From this figure we can<br />
see that there is a relationship between car ownership rate and emissions<br />
from private transport. Private transport emissions are much<br />
lower in GWL Terrein, Hammarby Sjöstad and Stellwerk 60 where car<br />
ownership rates are low, than in Västra Hamnen and Houten, where<br />
car ownership rates are higher. Even though non-motorized mode<br />
share in Västra Hamnen and Houten are high, it appears that residents<br />
drive for many long trips and these vehicle kilometers traveled<br />
increase the car<strong>bon</strong> footprint of residents. Furthermore, transportrelated<br />
emissions per resident are much lower for GWL Terrein,<br />
Hammarby Sjöstad and Stellwerk 60 than for the cities in which they<br />
are located (Amsterdam, Stockholm and Cologne). Transport-related<br />
emissions per resident for Västra Hamnen are similar to those for<br />
Malmö, and emissions for Houten residents are similar to those for<br />
the Netherlands, though a more rigorous CO 2 evaluation method<br />
would likely show slightly greater differences.
Lessons Learned 113<br />
building low car(<strong>bon</strong>) communities<br />
Lessons Learned<br />
This report shows that new developments can be built to facilitate<br />
the use of sustainable transportation, reducing the impacts of traffic<br />
congestion, greenhouse gases and other pollution, and creating the<br />
opportunities for healthier modes of transportation. This chapter<br />
recaps the lessons learned and looks at the larger context for the<br />
success of these projects, the potential for replication of the strategies<br />
used and makes policy recommendations for the future.<br />
lessons for smart urban growth:<br />
policy and design strategies<br />
Lesson 1: Intention is key<br />
These developments were all created with a mandate to reduce<br />
or minimize driving. The reasons for these mandates may vary (to<br />
reduce CO 2 emissions, to limit the traffic impacts of these new developments,<br />
etc.). But the fact they exist helps provide political will for<br />
all of the urban planning and design decisions that followed. These<br />
mandates can be codified using stringent caps on car trip generation<br />
and CO 2 emissions or the relaxation of parking minimums if other<br />
criteria to reduce car demand are met.<br />
Planners can also use the existence of these mandates to require<br />
developers to fund or build transportation infrastructure and services<br />
(including mobility management services) as a condition of<br />
site approval.<br />
These types of developments are likely to require well-organized<br />
grassroots support for the concept from the outset, to demonstrate<br />
demand for this way of living and provide additional political will.<br />
Masterplanning competitions can also foster further buy-in and innovation<br />
in both the built environment and transportation planning.<br />
Lesson 2: Develop neighborhoods designed for walking<br />
and cycling.<br />
This includes creating high quality infrastructure for cyclists and<br />
pedestrians, and also designing a dense network of streets and<br />
paths that make walking and cycling easier.<br />
Walking<br />
Location and density both make walking a more convenient option.<br />
But high quality design, including provision of safe and attractive<br />
walking routes as well as public spaces in which people want to<br />
spend time, is also essential. Vauban features covered arcades for<br />
pedestrians along the central avenue, while the Swedish sites studied<br />
offer waterfront promenades.<br />
All residential streets are for the exclusive use of pedestrians and<br />
cyclists in the car-free sites studied, while GMV, Hammarby Sjöstad,<br />
Sihlcity, Västra Hamnen and Vauban exclude cars from parts of the<br />
site, offering safe, quiet walking routes.<br />
Bicycling<br />
Cycling similarly requires good infrastructure on-site and in the<br />
wider area: on-and off-road cycle lanes, plentiful, secure and covered<br />
cycle parking (including at transit stops, workplaces and shops). <strong>Low</strong><br />
speed limits are essential to encourage on-road bicycle use: a maximum<br />
of 30 km/h is common to many of the case studies permitting car<br />
access, reduced further to walking pace in Vauban’s parking-free residential<br />
streets. Traffic calming through street furniture, speed bumps,<br />
frequent crosswalks and differently colored surfaces reinforces the<br />
message that priority should be given to pedestrians and cyclists.<br />
Filtered permeability is employed in Vauban and Houten, with<br />
the latter taking the concept to its logical conclusion by providing<br />
a fine-grained network of direct, high quality cycle routes (including<br />
dedicated tunnels and roundabouts) that make cycling quicker<br />
than the car for many journeys within the city. Cyclists have priority<br />
on all streets shared with cars and at junctions where cycle-only<br />
streets cross them, and many roads are heavily traffic-calmed with<br />
cars permitted “as guests.” An on-site bicycle workshop with free<br />
servicing is available in Vauban. A bicycle delivery service is offered<br />
in Sihlcity, helping to minimize the need to arrive by car to take<br />
bulky shopping home.<br />
Bicycles can be taken on board transit services in Cologne and<br />
Zurich, and ferries in Stockholm, helping to extend the range of<br />
bicycle-transit trips and encouraging bike use in bad weather.<br />
Lesson 3: Make transit accessible, affordable and attractive.<br />
High quality, conveniently accessible public transportation is key to<br />
encouraging use of this mode over the car. Ideally these facilities are<br />
established in advance of construction of these new developments,<br />
and in some cases, such as Sihlcity, developers may be asked to provide<br />
funding for or construct new stops as part of the overall development.<br />
Residents in all the sites we studied live no further than 500 m<br />
from the nearest transit stop, which are serviced with daytime<br />
frequencies of at least fifteen minutes. Operating hours are long and<br />
comprehensive information is provided at stops. Integrated transit<br />
agencies coordinate timetables and fares in all the case study cities,<br />
ensuring connections are optimized and the “one trip, one ticket”<br />
principle applies. Orbital transit routes in the larger cities provide a<br />
realistic alternative to the car for complex trips other than to/from<br />
the city center. Transit priority measures in and around new developments<br />
maximize service reliability: trams in Cologne, Freiburg,<br />
Stockholm and Vauban run largely on segregated rights of way,<br />
while those in Zurich enjoy priority at junctions through traffic signal<br />
activation. The Millennium Busway allows buses to avoid congestion<br />
as they pass through the GMV area.<br />
And while it is unlikely that any one development can influence<br />
the ticketing and payment systems for an entire transit system, the<br />
availability of smartcards and discount period passes in the areas<br />
studied do help make transit cheaper and more convenient. Recent
114 Europe’s <strong>Vibrant</strong> <strong>New</strong> <strong>Low</strong> <strong>Car</strong>(<strong>bon</strong>) <strong>Communities</strong><br />
innovations such as cell phone e-tickets (in Cologne, Freiburg and<br />
Stockholm) and print-at-home tickets (Zurich) are improving the<br />
transit experience even more.<br />
Providing better options for long distance travel can also help<br />
people give up their private cars. Access to rail is an important<br />
substitute for longer-distance car journeys in the European context:<br />
83% of Stellwerk 60 respondents undertook a long-distance journey<br />
by train within the last three months, and 72% of non car-owning<br />
Vauban residents own a national rail discount card. Although beyond<br />
the scope of this study, this is a factor to consider when assessing the<br />
scale of potential car reduction in new development.<br />
And though these case studies have some of the best transit<br />
conditions, there still room for improvement. In some areas unstaffed<br />
stations with poorly-lit approach routes and evidence of anti-social<br />
behavior such as graffiti make users feel unsafe. It is essential that<br />
transit feel safe, even at night, otherwise people will continue to<br />
drive or take taxis for these trips. Another issue in some of the sites,<br />
is overcrowding on transit at peak times. Planners need to match<br />
demand and capacity or else other measures will be undermined.<br />
prioritize sustainable locations for development, as a pre-requisite<br />
for reducing car use through policy and design measures, preferably<br />
on previously developed land within existing towns and cities. Periurban<br />
development at high densities in medium-size cities is the next<br />
best solution, provided that distances to centers of economic activity<br />
are small. It should be noted that the British “Eco-towns” program<br />
(not studied in this report) received much criticism for failing to<br />
ensure the shortlisted sites were within easy reach of jobs, owing<br />
to their small size and the criterion that they should be physically<br />
separated from existing settlements.<br />
Density<br />
Most of the sites studied are of sufficient size and density to sustain<br />
at least one supermarket, primary school and other vital services, all<br />
of which generate local employment, as well as frequent transit services.<br />
Notably the heavily car-reduced developments of GWL Terrein,<br />
Stellwerk 60 and Vauban have residential densities of around 100<br />
units per hectare, this being made possible in part by building homes<br />
on land that would otherwise be used for parking.<br />
<strong>Car</strong>sharing<br />
<strong>Car</strong>sharing is an intermediate public transport strategy. It is available<br />
in or around all the sites studied: it should be considered a<br />
prerequisite for strategies to reduce private vehicle ownership,<br />
providing residents with a personal motorized transport option for<br />
occasional use. The site with the lowest car ownership (Stellwerk<br />
60 with 60 cars per 1000 residents) also has the highest carsharing<br />
membership rate (67% of households), and provides one carsharing<br />
vehicle per 44 residents. A variety of vehicle types is likely to boost<br />
the popularity of carsharing services. Bundling carsharing membership<br />
with transit passes (offered in Freiburg and Zurich) offers a<br />
complete mobility package for residents without access to a household<br />
car. Discounted membership and/or rental rates can encourage<br />
take up, as practiced in Västra Hamnen. In the absence of a one-way<br />
trip option, the availability of carsharing vehicles in the surrounding<br />
residential areas is more important than on-site cars in major trip<br />
attractors such as Sihlcity.<br />
Lesson 4: Create compact regions with short commutes<br />
and zone new developments for mixed uses.<br />
<strong>New</strong> developments should be planned as closely as possible to existing<br />
job centers and other destinations. Mixed uses (housing, jobs,<br />
leisure facilities, shops, grocery stores, etc.) should be incorporated<br />
into new developments at site selection and masterplanning stage to<br />
minimize travel distances, enabling residents to make routine trips<br />
on foot or by bicycle, with convenient public transportation offering<br />
a realistic alternative to the car. No amount of policy or design measures<br />
will work well if the new development is located far from jobs<br />
and services their residents need.<br />
Location<br />
All of the sites studied are located close to a city center with a high<br />
concentration of job opportunities. GWL Terrein, Hammarby Sjöstad,<br />
Stellwerk 60, Västra Hamnen and Vauban are located within 3 km of<br />
city centers. Houten is 8 km from the city center of Utrecht, its “parent<br />
city.” GMV, the only case study located within a megacity, is 5 km<br />
from the Canary Wharf financial district and around 9 km from the<br />
“City of London” employment zone (the “Square Mile”).<br />
National and regional planning frameworks can be used to<br />
Mixed Land Use<br />
Providing everyday goods and services within walking distance<br />
of residences reduces the need to travel by car. Planning regulations<br />
and guidance can promote or mandate mixed land use as part<br />
of the masterplanning process, as opposed to purely residential<br />
“commuter dormitories” which build in a need for daily travel by<br />
motorized modes. All of the sites studied either provide a mix of uses<br />
on-site or within easy walking distance of the development. Financial<br />
incentives can encourage businesses to locate in new developments,<br />
generating local job opportunities. For example, the City of<br />
Stockholm initially offered subsidies to encourage businesses to<br />
move into Hammarby Sjöstad.<br />
Although most of the case study sites fall short of theoretical selfsustainability<br />
in terms of jobs per resident, efforts have been made<br />
to provide additional on-site jobs in all but the smallest site (Stellwerk<br />
60). In addition, home working has been encouraged through<br />
the provision of “live-work” units and shared, serviced office space.<br />
Lesson 5: Increase mobility by regulating parking and road use.<br />
<strong>Car</strong> ownership and use can be reduced significantly through a<br />
reduction in parking supply, combined with the spatial and fiscal<br />
separation of the parking that is provided. <strong>Low</strong> speed limits, traffic<br />
calming and filtered permeability further decrease the speed and<br />
convenience of car travel. These factors encourage residents to consider<br />
whether car ownership is necessary to meet everyday mobility<br />
needs, and if so whether it is the most convenient mode for local<br />
trips. The provision of carsharing is a prerequisite for any strategy<br />
designed to reduce car ownership.<br />
Parking<br />
All but one of the sites studied limit parking, some to less than 0.5<br />
spaces per residential unit. Houten is the exception, and consequently<br />
has one of the highest car ownership rates.<br />
Parking is managed in these sites via techniques including limiting<br />
parking, pricing parking and separating residential units from car<br />
parking through spatial and/or economic decoupling.<br />
Appropriate pricing for on-street and garage parking can also<br />
encourage visitors to come via sustainable modes. Generally it is<br />
recommended to charge more for on-street parking than for off-street
Lessons Learned 115<br />
parking to encourage long term parkers to park in garages, providing<br />
faster turnover of on-street spaces.<br />
Spatially separating parking spaces from residential units makes<br />
car use less convenient in general, and particularly so for short trips<br />
that can easily be made by walking or bicycling. This is a key strategy<br />
for the car-free developments of GWL Terrein, Stellwerk 60 and<br />
Vauban, in which all parking is located on the side of the development,<br />
away from residences. As a result, most residents actually live<br />
closer to a public transit stop than the peripheral parking garage.<br />
Economically decoupling parking spaces from residential units<br />
by requiring residents to purchase parking spaces separately from<br />
housing units, makes residents aware of the actual land value<br />
of parking spaces, and may discourage them from owning a car.<br />
Parking spaces must be purchased or rented in GMV, Stellwerk 60<br />
and Vauban. These fees are unbundled from property/apartment<br />
rental prices, with upfront costs of up to 22,500 eur per car, and an<br />
additional monthly service charge of around 70 eur (more than the<br />
cost of a monthly transit pass) in the German case study sites. Legal<br />
frameworks for the effective enforcement of parking restrictions are<br />
likely to be required if the German “car-free declaration” model, in<br />
which an exemption from having to pay for parking is granted only for<br />
those without a car, is to be adopted elsewhere.<br />
In most of the other sites studied, residents may park in the surrounding<br />
area by purchasing a residential parking permit. The price<br />
of residents’ parking permits can be set to discourage vehicle ownership,<br />
and controlled parking zones or other measures are required<br />
to prevent car owners parking in adjacent areas.<br />
Access Restrictions<br />
Restricting car access is another strategy to deter car use. Most<br />
of the sites studied have at least part of the development that is<br />
car-free. GWL Terrein and Stellwerk 60 are entirely car-free: no cars<br />
are permitted on-site. These sites have avoided Vauban’s problem<br />
of illegal parking in “parking-free” streets by making internal paths<br />
narrower and physically barring access to almost all motor vehicles.<br />
Deliveries in Stellwerk 60 are made using a variety of free-to-hire<br />
human-powered carts and trolleys. Through traffic is prevented in<br />
Vauban by providing access to motor vehicles at only one location,<br />
whereas pedestrians and cyclists may reach neighboring districts<br />
directly via several access points.<br />
Push Measures in the Wider Area<br />
<strong>Car</strong> use can also be discouraged through pricing and access restrictions<br />
in the wider area. Examples covered in the case studies include<br />
indirect driving routes in Houten, the exclusion of cars in Freiburg’s<br />
historic city centre, the central London and Stockholm congestion<br />
charges and expensive, limited parking in London and Amsterdam (5<br />
eur per hour in central Amsterdam). Common to all these policies is<br />
a reduction in the convenience of the automobile, whether this is in<br />
terms of time, trip costs or the availability of parking.<br />
Lesson 6: Educate and inspire.<br />
Ongoing marketing and travel awareness campaigns complement<br />
the provision of NMT and transit infrastructure and services, by<br />
promoting sustainable travel behavior in the long-term, especially<br />
where car ownership has not been reduced significantly. Sihlcity and<br />
the city transit operator joined forces to promote the new tram and<br />
bus services through posters in/on vehicles and at stops, as well as<br />
on the transit agency and developer websites.<br />
Customized mobility advice is provided in Malmö, reinforced<br />
through incentives such as free bicycle use and discounted carsharing<br />
membership, and residents of the first parking-free block to be<br />
built in Vauban were given free annual transit passes and rail discount<br />
cards upon moving in. Such “smart measures” are particularly<br />
effective if initiated when residents move into a new district, as this is<br />
the period in which people are receptive to change. It is much harder<br />
to change travel behavior once residents have developed a routine of<br />
habitual car use.<br />
Lesson 7: These developments work best in places where the<br />
larger policy and transportation context can support them.<br />
Transportation policies at the city, regional and national levels play<br />
a key role in shaping daily travel behavior and residential location in<br />
the longer-term. Congestion charges, priced and limited parking at<br />
destinations, high fuel prices, access restrictions, filtered permeability<br />
and high quality transit all influence modal choice, reinforcing<br />
site-specific measures. All of the case study cities are served<br />
by national railroad systems, providing an alternative to the car<br />
for longer-distance journeys, thereby complementing measures to<br />
discourage car ownership and use in the local area. This is discussed<br />
more below.<br />
mechanisms for the delivery of<br />
policy and design measures<br />
Role of the Planning System in Integrating and Financing<br />
Planning regulations facilitate or impede sustainable transportation<br />
measures, such as NMT infrastructure, transit improvements and<br />
reductions in car parking standards, as our case studies have shown.<br />
Two of the sites stand out for the use of formal mechanisms for<br />
the integration of more sustainable transportation policies into new<br />
developments: Planning Obligations (Section 106 Agreements) in<br />
England and accessibility planning criteria in Swiss City and Canton<br />
development plans. The former were introduced in the Town and<br />
County Planning Act of 1990, facilitating negotiations between local<br />
planning authorities and developers to offset the negative impacts<br />
of new development, such as the loss of green space and traffic<br />
generation. This system is used to obtain financial or in-kind contributions<br />
“directly related to the scale and nature of development”<br />
from developers. It is typically used to deliver access roads and other<br />
infrastructure such as parks, bicycle parking, community centers and<br />
even schools, as well as revenue support for new transit services and<br />
funding for smart measures such as personalized travel planning.<br />
Full planning permission is granted only upon the completion of<br />
these Section 106 negotiations.<br />
The Zurich approach combines regional spatial planning criteria<br />
to select the most appropriate sites for development, together<br />
with car parking reduction factors based on the type of development,<br />
proximity to the city center and transit accessibility. Further<br />
conditions can be imposed on developers, namely requirements to<br />
enhance local transit and NMT infrastructure, provide funding for<br />
new transit services and charge for car parking. Additional incentives<br />
for developers to promote alternatives are provided by the Zurich<br />
access contingent model, capping the maximum number of car trips<br />
permitted: this has resulted in high parking costs at Sihlcity (based<br />
on the predicted elasticity of demand), and the prioritization of
116 Europe’s <strong>Vibrant</strong> <strong>New</strong> <strong>Low</strong> <strong>Car</strong>(<strong>bon</strong>) <strong>Communities</strong><br />
printed and website information for access by non-car means.<br />
In contrast, minimum parking standards at the federal and<br />
regional levels thwarted attempts to eliminate parking from Vauban<br />
and Stellwerk 60, requiring the development of legal agreements to<br />
reassure planning authorities that parking would not be displaced<br />
to neighboring districts. This in turn has necessitated the creation<br />
of legal bodies to administer and, in theory, enforce the “car-free<br />
declarations” that forbid personal car ownership.<br />
The Netherlands’ Vine Program for sustainable new growth<br />
lays out some principles that align with sustainable transportation<br />
policies, such as promotion of mixed use development, accessibility<br />
of urban facilities by NMT or public transit, housing densities and<br />
conservation of green space. However, the program provides no<br />
regulations for pricing or limiting parking. As a result, Vine Locations<br />
such as Houten do not make an attempt to restrict parking.<br />
Participatory Planning<br />
Residents and potential residents can also play a large part in shaping<br />
car-free or car-reduced developments. GWL Terrein, Stellwerk<br />
60 and Vauban all had citizen involvement from initial masterplan<br />
consultation through to the creation of lobby groups to influence the<br />
masterplanning process, and even voluntary car-free declarations,<br />
as was the case in GWL Terrein. This grassroots pressure is important<br />
to supporting (or sometimes pushing) planning authorities to<br />
reduce and decouple of parking. For example, the City of Freiburg<br />
does not officially support the principle of “parking-free” streets,<br />
preferring instead the Rieselfeld “carrots only” approach. However,<br />
experiences from GWL Terrein, Stellwerk 60 and Vauban demonstrate<br />
that sustained public support can influence the implementation of<br />
radical measures, such as car-free developments with reduced and<br />
decoupled parking.<br />
recommendations for<br />
future research<br />
Further detailed research to determine mode share and distance<br />
traveled, as well as longitudinal studies to quantify and understand<br />
the reasons for changes in mobility behavior in the long-run, are<br />
required to add to the evidence base presented here, strengthening<br />
the case for the application of the types of design and policy<br />
interventions documented in this report. Accurate assessments of<br />
potential CO 2 emissions savings will further justify the use of neighborhood<br />
and area-wide measures as an effective climate change<br />
mitigation avoid–shift strategy.<br />
The efficacy of many of the measures described in this study are<br />
well understood. However, the acceptability of various forms of carfree<br />
development is an area of weakness, as this model is considered<br />
radical, may not enjoy political and institutional support, and<br />
a lack of case studies means a dearth of data to make the case for<br />
implementation elsewhere. It would also be instructive to compare<br />
turnover and property prices in car-free and neighboring conventional<br />
development, to assuage developers’ and planners’ fears over<br />
the unpopularity of car-free living.<br />
Background levels of overall mobility and motorization, as well<br />
as NMT infrastructure and transit quality in the wider area, vary<br />
considerably in other regions. However, many of the most effective<br />
policies and lessons learned are transferable beyond the borders of<br />
western Europe: these include the selection of sustainable locations<br />
for development and the pricing of parking. Efforts in the years ahead<br />
should primarily be focused on the dissemination of these findings to<br />
politicians, planners and developers across the world.<br />
Legal and Institutional Barriers<br />
Minimum parking standards are the major legal barrier to the construction<br />
of further car-free developments, being directly responsible<br />
for the need to introduce complex legal agreements in the German<br />
case studies.<br />
The lessons here are that car-reduced and car-free developments<br />
are more likely to be rolled out if:<br />
1. legislation for the implementation of controlled/residents’<br />
parking zones is in place or introduced;<br />
2. national and regional minimum parking standards are abolished,<br />
significantly reduced or made more flexible, taking into<br />
account local circumstances;<br />
3. local authorities and developers perceive that demand for<br />
them exists, i.e. that they are vote-winners and as profitable as<br />
conventional development.<br />
As mentioned above, local people are responsible for demonstrating<br />
the demand for car-free living.
<strong>Institute</strong> for Transportation<br />
& Development Policy<br />
9 East 19th Street, 7th Floor<br />
<strong>New</strong> York, NY 10003 USA<br />
Tel: +1 212 629-8001 Fax: +1 646 380-2360<br />
Email: mobility@itdp.org Web: www.itdp.org