BRT Standard - ITDP | Institute for Transportation and Development ...
BRT Standard - ITDP | Institute for Transportation and Development ...
BRT Standard - ITDP | Institute for Transportation and Development ...

You also want an ePaper? Increase the reach of your titles
YUMPU automatically turns print PDFs into web optimized ePapers that Google loves.
The Brt<br />
<strong>St<strong>and</strong>ard</strong><br />
Version 1.0
The <strong>BRT</strong> <strong>St<strong>and</strong>ard</strong> Version 1.0<br />
9 East 19th Street, 7th Floor, New York, NY, 10003<br />
tel +1 212 629 8001 fax +1 646 380 2360<br />
www.itdp.org<br />
January 2012<br />
Deutsche Gesellschaft für Internationale Zusammenarbeit (GIZ) GmbH<br />
Dag-Hammarskjöld-Weg 1-5<br />
65760 Eschborn<br />
Germany<br />
tel +49 6196 79-0 fax +49 6196 79-1115<br />
www.gtz.de
Foreword 4<br />
Introduction 5<br />
<strong>BRT</strong> <strong>St<strong>and</strong>ard</strong> Scorecard 10<br />
Scoring in Detail 14
The <strong>BRT</strong> <strong>St<strong>and</strong>ard</strong> Version 1.0<br />
4<br />
Foreword<br />
The first bus rapid transit system opened in Curitiba, Brazil, in<br />
1974, <strong>and</strong> remains one of the best in the world today. After its<br />
opening, there were many imitators across Brazil <strong>and</strong> in other<br />
countries, including the United States. Some of these imitators<br />
brought real improvements, but most had only a h<strong>and</strong>ful of the<br />
elements that made Curitiba’s <strong>BRT</strong> such a phenomenal success.<br />
A few of these busways, by concentrating large numbers of<br />
polluting old buses onto a single corridor, slowed buses down<br />
<strong>and</strong> blighted adjacent real estate. The Brazilian general public,<br />
unfamiliar with the technical differences between the Curitiba<br />
<strong>BRT</strong> system <strong>and</strong> other busways, became disillusioned with <strong>BRT</strong><br />
as a solution to its mass-transit problems, <strong>and</strong> from the mid-<br />
1980s until 2012 no new full-featured <strong>BRT</strong> systems were built<br />
in Brazil.<br />
Starting in 1998, there was a second wave of <strong>BRT</strong> systems.<br />
Most significantly, in 2000, Bogotá opened the TransMilenio <strong>BRT</strong><br />
system. TransMilenio significantly surpassed Curitiba in terms<br />
of speed, capacity, quality of service, <strong>and</strong> the richness of services<br />
offered. Its success spurred a number of cities worldwide to build<br />
<strong>BRT</strong> systems, some of which turned out extremely well, bringing<br />
new innovations <strong>and</strong> refinements. The <strong>Institute</strong> <strong>for</strong> <strong>Transportation</strong><br />
<strong>and</strong> <strong>Development</strong> Policy (<strong>ITDP</strong>) <strong>and</strong> other members of the <strong>BRT</strong><br />
<strong>St<strong>and</strong>ard</strong> committee have been lucky enough to be involved in<br />
many of these projects. As a result of this rapidly growing body<br />
of experience with <strong>BRT</strong> systems, the international <strong>BRT</strong> technical<br />
community has a much better underst<strong>and</strong>ing today of the<br />
essential elements of the best <strong>BRT</strong> systems than it did a<br />
decade ago.<br />
At the same time, because there was no agreement on a<br />
quality st<strong>and</strong>ard <strong>for</strong> <strong>BRT</strong> systems, history began to repeat itself.<br />
For every new <strong>BRT</strong> system that was world class, dozens opened<br />
that lacked many of the essential features of <strong>BRT</strong>. The residents<br />
<strong>and</strong> decision makers in cities where these systems were built<br />
were largely unaware of the differences between their system<br />
<strong>and</strong> the best <strong>BRT</strong> systems. As happened in Brazil in the 1980s,<br />
in a growing number of such cities, the public <strong>and</strong> political<br />
leaders came to associate <strong>BRT</strong> with a quality of service<br />
significantly inferior to what was expected from rail-based<br />
alternatives. This phenomenon occurred in countries from<br />
the United States to China, India, <strong>and</strong> Indonesia, where some<br />
new systems were built that actually made conditions worse<br />
<strong>for</strong> transit passengers.<br />
Starting in 2010, <strong>ITDP</strong>, with support from the Rockefeller<br />
Foundation, decided that the time was right to develop a <strong>BRT</strong><br />
<strong>St<strong>and</strong>ard</strong>. It was initially developed as a metric <strong>for</strong> determining<br />
the degree to which existing <strong>BRT</strong> systems in the U.S. were<br />
consistent with international best practice. As we faced a similar<br />
need in other countries, we began to recognize the applicability<br />
of the st<strong>and</strong>ard <strong>for</strong> international use.<br />
In 2011 <strong>ITDP</strong> convened a meeting in Bogotá bringing together<br />
engineers who had worked on the highest-quality <strong>BRT</strong> systems.<br />
Together, we tried to further distill the system features most<br />
critical to good <strong>BRT</strong> per<strong>for</strong>mance, <strong>and</strong> to weigh them in terms of<br />
their relative importance. While there was much dispute on the<br />
margins, the technical community already had a fairly common<br />
underst<strong>and</strong>ing of the essential elements of best practice in <strong>BRT</strong><br />
systems. Throughout 2011 the scoring system was further vetted<br />
with experts from the U.S. <strong>and</strong> abroad, then tested on dozens of<br />
systems to see whether the scores seemed consistent with the<br />
better-per<strong>for</strong>ming systems.<br />
This document, the <strong>BRT</strong> <strong>St<strong>and</strong>ard</strong> version 1.0, was developed<br />
as a result of that year-long ef<strong>for</strong>t.<br />
We hope that the <strong>BRT</strong> <strong>St<strong>and</strong>ard</strong> will help encourage<br />
municipalities to at least consider the key features of the best<br />
<strong>BRT</strong> systems, <strong>and</strong> that a few cities will be inspired to go beyond<br />
what has been done be<strong>for</strong>e. We hope it will be useful to citizens’<br />
groups, allowing them to dem<strong>and</strong> better quality <strong>and</strong> per<strong>for</strong>mance<br />
from their political leaders. Finally, we look <strong>for</strong>ward to certifying<br />
<strong>and</strong> celebrating those cities that succeed in developing the<br />
highest-quality <strong>BRT</strong> systems.<br />
Sincerely,<br />
Walter Hook<br />
Chief Executive Officer, <strong>ITDP</strong>
The <strong>BRT</strong> <strong>St<strong>and</strong>ard</strong> Version 1.0 5<br />
Introduction<br />
The <strong>BRT</strong> <strong>St<strong>and</strong>ard</strong> is an ef<strong>for</strong>t by leading<br />
technical experts to come to a common<br />
underst<strong>and</strong>ing of what constitutes<br />
internationally recognized best practice in<br />
<strong>BRT</strong> system design. The best <strong>BRT</strong> systems<br />
are ones that combine efficiency <strong>and</strong><br />
sustainability with passenger com<strong>for</strong>t<br />
<strong>and</strong> convenience. The <strong>BRT</strong> <strong>St<strong>and</strong>ard</strong><br />
uses design characteristics that act<br />
as proxies <strong>for</strong> enhanced per<strong>for</strong>mance<br />
<strong>and</strong> customer experience. This scoring<br />
method celebrates high-quality <strong>BRT</strong>s,<br />
but is not intended to denigrate lighter<br />
<strong>BRT</strong> improvements which may also yield<br />
important benefits to customers.
The <strong>BRT</strong> <strong>St<strong>and</strong>ard</strong> Version 1.0<br />
6<br />
Many people remain unaware of the characteristics<br />
of the best <strong>BRT</strong> systems <strong>and</strong> their potential<br />
to provide a quality of customer service usually<br />
associated with metros <strong>and</strong> subways. This lack of<br />
awareness frequently results in dem<strong>and</strong>s <strong>for</strong> rail<br />
when <strong>BRT</strong> may be a comparable <strong>and</strong> cost-effective<br />
alternative. It can also result in inaccurately<br />
labeling minimal improvements to st<strong>and</strong>ard bus<br />
service as <strong>BRT</strong>.<br />
The <strong>BRT</strong> <strong>St<strong>and</strong>ard</strong> provides a framework<br />
<strong>for</strong> system designers, decision makers, <strong>and</strong> the<br />
sustainable transport community to implement<br />
<strong>and</strong> identify top-quality <strong>BRT</strong> systems. A corridor<br />
of a system can be certified as Gold <strong>St<strong>and</strong>ard</strong>,<br />
Silver <strong>St<strong>and</strong>ard</strong>, or Bronze <strong>St<strong>and</strong>ard</strong> based on<br />
the scorecard. 2012 is a pilot year to test the<br />
scorecard <strong>and</strong> make modifications as needed.<br />
Version 1.0 of the <strong>BRT</strong> <strong>St<strong>and</strong>ard</strong> is the<br />
culmination of a review by the <strong>BRT</strong> <strong>St<strong>and</strong>ard</strong><br />
Committee undertaken during 2011. Only the <strong>BRT</strong><br />
<strong>St<strong>and</strong>ard</strong> Committee is currently authorized to<br />
confer the <strong>BRT</strong> <strong>St<strong>and</strong>ard</strong> Gold, Silver, or Bronze<br />
certification on a <strong>BRT</strong> system.<br />
Who is the <strong>BRT</strong> <strong>St<strong>and</strong>ard</strong> Committee?<br />
The <strong>BRT</strong> <strong>St<strong>and</strong>ard</strong> Committee is a select group of<br />
leading <strong>BRT</strong> experts that have worked on many<br />
of the world’s best <strong>BRT</strong> systems. The committee<br />
helped develop the scorecard through reviewing<br />
<strong>and</strong> recommending changes, ultimately signing<br />
off on it technically. They will also be charged<br />
with testing the scorecard during the pilot year.<br />
<strong>ITDP</strong> is the main convener <strong>and</strong> secretariat of the<br />
<strong>BRT</strong> <strong>St<strong>and</strong>ard</strong>. The committee is composed of<br />
the following experts who also represent their<br />
institutions unless otherwise indicated by an (*):<br />
Walter Hook, <strong>ITDP</strong><br />
Manfred Breithaupt, GIZ<br />
Lloyd Wright, Asian <strong>Development</strong> Bank*<br />
Dario Hidalgo, EMBARQ*<br />
Gerhard Menckhoff, World Bank (retired),<br />
<strong>ITDP</strong> Vice President<br />
Wagner Colombini Martins, Logit Consultoria<br />
Carlos Felipe Pardo, Slow Research<br />
Pedro Szasz, Consultant<br />
Ulises Navarro, Modelistica<br />
Scott Ruther<strong>for</strong>d, University of Washington<br />
The emissions scoring detail <strong>for</strong> buses was<br />
recommended by the International Council on<br />
Clean <strong>Transportation</strong>, a member of the Best<br />
Practice Network of the ClimateWorks Foundation.<br />
Lew Fulton <strong>and</strong> Tali Trigg of the International<br />
Energy Agency have also endorsed the <strong>BRT</strong><br />
<strong>St<strong>and</strong>ard</strong>.
The <strong>BRT</strong> <strong>St<strong>and</strong>ard</strong> Version 1.0 7<br />
What is the <strong>BRT</strong> <strong>St<strong>and</strong>ard</strong>?<br />
Certifying a <strong>BRT</strong> system as Gold, Silver, or Bronze<br />
will set an internationally recognized st<strong>and</strong>ard<br />
<strong>for</strong> what constitutes best practice in <strong>BRT</strong>. The<br />
elements of best practice recognized by the <strong>BRT</strong><br />
<strong>St<strong>and</strong>ard</strong> will have a positive impact on ridership<br />
<strong>and</strong> quality of service in most conditions <strong>and</strong><br />
contexts. The measures that receive points in<br />
the <strong>BRT</strong> <strong>St<strong>and</strong>ard</strong> have been evaluated in a wide<br />
variety of contexts <strong>and</strong> when present, they result<br />
in consistently improved system per<strong>for</strong>mance.<br />
Points are only awarded <strong>for</strong> those elements of<br />
system design that generally improve operational<br />
per<strong>for</strong>mance <strong>and</strong> quality of service or minimize<br />
adverse environmental impacts of the traffic<br />
system. The criteria used to determine the point<br />
system were as follows:<br />
• The points should act as proxies <strong>for</strong><br />
a higher quality of customer service<br />
(speed, com<strong>for</strong>t, capacity, etc).<br />
• The basis <strong>for</strong> the score should be<br />
reasonably clear <strong>and</strong> independently<br />
verifiable without recourse to in<strong>for</strong>mation<br />
that is not readily obtained.<br />
The <strong>BRT</strong> <strong>St<strong>and</strong>ard</strong> depends on easily-observable<br />
system characteristics that are associated with<br />
high per<strong>for</strong>mance. This is, <strong>for</strong> now, the most<br />
reliable <strong>and</strong> equitable mechanism <strong>for</strong> recognizing<br />
quality in different <strong>BRT</strong> systems rather than<br />
per<strong>for</strong>mance measurements. The main reasons<br />
<strong>for</strong> this approach include:<br />
• The ability to assess both planned <strong>and</strong><br />
existing systems: The <strong>BRT</strong> <strong>St<strong>and</strong>ard</strong><br />
is intended to help guide planning<br />
<strong>and</strong> design decisions prior to system<br />
implementation. The scoring tool is<br />
usable both <strong>for</strong> planned <strong>and</strong> built systems,<br />
whereas per<strong>for</strong>mance st<strong>and</strong>ards<br />
are only applicable when assessing<br />
existing systems.<br />
• The points should be awarded based on<br />
a general consensus among <strong>BRT</strong> experts<br />
on what constitutes best practice in<br />
system planning <strong>and</strong> design, <strong>and</strong> their<br />
relative importance.<br />
• The points should reward good, often<br />
politically-challenging, design decisions<br />
made by the project team that will result<br />
in superior per<strong>for</strong>mance, rather than<br />
rewarding system characteristics that<br />
may be innate to the corridor.<br />
• The metrics <strong>and</strong> weightings should be<br />
easily <strong>and</strong> equitably applicable to a<br />
wide range of <strong>BRT</strong> systems in different<br />
contexts—from lower-ridership, smaller<br />
systems to larger, high-volume systems.<br />
• Good data is rare <strong>and</strong> expensive:<br />
While the effect of the system on doorto-door<br />
travel time <strong>and</strong> cost is the ideal<br />
appraisal-per<strong>for</strong>mance metric, this data<br />
is extremely difficult, expensive, <strong>and</strong><br />
time consuming to collect, <strong>and</strong> nearly<br />
impossible to independently corroborate.<br />
• Per<strong>for</strong>mance indicators can create<br />
perverse incentives: Many of the easiestto-collect<br />
per<strong>for</strong>mance indicators can create<br />
perverse incentives when used in isolation<br />
of other harder-to-obtain metrics. For<br />
instance, increased bus speeds in the U.S.<br />
have generally been achieved by eliminating<br />
station stops. While this may be justified in<br />
many cases, it can result in longer walking<br />
times <strong>for</strong> passengers. As such, giving points<br />
<strong>for</strong> higher speeds would create a perverse<br />
incentive to reward project developers who<br />
eliminate more bus stops.
The <strong>BRT</strong> <strong>St<strong>and</strong>ard</strong> Version 1.0<br />
8<br />
The <strong>BRT</strong> <strong>St<strong>and</strong>ard</strong>, there<strong>for</strong>e, is needed <strong>for</strong><br />
recognizing higher-quality systems on a<br />
comparable basis in addition to per<strong>for</strong>mancebased<br />
analysis. Attempts to reliably collect data<br />
across a wide variety of systems <strong>and</strong> compare<br />
them in a manner that fairly rewards the better<br />
per<strong>for</strong>mers have simply proved futile to date.<br />
The lack of access to reliable be<strong>for</strong>e-<strong>and</strong>-after<br />
in<strong>for</strong>mation about the effects of the <strong>BRT</strong> corridor<br />
that can be independently corroborated, as<br />
well as the complexity of identifying fair <strong>and</strong><br />
comparable metrics, have undermined ef<strong>for</strong>ts to<br />
develop a fair recognition scheme.<br />
However, we recognize that a scoring system<br />
divorced from any per<strong>for</strong>mance metrics also has<br />
limitations. The measures included in the <strong>BRT</strong><br />
<strong>St<strong>and</strong>ard</strong> will almost always tend to improve<br />
per<strong>for</strong>mance if the corridor is designed properly<br />
<strong>for</strong> the ridership. If a system or corridor, however,<br />
is poorly designed, there is a risk that the <strong>BRT</strong><br />
system could saturate <strong>and</strong> congest, reducing busoperating<br />
speeds <strong>and</strong> making conditions worse<br />
<strong>for</strong> passengers.<br />
To mitigate the risk of conferring a quality<br />
br<strong>and</strong> on a system with good <strong>BRT</strong> elements but<br />
improper sizing, management, or regulations,<br />
we decided to assign a limited number of penalty<br />
points applicable <strong>for</strong> already-operational<br />
systems where some readily-observable baseline<br />
per<strong>for</strong>mance metrics were not met.<br />
The <strong>BRT</strong> <strong>St<strong>and</strong>ard</strong> has been developed to<br />
weigh all <strong>BRT</strong> systems according to the same<br />
criteria rather than relative to a system’s dem<strong>and</strong><br />
or a city’s population. It does not differentiate<br />
based on high-dem<strong>and</strong>, medium-dem<strong>and</strong>,<br />
<strong>and</strong> low-dem<strong>and</strong> <strong>BRT</strong> systems. The purpose of<br />
the <strong>BRT</strong> <strong>St<strong>and</strong>ard</strong> is to create one definition of<br />
international best practice. Separate scoring<br />
systems would undermine that intention.<br />
Going <strong>for</strong> gold will almost always result<br />
in better per<strong>for</strong>mance <strong>and</strong> better quality of<br />
service, but may not always be justified from a<br />
cost-effectiveness perspective. In most cities, it<br />
is possible to achieve Gold <strong>St<strong>and</strong>ard</strong> in at least<br />
some corridors in a cost-effective manner, but<br />
a bronze system may be more appropriate in<br />
some cases. If a system has not achieved a high<br />
<strong>BRT</strong> <strong>St<strong>and</strong>ard</strong> score, this does not mean that the<br />
system designers did not do a good job. It may be<br />
that more significant measures were not justified<br />
in a particular case.<br />
The <strong>BRT</strong> <strong>St<strong>and</strong>ard</strong> complements<br />
other project appraisal tools<br />
The <strong>BRT</strong> <strong>St<strong>and</strong>ard</strong> measures how closely a<br />
proposed or existing system resembles best<br />
practice. Evaluating whether a Gold <strong>St<strong>and</strong>ard</strong><br />
<strong>BRT</strong> is justified or well designed <strong>for</strong> a particular<br />
location is better answered by a fair cost benefit<br />
analysis or other project appraisal tools that are<br />
typically used to evaluate a project in planning<br />
phases.<br />
The <strong>BRT</strong> <strong>St<strong>and</strong>ard</strong> is intended to<br />
complement, <strong>and</strong> not replace, cost-effectiveness<br />
measurements, cost-benefit appraisal tools,<br />
<strong>and</strong> system-per<strong>for</strong>mance evaluations. Were the<br />
<strong>BRT</strong> <strong>St<strong>and</strong>ard</strong> used in isolation of other costappraisal<br />
methodologies it could potentially<br />
encourage overspending on higher-quality <strong>BRT</strong><br />
infrastructure. This risk should be mitigated by<br />
the continued use of cost-effectiveness appraisal<br />
or other <strong>for</strong>ms of cost-benefit analysis.<br />
In addition, the <strong>BRT</strong> <strong>St<strong>and</strong>ard</strong> may be used<br />
as part of broader carbon-measurement tools,<br />
but should not replace them, as it only measures<br />
certain elements of a <strong>BRT</strong> project’s carbon<br />
impacts.<br />
For instance, the Global Environmental<br />
Facility (GEF) has recently developed the<br />
Transport Emissions Evaluation Models <strong>for</strong><br />
Projects (TEEMP) tool to predict the likely carbon<br />
abatement potential of projects applying <strong>for</strong><br />
GEF funding that are only in the planning stage.<br />
The TEEMP <strong>BRT</strong> model uses the <strong>BRT</strong> <strong>St<strong>and</strong>ard</strong><br />
as the basis <strong>for</strong> making certain assumptions<br />
about the likely speed, modal shift impact, <strong>and</strong>
The <strong>BRT</strong> <strong>St<strong>and</strong>ard</strong> Version 1.0 9<br />
ridership of a planned new <strong>BRT</strong> system when more<br />
sophisticated modeling data is unavailable.<br />
Similarly, the <strong>BRT</strong> <strong>St<strong>and</strong>ard</strong> may be a useful<br />
element of project appraisal as a way of testing<br />
the credibility of speed improvements or other<br />
per<strong>for</strong>mance claims made as part of a more<br />
systematic “per<strong>for</strong>mance-based” metric, such<br />
as the U.S. Federal Transit Administration’s<br />
cost-effectiveness analysis or the internal rateof-return<br />
analysis required by the development<br />
banks during project appraisal, but it is not<br />
a replacement <strong>for</strong> these appraisal tools.<br />
The <strong>BRT</strong> <strong>St<strong>and</strong>ard</strong>: Pilot Process<br />
The <strong>BRT</strong> <strong>St<strong>and</strong>ard</strong> version 1.0 is a pilot being<br />
tested by the <strong>BRT</strong> <strong>St<strong>and</strong>ard</strong> Committee during<br />
the first half of 2012. Over the past year, the<br />
committee considered a wide range of scorecard<br />
indicators. Many of these were included in the<br />
final scoring system, but some were determined<br />
to be beyond the scope of the scorecard.<br />
L<strong>and</strong> use <strong>and</strong> green architecture in station<br />
design, <strong>for</strong> example, are recognized as important<br />
<strong>and</strong> should be encouraged in all <strong>BRT</strong> systems, but<br />
are not included. For l<strong>and</strong> use <strong>and</strong> transit-oriented<br />
development, LEED ND’s certification scheme is<br />
recommended as the measurement tool <strong>for</strong> l<strong>and</strong><br />
use-related elements of a <strong>BRT</strong> project.<br />
After much debate, it was decided not to<br />
award any points <strong>for</strong> good system-management<br />
structures, despite the fact that there was a<br />
consensus that many of the most important<br />
elements of <strong>BRT</strong> are related to high-quality<br />
management. While these issues are critical,<br />
some of them are too controversial or too context<br />
specific to achieve unanimity <strong>for</strong> an international<br />
st<strong>and</strong>ard scoring system. There are many ways<br />
that the system operator can achieve higherquality<br />
per<strong>for</strong>mance through different contract<br />
structures or per<strong>for</strong>mance metrics in various<br />
regulatory environments, <strong>and</strong> we were unable to<br />
craft a metric to include in this scoring system.<br />
Ultimately, the <strong>BRT</strong> <strong>St<strong>and</strong>ard</strong> has two main uses:<br />
1 To evaluate systems already built to<br />
recognize those systems that are of the<br />
highest quality. These scorings will be<br />
released once a year <strong>and</strong> will be used as a<br />
means to compare systems <strong>and</strong> reward <strong>and</strong><br />
celebrate those that have made politically<br />
courageous <strong>and</strong> technically difficult<br />
decisions.<br />
2 To be used by planners, decision makers,<br />
<strong>and</strong> concerned citizens as a way to evaluate<br />
<strong>BRT</strong> corridors in the planning phase. It will<br />
function as a mechanism to underst<strong>and</strong><br />
how close plans come to international best<br />
practice <strong>and</strong> to illuminate where changes<br />
could be made to improve the system.<br />
After the 2012 testing period, the committee will<br />
convene again <strong>and</strong> review comments <strong>and</strong> scoring<br />
<strong>and</strong> make adjustments. Finalization of the <strong>BRT</strong><br />
<strong>St<strong>and</strong>ard</strong> will happen by October 2012, with the<br />
goal of releasing the <strong>BRT</strong> <strong>St<strong>and</strong>ard</strong> in 2013.<br />
The <strong>BRT</strong> <strong>St<strong>and</strong>ard</strong> Committee looks <strong>for</strong>ward<br />
to making this an even stronger tool <strong>for</strong> creating<br />
better <strong>BRT</strong> systems <strong>and</strong> encouraging better public<br />
transport that benefits cities <strong>and</strong> citizens alike.
The <strong>BRT</strong> <strong>St<strong>and</strong>ard</strong> Version 1.0<br />
10<br />
<strong>BRT</strong> <strong>St<strong>and</strong>ard</strong> Scorecard<br />
This scorecard shows the criteria <strong>and</strong> point values that make up<br />
the <strong>BRT</strong> <strong>St<strong>and</strong>ard</strong>, followed by a detailed description <strong>for</strong> each.<br />
CATEGORY<br />
service planning<br />
max score<br />
station design <strong>and</strong> station-bus interface<br />
max score<br />
Off-board fare collection 7<br />
Multiple routes 4<br />
Peak frequency 4<br />
Off-peak frequency 3<br />
Express, limited, <strong>and</strong> local services 3<br />
Plat<strong>for</strong>m-level boarding 6<br />
Safe <strong>and</strong> com<strong>for</strong>table stations 3<br />
Number of doors on bus 3<br />
Docking bays <strong>and</strong> sub-stops 2<br />
Sliding doors in <strong>BRT</strong> stations 1<br />
Control center 3<br />
Located In top ten corridors 2<br />
Hours of operations 2<br />
Multi-corridor network 2<br />
infrastructure<br />
Busway alignment 7<br />
Segregated right-of-way 7<br />
Intersection treatments 6<br />
Passing lanes at stations 4<br />
Minimizing bus emissions 4<br />
Stations set back from intersections 3<br />
Center stations 3<br />
Pavement quality 2<br />
quality of service <strong>and</strong><br />
passenger in<strong>for</strong>mation systems<br />
Br<strong>and</strong>ing 3<br />
Passenger in<strong>for</strong>mation 2<br />
integration <strong>and</strong> access<br />
Universal access 3<br />
Integration with other public transport 3<br />
Pedestrian access 3<br />
Secure bicycle parking 2<br />
Bicycle lanes 2<br />
Bicycle-sharing integration 1<br />
TOTAL 100
The <strong>BRT</strong> <strong>St<strong>and</strong>ard</strong> Version 1.0 11<br />
point deductions<br />
Low commercial speeds: minimum average commercial speed below 13 kph (8 mph) -10<br />
Peak passengers per hour per direction (pphpd) below 1,000 -5<br />
Lack of en<strong>for</strong>cement of right-of-way -5<br />
Significant gap between bus floor <strong>and</strong> station plat<strong>for</strong>m -5<br />
Station encroaches on sidewalk or busway -3<br />
Overcrowding -3<br />
Poorly-maintained buses <strong>and</strong> stations -3<br />
Distances between stations too long or too short -2<br />
Gold: 85 points or above<br />
Silver: 70–84 points<br />
Bronze: 50–69 points
The <strong>BRT</strong> <strong>St<strong>and</strong>ard</strong> Version 1.0<br />
12<br />
Scoring in Detail<br />
Definition of a <strong>BRT</strong> Trunk Corridor<br />
The <strong>BRT</strong> <strong>St<strong>and</strong>ard</strong> is to be applied to specific<br />
<strong>BRT</strong> trunk corridors rather than to a <strong>BRT</strong> system<br />
as a whole. This is because the quality of<br />
<strong>BRT</strong> in cities with multiple corridors can vary<br />
significantly. For the purposes of the <strong>BRT</strong><br />
<strong>St<strong>and</strong>ard</strong>, a <strong>BRT</strong> trunk corridor is defined<br />
as follows:<br />
“A section of a road or contiguous<br />
roads served by a bus route or multiple<br />
bus routes, including the section(s)<br />
where the majority of transit trips<br />
in the area pass.”<br />
The primary reason <strong>for</strong> defining the corridor in<br />
this way is that in some cities <strong>BRT</strong> infrastructure<br />
is built on the approaches to the city center but<br />
then ends just short of the highest-dem<strong>and</strong> part<br />
of the bus route(s) in the city center. In order to<br />
avoid rewarding <strong>BRT</strong> systems <strong>for</strong> leaving out the<br />
most difficult, high-dem<strong>and</strong> sections of the bus<br />
routes, the corridor length needs to be defined as<br />
including the highest-dem<strong>and</strong>, downtown parts<br />
of a route. In this way, the corridor will score<br />
higher on several of the indicators only if the <strong>BRT</strong><br />
infrastructure enters the area of highest dem<strong>and</strong>.
The <strong>BRT</strong> <strong>St<strong>and</strong>ard</strong> Version 1.0 13<br />
Off-board Fare Collection<br />
7 points maximum<br />
Off-board fare collection is one the most important<br />
factors in reducing travel time <strong>and</strong> improving the<br />
customer experience.<br />
There are two basic approaches to off-board<br />
fare collection: “Barrier-controlled,” where<br />
passengers pass through a gate, turnstile, or<br />
checkpoint upon entering the station where their<br />
ticket is verified or fare is deducted, or “proof-ofpayment,”<br />
where passengers pay at a kiosk <strong>and</strong><br />
collect a paper ticket which is then checked on<br />
board the vehicle by an inspector. Both approaches<br />
can significantly reduce delay. However, barriercontrolled<br />
is slightly preferred because:<br />
Kiosk to buy a ticket<br />
<strong>for</strong> proof-of-payment<br />
system, Las Vegas, USA<br />
Turnstiles in<br />
Guatemala City’s <strong>BRT</strong><br />
• It is somewhat easier to accommodate multiple<br />
routes using the same <strong>BRT</strong> infrastructure;<br />
• It minimizes fare evasion, as every passenger<br />
must have his/her ticket scanned in order<br />
to enter the system, versus proof-of-payment<br />
which requires r<strong>and</strong>om checks;<br />
• Proof-of-payment can cause anxiety<br />
<strong>for</strong> passengers who may have misplaced<br />
lost tickets;<br />
• The data collected by barrier-controlled systems<br />
upon boarding, <strong>and</strong> sometimes upon alighting,<br />
can be useful in future system planning.<br />
On the other h<strong>and</strong>, proof-of-payment systems on<br />
bus routes that extend beyond trunk <strong>BRT</strong> corridors<br />
extend the benefits of time savings to those<br />
sections of the bus routes that lie beyond the <strong>BRT</strong><br />
trunk corridor.<br />
off-board fare collection<br />
points<br />
100% of trunk stations have barrier-controlled, off-vehicle fare collection 7<br />
75% + of trunk stations have barrier-controlled, off-vehicle fare collection 6<br />
Proof-of-payment on all routes that touch the trunk corridor 6<br />
60 – 75% of trunk stations have barrier-controlled, off-vehicle fare collection 5<br />
45 – 60% of trunk stations have barrier-controlled, off-vehicle fare collection 4<br />
Proof-of-payment on some routes that run on the trunk corridor 3<br />
30 – 45% of trunk stations have barrier-controlled, off-vehicle fare collection 2<br />
15–30% of trunk stations have barrier-controlled, off-vehicle fare collection 1<br />
< 15% of trunk stations have barrier-controlled, off-vehicle fare collection 0
The <strong>BRT</strong> <strong>St<strong>and</strong>ard</strong> Version 1.0<br />
14<br />
Multiple Routes<br />
4 points maximum<br />
Having multiple routes operate on a single<br />
corridor is a good proxy <strong>for</strong> reduced door-to-door<br />
travel times by reducing transfer penalties.<br />
This can include:<br />
This flexibility of bus-based systems is one<br />
of the primary advantages of <strong>BRT</strong> that is<br />
frequently not well used or understood.<br />
• Routes that operate over multiple corridors,<br />
as exists with TransMilenio in Bogotá or<br />
Metrobús in Mexico City;<br />
• Multiple routes operating in a single corridor<br />
that go to different destinations once they leave<br />
the trunk line, as exists with the Guangzhou,<br />
Cali, <strong>and</strong> Johannesburg <strong>BRT</strong> systems.<br />
multiple routes<br />
points<br />
Two or more routes exist on the corridor, 4<br />
servicing at least two stations<br />
No multiple routes 0<br />
<strong>BRT</strong> Corridor
The <strong>BRT</strong> <strong>St<strong>and</strong>ard</strong> Version 1.0 15<br />
Mexico City’s Metrobús, added an additional<br />
20,000 daily passengers just by eliminating<br />
the transfer penalty with a direct route<br />
connecting Corridor I (Insurgentes) with<br />
Corridor II (Eje 4).<br />
Guangzhou has multiple routes,<br />
as seen in the passenger<br />
in<strong>for</strong>mation sign, that run<br />
on the same corridor.
The <strong>BRT</strong> <strong>St<strong>and</strong>ard</strong> Version 1.0<br />
16<br />
TransMilenio,<br />
Bogotá, Colombia<br />
Peak Frequency<br />
Off-peak Frequency<br />
4 points maximum<br />
3 points maximum<br />
How often the bus comes during peak travel<br />
times such as rush hour is a good proxy <strong>for</strong><br />
quality of service <strong>and</strong> corridor selection. A higher<br />
frequency usually means higher ridership,<br />
although the scoring of peak frequencies have<br />
been set at levels that still allow systems in<br />
lower-dem<strong>and</strong> environments to receive some<br />
points. Additionally, in order <strong>for</strong> <strong>BRT</strong> to be truly<br />
competitive with alternative modes, like the<br />
private automobile, passengers need to be<br />
confident that their wait times will be short <strong>and</strong><br />
the next bus will arrive soon.<br />
Scoring Guidelines: Peak frequency is measured<br />
by the headway or service interval, meaning the<br />
number of minutes between buses independent<br />
of the route passing the highest-dem<strong>and</strong> segment<br />
on the corridor during the peak period. For<br />
headways of exactly two, three, five, or seven<br />
minutes, round up.<br />
As with peak frequency, how often the bus comes<br />
during off-peak travel times is a good proxy <strong>for</strong><br />
quality of service <strong>and</strong> corridor selection.<br />
Scoring Guidelines: Off-peak frequency here is<br />
measured by the headway (also known as the<br />
service interval) between buses independent of<br />
the route passing the highest-dem<strong>and</strong> segment<br />
on the corridor during the off-peak (mid-day)<br />
period. For headways of exactly five, eight, or<br />
twelve minutes, round up.<br />
service interval (minutes)<br />
points<br />
< 5 3<br />
5–8 2<br />
8–12 1<br />
> 12 0<br />
service interval (minutes)<br />
points<br />
< 2 4<br />
2–3 3<br />
3–5 2<br />
5–7 1<br />
> 7 0
The <strong>BRT</strong> <strong>St<strong>and</strong>ard</strong> Version 1.0 17<br />
Guangzhou, China<br />
<strong>BRT</strong> control center<br />
Express, Limited, <strong>and</strong> Local Services<br />
Control Center<br />
3 points maximum<br />
3 points maximum<br />
One of the most important ways that mass transit<br />
systems increase operating speeds, <strong>and</strong> reduce<br />
passenger travel times, is by providing limited<br />
<strong>and</strong> express services. While local services stop at<br />
every station, limited services skip lower-dem<strong>and</strong><br />
stations <strong>and</strong> stop only at major stations that<br />
have higher passenger dem<strong>and</strong>. Express services<br />
often collect passengers at stops at one end of the<br />
corridor, travel along much of the corridor without<br />
stopping, <strong>and</strong> drop passengers off at the other<br />
end. Infrastructure necessary <strong>for</strong> the inclusion<br />
of express, limited, <strong>and</strong> local <strong>BRT</strong> services is<br />
captured in other scoring metrics.<br />
Control centers <strong>for</strong> <strong>BRT</strong> systems are increasingly<br />
becoming a requirement <strong>for</strong> a host of service<br />
improvements, such as avoiding bus bunching,<br />
monitoring bus operations, identifying problems,<br />
<strong>and</strong> rapidly responding to them.<br />
A full-service control center monitors<br />
the locations of all buses with GPS or similar<br />
technology, responds to incidents in real-time,<br />
controls the spacing of buses, knows the<br />
maintenance status of all buses in the fleet, <strong>and</strong><br />
records passenger boardings <strong>and</strong> alightings <strong>for</strong><br />
future service adjustments. A full-service center<br />
should be integrated with a public transport<br />
system’s existing control center, if it exists,<br />
as well as the traffic signal system.<br />
service types<br />
points<br />
control center<br />
points<br />
Local services <strong>and</strong> multiple types of 3<br />
limited <strong>and</strong>/or express services<br />
At least one local <strong>and</strong> one limited 2<br />
or express service option<br />
No limited or express services 0<br />
Full-service control center 3<br />
Control center with most services 2<br />
Control center with some services 1<br />
No control center 0
The <strong>BRT</strong> <strong>St<strong>and</strong>ard</strong> Version 1.0<br />
18<br />
Located In Top Ten Corridors<br />
2 points maximum<br />
If the <strong>BRT</strong> corridor is located along one of the<br />
top ten corridors, in terms of aggregate bus<br />
ridership, this will help ensure a significant<br />
proportion of passengers benefit from<br />
the improvements. Points are awarded to<br />
systems that have made a good choice <strong>for</strong><br />
the <strong>BRT</strong> corridor, regardless of the level of<br />
total dem<strong>and</strong>.<br />
Scoring Guidelines: If all top ten dem<strong>and</strong><br />
corridors have already benefited from public<br />
transport infrastructure improvements <strong>and</strong><br />
the corridor, there<strong>for</strong>e, lies outside the top<br />
ten, all points are awarded.<br />
corridor location<br />
points<br />
Corridor is one of top ten dem<strong>and</strong> corridors 2<br />
Corridor is outside top ten dem<strong>and</strong> corridors 0<br />
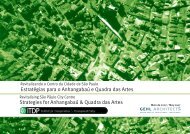
This map showing the<br />
dem<strong>and</strong> from roadbased<br />
transit highlights<br />
that the first corridor<br />
of Johannesburg’s <strong>BRT</strong><br />
(in red) is one of the top<br />
corridors. The higher the<br />
dem<strong>and</strong> the wider the<br />
green <strong>and</strong> red lines.<br />
Hours of Operations<br />
2 points maximum<br />
A viable transit service must be available to<br />
passengers <strong>for</strong> as many hours throughout the day<br />
<strong>and</strong> week as possible. Otherwise, passengers<br />
could end up str<strong>and</strong>ed or may simply seek<br />
another mode.<br />
Scoring Guidelines: Late-night service refers to<br />
service until midnight <strong>and</strong> weekend service refers<br />
to both weekend days.<br />
operating hours<br />
points<br />
Both late-night <strong>and</strong> weekend service 2<br />
Late-night service, no weekends OR 1<br />
weekend service, no late-nights<br />
No late-night or weekend service 0<br />
TransJakarta,<br />
Jakarta, Indonesia<br />
Photo: Matt Johnson
The <strong>BRT</strong> <strong>St<strong>and</strong>ard</strong> Version 1.0 19<br />
Map of all existing <strong>and</strong><br />
potential <strong>BRT</strong> corridors<br />
in Jakarta, Indonesia.<br />
Multi-corridor Network<br />
2 points maximum<br />
Ideally, <strong>BRT</strong> should include multiple corridors<br />
that intersect <strong>and</strong> <strong>for</strong>m a network as this exp<strong>and</strong>s<br />
travel options <strong>for</strong> passengers <strong>and</strong> makes the<br />
system as a whole, more viable. When designing a<br />
new system, some anticipation of future corridors<br />
is useful to ensure the designs will be compatible<br />
with later developments. For this reason, a longterm<br />
plan is recognized.<br />
multi-corridor network<br />
points<br />
Part of an existing or planned <strong>BRT</strong> network 2<br />
No <strong>BRT</strong> network planned or built 0
The <strong>BRT</strong> <strong>St<strong>and</strong>ard</strong> Version 1.0<br />
20<br />
Busway Alignment<br />
7 points maximum<br />
The busway is best located where conflicts with<br />
other traffic can be minimized, especially from<br />
turning movements from mixed-traffic lanes.<br />
In most cases, the central verge of a roadway<br />
encounters fewer conflicts with turning vehicles<br />
than those closer to the curb, due to alleys,<br />
parking lots, etc. Additionally, while delivery<br />
vehicles <strong>and</strong> taxis generally require access to the<br />
curb, the central verge of the road usually remains<br />
free of such obstructions. All of the design<br />
configuration recommendations detailed below<br />
are related to minimizing the risk of delays caused<br />
by turning conflicts <strong>and</strong> obstructions.<br />
Scoring Guidelines: This scoring is weighted<br />
using the percentage of the trunk corridor of a<br />
particular configuration multiplied by the points<br />
associated with that configuration <strong>and</strong> then<br />
adding those numbers together.<br />
trunk corridor configurations<br />
points<br />
Two-way median-aligned busways that are in the central verge of a two-way road 7<br />
Bus-only corridors where there is a fully exclusive right-of-way <strong>and</strong> no parallel mixed traffic, 7<br />
such as transit malls (e.g. Bogotá, Curitiba, Quito, <strong>and</strong> Pereira), <strong>and</strong> converted rail corridors<br />
(e.g. Cape Town <strong>and</strong> Los Angeles)<br />
Busways that run adjacent to an edge condition like a waterfront or park where there are 7<br />
few intersections to cause conflicts<br />
Busways that run two-way on the side of a one-way street 5<br />
Busways that are split into two one-way pairs but are centrally aligned in the roadway 4<br />
Busways that are split into two one-way pairs but aligned to the curb 1<br />
Busways that operate through virtual lanes produced by a series of bus queue-jump lanes 1<br />
at intersections<br />
Curb-aligned busway that is adjacent to the curb <strong>and</strong> protected by parking 1<br />
Curb-aligned busway that is adjacent to the parking lane <strong>and</strong> the stations are located 0<br />
on the bus bulb
The <strong>BRT</strong> <strong>St<strong>and</strong>ard</strong> Version 1.0 21<br />
Sidewalk<br />
Possible configurations<br />
Sidewalk<br />
Bike<br />
Lane<br />
Sidewalk<br />
Bike<br />
Lane<br />
Mixed<br />
Sidewalk<br />
Traffic Lanes<br />
Mixed Traffic Lanes<br />
Passing<br />
Lane Sidewalk<br />
Bus<br />
Lane Bike<br />
Lane<br />
Sidewalk<br />
Station<br />
Bus<br />
Mixed Traffic LanesLane<br />
Passing<br />
Passing Lane<br />
Lane<br />
These sections are only meant to show an example <strong>and</strong> are not meant to be inclusive of all possible configurations per type.<br />
Passing<br />
Lane<br />
Bus<br />
Lane<br />
Station<br />
Bus<br />
Lane<br />
Passing<br />
Lane<br />
Bus<br />
Lane<br />
Lane<br />
Mixed Traffic Lanes<br />
Bike<br />
Mixed Traffic Lanes<br />
Bike<br />
Sidewalk<br />
Sidewa<br />
Station<br />
Lane Bus Pas<br />
Sidewalk Lane<br />
La<br />
Example of two- way median aligned busway<br />
that is in the central verge of a two-way road<br />
7 points<br />
Sidewalk<br />
Sidewalk<br />
Bike<br />
Lane<br />
Sidewalk<br />
Busway<br />
Bike<br />
Mixed Traffic Lanes Passing Bus<br />
Lane Mixed Traffic<br />
Sidewalk<br />
Lanes Passing Lane<br />
Busway<br />
Bus Lane<br />
Sidewalk<br />
Station<br />
Sidewalk<br />
Lane<br />
Lane<br />
Sidewalk<br />
Sidewalk<br />
Station<br />
Sidewalk<br />
Bus<br />
Lane<br />
Bus Passing<br />
LanePassing<br />
Lane<br />
Lane Busway<br />
Mixed Traffic Lanes<br />
Mixed Traffic Lanes<br />
Bike<br />
Sidewalk<br />
Sidewalk Lane<br />
Sidewalk<br />
Bike Sidewalk<br />
Lane Sidewalk<br />
Example of a<br />
bus-only<br />
corridor where<br />
there is<br />
exclusive<br />
right-of-way<br />
<strong>and</strong> no parallel<br />
mixed traffic<br />
7 points<br />
Sidewalk<br />
Mixed Traffic<br />
Two-way Busway<br />
Bike<br />
Lane<br />
Example of busway<br />
that runs two-way<br />
on the side of a<br />
one-way street<br />
5 points<br />
Sidewalk<br />
Sidewalk<br />
Sidewalk<br />
Sidewalk<br />
Busway<br />
Mixed Traffic<br />
Two-way Busway<br />
Busway<br />
Sidewalk<br />
Sidewalk<br />
Bike<br />
Sidewalk Lane<br />
Sidewalk<br />
Mixed Traffic<br />
Two-way Busway<br />
Bike<br />
Lane<br />
Sidewalk<br />
Example of a bus-only corridor<br />
where there is exclusive right-of-way<br />
<strong>and</strong> no parallel mixed traffic<br />
4 points<br />
Sidewalk Bike One Way<br />
Lane Mixed<br />
Sidewalk Sidewalk Mixed Traffic Bike<br />
Traffic<br />
Two-way One Way Busway Station<br />
Sidewalk Mixed Traffic<br />
Lane Mixed<br />
Two-way Busway<br />
Bike<br />
Traffic<br />
Lane<br />
Station<br />
One Way<br />
Bus Lane<br />
Bike One Way Sidewalk Passing<br />
Lane Bus Lane Sidewalk Lane Bike<br />
Sidewalk<br />
Lane<br />
Passing<br />
Lane<br />
One Way<br />
One Mixed Way<br />
Mixed Traffic<br />
Traffic<br />
One Way Bike<br />
Mixed Lane<br />
Traffic<br />
Bike Sidewalk<br />
Lane Station<br />
Sidewalk<br />
One Way<br />
Bus Lane<br />
Passing<br />
Lane<br />
One Way<br />
Mixed<br />
Traffic<br />
Bike<br />
Lane<br />
Sidewalk<br />
Example of<br />
curb-aligned busway<br />
that is adjacent<br />
to the curb <strong>and</strong><br />
protected by parking<br />
1 point<br />
Sidewalk<br />
Sidewalk<br />
Bike<br />
Lane<br />
Bike One Way Station<br />
One Way Passing One Way Bike Sidewalk<br />
One Lane Way MixedSidewalk<br />
Station<br />
Parking One Way Bus One Lane Passing Way Lane Parking One Way Mixed Bike Bus Lane Lane Sidewalk Sidewalk<br />
Mixed Traffic<br />
Bus Lane Lane Mixed Lane Lane Mixed Traffic Lane<br />
Traffic Sidewalk<br />
Parking One Way<br />
Traffic<br />
Parking Bus TrafficMedian<br />
Lane<br />
Sidewalk<br />
Lane Mixed Lane<br />
Sidewalk<br />
Parking One Way<br />
Traffic<br />
Median<br />
Lane Mixed<br />
Traffic<br />
Parking Bus Lane<br />
Lane<br />
Median<br />
Sidewalk
The <strong>BRT</strong> <strong>St<strong>and</strong>ard</strong> Version 1.0<br />
22<br />
Megabus, Pereira,<br />
Colombia illustrates<br />
full segregation.<br />
Segregated Right-of-way<br />
7 points maximum<br />
A segregated right-of-way is vital to ensuring<br />
that buses can move quickly <strong>and</strong> unimpeded<br />
by congestion. Physical design is critical to<br />
the self-en<strong>for</strong>cement of the right-of-way.<br />
Physical segregation matters the most in<br />
heavily congested areas where it is harder to<br />
take a lane away from mixed traffic to dedicate<br />
it as a bus lane. En<strong>for</strong>cement of the dedicated<br />
lanes can be h<strong>and</strong>led in different ways <strong>and</strong><br />
can have varying degrees of permeability (e.g.<br />
delineators, electronic bollards, car traps, camera<br />
en<strong>for</strong>cement, <strong>and</strong> lane colorization). In some<br />
designs the bus stations themselves can act as a<br />
barrier. Some permeability is generally advised<br />
as buses occasionally break down <strong>and</strong> block the<br />
busway or otherwise need to leave the corridor.<br />
Delineators are road markers that define the<br />
busway, but are not a physical barrier. Other<br />
vehicles can easily cross the barrier into the<br />
busway. Delineators act as slight barriers that<br />
need en<strong>for</strong>cement to be effective. Full segregation<br />
means that the lane is physically protected,<br />
thus self-en<strong>for</strong>cing. Colorization acts as a visual<br />
delineator only.<br />
Scoring Guidelines: The scoring system is based<br />
on the amount of corridor that has physicallysegregated<br />
right-of-way, <strong>and</strong> the placement of<br />
that segregation in relation to observed peak-hour<br />
congestion.<br />
type of segregated right-of-way<br />
points<br />
Delineators <strong>and</strong> colorization <strong>and</strong>/or full segregation applied to over 90% 7<br />
of the busway corridor length<br />
Delineators <strong>and</strong> colorization <strong>and</strong>/or full segregation applied to over 75% 6<br />
of the busway corridor length<br />
Delineators-only (without colorized pavement or other en<strong>for</strong>cement measures) 4<br />
applied to over 75% of the busway corridor length<br />
Delineators-only (without colorized pavement or other en<strong>for</strong>cement measures) 2<br />
applied to over 40% of the busway corridor length<br />
Colorized pavement with no delineators OR camera-en<strong>for</strong>cement with no delineators 1
The <strong>BRT</strong> <strong>St<strong>and</strong>ard</strong> Version 1.0 23<br />
Intersection Treatments<br />
6 points maximum<br />
There are several ways to increase bus<br />
speeds at intersections, all of which are<br />
aimed at increasing the green signal time<br />
<strong>for</strong> the bus lane. Forbidding turns across<br />
the bus lane <strong>and</strong> minimizing the number of<br />
traffic-signal phases where possible are the<br />
most important. Traffic-signal priority when<br />
activated by an approaching <strong>BRT</strong> vehicle is<br />
useful in lower-frequency systems.<br />
intersection treatment<br />
points<br />
All turns prohibited across the busway 6<br />
Most turns prohibited across the busway 5<br />
Approximately half of the turns prohibited 4<br />
across the busway <strong>and</strong> some signal priority<br />
Some turns prohibited across the busway 3<br />
<strong>and</strong> some signal priority<br />
No turns prohibited across the busway 2<br />
but signal priority at most or all intersections<br />
No turns prohibited across the busway 1<br />
but some intersections have signal priority<br />
No intersection treatments 0<br />
Left turns are not allowed at<br />
this intersection along the<br />
<strong>BRT</strong> corridor in Las Vegas, USA.
The <strong>BRT</strong> <strong>St<strong>and</strong>ard</strong> Version 1.0<br />
24<br />
TransMilenio, Bogotá, Colombia<br />
was the first to introduce<br />
passing lanes at stations,<br />
increasing the system’s capacity.<br />
Passing Lanes at Stations<br />
4 points maximum<br />
Passing lanes at station stops are critical to allow<br />
both express <strong>and</strong> local services. They also allow<br />
stations to accommodate a high volume of buses<br />
without getting congested from backed-up buses<br />
waiting to enter. While more difficult to justify in<br />
low-dem<strong>and</strong> systems, passing lanes are a good<br />
investment, yielding considerable passenger<br />
travel time savings <strong>and</strong> allowing <strong>for</strong> flexibility<br />
as the system grows.<br />
passing lanes<br />
points<br />
At every trunk station 4<br />
At 75% of trunk stations 3<br />
At 50% of trunk stations 2<br />
At 25% of trunk stations 1<br />
At no trunk stations 0
The <strong>BRT</strong> <strong>St<strong>and</strong>ard</strong> Version 1.0 25<br />
Minimizing Bus Emissions<br />
4 points maximum<br />
Bus tailpipe emissions are typically a large source<br />
of urban air pollution. Especially at risk are bus<br />
passengers <strong>and</strong> people living or working near<br />
roadsides. In general, the pollutant emissions of<br />
highest concern from urban buses are particulate<br />
matter (PM) <strong>and</strong> nitrogen oxides (NOx). Minimizing<br />
these emissions is critical to the health of both<br />
passengers <strong>and</strong> the general urban population.<br />
The primary determinant of tailpipe emission<br />
levels is the stringency of governments’ emissions’<br />
st<strong>and</strong>ards. While some fuels tend to produce lower<br />
emissions, like natural gas, new emission controls<br />
have enabled even diesel buses to meet extremely<br />
clean st<strong>and</strong>ards. Moreover, “clean” fuels do not<br />
guarantee low emissions of all pollutants. As a<br />
result, our scoring is based on certified emissions<br />
st<strong>and</strong>ards rather than fuel type.<br />
Over the last two decades, the European Union<br />
<strong>and</strong> the United States have adopted a series of<br />
progressively tighter emissions st<strong>and</strong>ards that are<br />
being used <strong>for</strong> this scoring system. Buses must be<br />
in compliance with Euro VI <strong>and</strong> U.S. 2010 emission<br />
st<strong>and</strong>ards to receive 4 points. These st<strong>and</strong>ards<br />
result in extremely low emissions of both PM <strong>and</strong><br />
NOx. For diesel vehicles, these st<strong>and</strong>ards require<br />
the use of PM traps, ultra-low sulfur diesel fuel,<br />
<strong>and</strong> selective catalytic reduction. To receive three<br />
points, buses need to be certified to Euro IV or V<br />
with PM traps (note: 50 ppm sulfur diesel fuel or<br />
lower required <strong>for</strong> PM traps to function effectively).<br />
Vehicles certified to the Euro IV <strong>and</strong> V<br />
st<strong>and</strong>ards that do not require traps emit twice<br />
as much PM as vehicles meeting more recent<br />
st<strong>and</strong>ards. There<strong>for</strong>e, these vehicles are awarded<br />
two points. Ideally, buses will include contractually<br />
stipulated requirements in the purchase order to<br />
control real-world NOx emissions from buses in<br />
use, because the actual NOx emissions from urban<br />
buses certified to Euro IV <strong>and</strong> V have been tested<br />
at levels substantially higher than certified levels.<br />
emissions st<strong>and</strong>ards<br />
points<br />
Euro VI or U.S. 2010 4<br />
Euro IV or V with PM traps 3<br />
Euro IV or V 2<br />
U.S. 2004 or Euro III 1<br />
Below Euro III 0<br />
Because that is hard to verify, it is included as a<br />
recommendation, but not as a requirement, <strong>for</strong><br />
receiving the two points.<br />
Only one point is awarded <strong>for</strong> U.S.<br />
2004 <strong>and</strong> Euro III st<strong>and</strong>ards, because<br />
these st<strong>and</strong>ards allow ten times as much<br />
PM emissions as the U.S. 2010 <strong>and</strong> Euro<br />
VI st<strong>and</strong>ards. Buses certified to emission<br />
st<strong>and</strong>ards less stringent than Euro III receive<br />
zero points.<br />
Buses also generate greenhouse<br />
gas emissions. Since no clear regulatory<br />
framework exists that requires bus<br />
manufacturers to meet specific greenhouse<br />
gas emission targets or fuel-efficiency<br />
st<strong>and</strong>ards, there is no obvious way to identify<br />
a fuel-efficient bus by vehicle type. For CO2<br />
impacts, we recommend the use of the TEEMP<br />
model which incorporates the <strong>BRT</strong> <strong>St<strong>and</strong>ard</strong><br />
into a broader assessment of project-specific<br />
CO2 impacts.<br />
Rea Vaya introduced<br />
Euro IV buses <strong>for</strong> the<br />
first time to the country.<br />
Johannesburg, South Africa
The <strong>BRT</strong> <strong>St<strong>and</strong>ard</strong> Version 1.0<br />
26<br />
Stations Set Back from Intersections<br />
3 points maximum<br />
Stations should be located at least <strong>for</strong>ty meters<br />
from intersections to avoid delays. When stations<br />
are located just beyond the intersection, delays<br />
can be caused when passengers take a long time<br />
to board or alight <strong>and</strong> the docked bus blocks<br />
others from pulling through the intersection. If<br />
stations are located just be<strong>for</strong>e an intersection,<br />
the traffic signal can delay buses from moving<br />
from the station <strong>and</strong> thus not allow other buses<br />
to pull in. The risk of conflict remains acute,<br />
particularly as frequency increases. Separating<br />
the stations from the intersections is critical to<br />
mitigating these problems.<br />
Scoring Guidelines: The distance from the<br />
intersection is defined as the stop line at the<br />
intersection to the front of a bus at the <strong>for</strong>wardmost<br />
docking bay.<br />
station location<br />
points<br />
100% of trunk stations are at least 3<br />
one of the following:<br />
• Set back at least 40 m (120 ft.) from intersection<br />
• Fully exclusive busways with no intersections<br />
• Grade-separated stations where stations are<br />
at-grade<br />
• Stations located near intersection due to block<br />
length (such as downtowns where blocks are<br />
relatively short)<br />
65% of trunk stations meet above criteria 2<br />
35% of trunk stations meet above criteria 1<br />
0% of trunk stations meet above criteria 0<br />
Janmarg, Ahmedabad,<br />
India has stations that are<br />
not immediately adjacent<br />
to the intersection.
The <strong>BRT</strong> <strong>St<strong>and</strong>ard</strong> Version 1.0 27<br />
A center plat<strong>for</strong>m<br />
station in Quito,<br />
Ecuador is eligible.<br />
Center Stations<br />
3 points maximum<br />
Having a single station serving both directions<br />
of the <strong>BRT</strong> system makes transfers easier <strong>and</strong><br />
more convenient—something that becomes more<br />
important as the <strong>BRT</strong> network exp<strong>and</strong>s. It also<br />
tends to reduce construction costs <strong>and</strong> minimize<br />
the necessary right-of-way. In order to receive<br />
points, stations must have a center plat<strong>for</strong>m that<br />
serves both directions of service. Stations with side<br />
plat<strong>for</strong>ms <strong>and</strong> other stations that do not serve both<br />
directions of service are not eligible.<br />
center stations<br />
points<br />
100% of trunk stations have center plat<strong>for</strong>ms 3<br />
serving both directions of service<br />
65% of trunk stations 2<br />
35% of trunk stations 1<br />
0% of trunk stations 0<br />
Side plat<strong>for</strong>m stations<br />
in Quito, Ecuador are<br />
not eligible.
The <strong>BRT</strong> <strong>St<strong>and</strong>ard</strong> Version 1.0<br />
28<br />
Lima, Peru uses<br />
rein<strong>for</strong>ced concrete<br />
over entire busway.<br />
Pavement Quality<br />
2 points maximum<br />
Good-quality pavement ensures better<br />
service <strong>and</strong> operations <strong>for</strong> a longer period by<br />
minimizing the need <strong>for</strong> maintenance on the<br />
busway. Roadways with poor-quality pavement<br />
will need to be shut down more frequently<br />
<strong>for</strong> repairs. Buses will also have to slow down<br />
to drive carefully over damaged pavement.<br />
Rein<strong>for</strong>ced concrete is particularly important<br />
at stations where the <strong>for</strong>ce of frequent bus<br />
braking can quickly deteriorate more st<strong>and</strong>ard<br />
pavements. Continuously rein<strong>for</strong>ced concrete<br />
(CRC) is particularly advantageous as it avoids<br />
deterioration at joints <strong>and</strong> reduces noise levels.<br />
pavement materials<br />
points<br />
New rein<strong>for</strong>ced concrete designed to 2<br />
fifteen-year life or higher over entire corridor<br />
New rein<strong>for</strong>ced concrete designed to 1<br />
fifteen-year life only at stations<br />
Projected pavement duration is less 0<br />
than fifteen years
The <strong>BRT</strong> <strong>St<strong>and</strong>ard</strong> Version 1.0 29<br />
Plat<strong>for</strong>m-level Boarding<br />
6 points maximum<br />
Having the bus-station plat<strong>for</strong>m level with the bus<br />
floor is one of the most important ways of<br />
reducing boarding <strong>and</strong> alighting times per<br />
passenger. Passengers climbing steps, even<br />
relatively minor steps, can mean significant delay,<br />
particularly <strong>for</strong> the elderly, disabled, or people<br />
with suitcases or strollers. The reduction or<br />
elimination of the vehicle-to-plat<strong>for</strong>m gap is also<br />
key to customer safety <strong>and</strong> com<strong>for</strong>t. There is a<br />
range of measures to achieve gaps of less than<br />
5 cm (2 in.), including guided busways at stations,<br />
alignment markers, Kassel curbs, <strong>and</strong> boarding<br />
bridges. This does not take into account which<br />
technique is chosen, just so long as the gap is<br />
minimized.<br />
Scoring Guidelines: Station plat<strong>for</strong>ms should be<br />
at the same height as bus floors, regardless of the<br />
height chosen.<br />
percentage of buses<br />
with at-level boarding<br />
points<br />
100% of buses are plat<strong>for</strong>m level; 6<br />
system-wide measures <strong>for</strong> reducing<br />
the gap in place<br />
80% of buses; system-wide measures 5<br />
<strong>for</strong> reducing the gap in place<br />
60% of buses; system-wide measures 4<br />
<strong>for</strong> reducing the gap in place<br />
100% of buses are plat<strong>for</strong>m level with no<br />
other measures <strong>for</strong> reducing the gap in place<br />
40% of buses 3<br />
20% of buses 2<br />
10% of buses 1<br />
No plat<strong>for</strong>m-level boarding 0<br />
Janmarg, Ahmedabad, India
The <strong>BRT</strong> <strong>St<strong>and</strong>ard</strong> Version 1.0<br />
30<br />
El Mio, Cali, Colombia<br />
Safe <strong>and</strong> Com<strong>for</strong>table Stations<br />
3 points maximum<br />
One of the main distinguishing features of a <strong>BRT</strong><br />
system as opposed to st<strong>and</strong>ard bus service is<br />
a safe <strong>and</strong> com<strong>for</strong>table station environment.<br />
Attractive stations further elevate the status of<br />
service <strong>for</strong> the customer.<br />
Scoring Guidelines: Stations should be at least<br />
3.2 m (10.5 ft.) wide. This is the definition <strong>for</strong><br />
“wide” in the scoring chart below.<br />
stations<br />
points<br />
All trunk corridor stations wide, 3<br />
attractive, weather-protected<br />
Most trunk corridor stations wide, 2<br />
attractive, weather-protected<br />
Some trunk corridor stations wide, 1<br />
attractive, weather-protected
The <strong>BRT</strong> <strong>St<strong>and</strong>ard</strong> Version 1.0 31<br />
Nantes, France<br />
Number of Doors on Bus<br />
3 points maximum<br />
The speed of boarding <strong>and</strong> alighting is partially<br />
a function of the number of bus doors. Much<br />
like a subway in which a car has multiple wide<br />
doors, buses need the same in order to let higher<br />
volumes of people on <strong>and</strong> off the buses. One door<br />
or narrow doorways become bottlenecks that<br />
delay the bus.<br />
percentage of buses with<br />
3+ doors or 2 wide doors points<br />
100% 3<br />
65% 2<br />
35% 1<br />
0% 0<br />
Scoring Guidelines: Buses need to have three<br />
or more doors <strong>for</strong> articulated buses or two<br />
wide doors <strong>for</strong> regular buses to qualify <strong>for</strong> the<br />
below points.
The <strong>BRT</strong> <strong>St<strong>and</strong>ard</strong> Version 1.0<br />
32<br />
Lima, Peru<br />
Docking Bays <strong>and</strong> Sub-stops<br />
2 points maximum<br />
Multiple docking bays <strong>and</strong> sub-stops not only<br />
increase the capacity of a station, they help<br />
provide multiple services at the station as well.<br />
A station is composed of sub-stops that can<br />
connect to one another, but should be separated<br />
by a walkway long enough to allow buses to pass<br />
one sub-stop <strong>and</strong> dock at another. This reduces<br />
the risk of congestion by allowing a bus to pass<br />
a full sub-stop <strong>and</strong> dock at an empty one. Substops<br />
can have multiple docking bays—locations<br />
within one sub-stop where buses can pull up<br />
to let passengers on <strong>and</strong> off. They are usually<br />
adjacent to each other <strong>and</strong> allow a second bus to<br />
pull up behind another bus already at the station<br />
to let passengers on <strong>and</strong> off. A station may be<br />
composed of only one sub-stop.<br />
At minimum a station needs one sub-stop<br />
<strong>and</strong> two docking bays. It is usually recommended<br />
that one sub-stop not have more than two docking<br />
bays, but at that point another sub-stop can be<br />
added. Multiple docking bays <strong>and</strong> sub-stops are<br />
important regardless of the level of ridership.<br />
docking bays <strong>and</strong> sub-stops<br />
points<br />
At least two independent sub-stops 2<br />
at most stations<br />
Multiple docking bays but no independent 1<br />
sub-stops<br />
One docking bay <strong>and</strong> one sub-stop only 0
The <strong>BRT</strong> <strong>St<strong>and</strong>ard</strong> Version 1.0 33<br />
Lima, Peru, has sliding<br />
doors where the bus<br />
docks at the station.<br />
Sliding Doors in <strong>BRT</strong> Stations<br />
1 point maximum<br />
Sliding doors where passengers get on <strong>and</strong> off<br />
the buses inside the stations improve the quality<br />
of the station environment, reduce the risk of<br />
accidents, <strong>and</strong> prevent pedestrians from entering<br />
the station in unauthorized locations.<br />
sliding doors<br />
points<br />
All stations have sliding doors 1<br />
Otherwise 0<br />
Guangzhou, China’s<br />
<strong>BRT</strong> have sliding doors<br />
at the gates.
The <strong>BRT</strong> <strong>St<strong>and</strong>ard</strong> Version 1.0<br />
34<br />
Las Vegas, USA, has a<br />
good br<strong>and</strong> <strong>and</strong> strong<br />
identity that appeals to<br />
its customers—from the<br />
stations to the buses.<br />
Br<strong>and</strong>ing<br />
3 point maximum<br />
<strong>BRT</strong> promises a high quality of service, which is<br />
rein<strong>for</strong>ced by having a unique br<strong>and</strong> <strong>and</strong> identity.<br />
br<strong>and</strong>ing<br />
points<br />
All buses, routes, <strong>and</strong> stations in corridor 3<br />
follow single unifying br<strong>and</strong> of entire<br />
<strong>BRT</strong> system<br />
All buses, routes, <strong>and</strong> stations in corridor 2<br />
follow single unifying br<strong>and</strong>, but different<br />
from rest of the system<br />
Some buses, routes, <strong>and</strong> stations in corridor 1<br />
follow single unifying br<strong>and</strong>, regardless of<br />
rest of the system<br />
No corridor br<strong>and</strong> 0<br />
Las Vegas, USA, used<br />
old casino signs<br />
at stations, which<br />
rein<strong>for</strong>ced the city’s<br />
identity.
The <strong>BRT</strong> <strong>St<strong>and</strong>ard</strong> Version 1.0 35<br />
Guangzhou, China,<br />
has real time passenger<br />
in<strong>for</strong>mation systems.<br />
Passenger In<strong>for</strong>mation<br />
2 points maximum<br />
Numerous studies have shown that passenger<br />
satisfaction is linked to knowing when the next<br />
bus will arrive. Giving passengers in<strong>for</strong>mation is<br />
critical to a positive overall experience.<br />
Real-time passenger in<strong>for</strong>mation includes<br />
electronic panels, digital audio messaging<br />
(“Next bus” at stations, “Next stop” on buses),<br />
<strong>and</strong>/or dynamic in<strong>for</strong>mation on h<strong>and</strong>held devices.<br />
Static passenger in<strong>for</strong>mation refers to station <strong>and</strong><br />
vehicle signage, including network maps, route<br />
maps, local area maps, emergency indications,<br />
<strong>and</strong> other user in<strong>for</strong>mation.<br />
passenger in<strong>for</strong>mation<br />
points<br />
Real-time <strong>and</strong> static passenger in<strong>for</strong>mation 2<br />
corridor-wide (at stations <strong>and</strong> on vehicles)<br />
Moderate passenger in<strong>for</strong>mation 1<br />
(real-time or static)<br />
Very poor or no passenger in<strong>for</strong>mation 0
The <strong>BRT</strong> <strong>St<strong>and</strong>ard</strong> Version 1.0<br />
36<br />
Universal Access<br />
3 points maximum<br />
A <strong>BRT</strong> system should be accessible to all specialneeds<br />
customers, including those who are<br />
physically-, visually-, <strong>and</strong>/or hearing-impaired,<br />
as well as those with temporary disabilities, the<br />
elderly, children, parents with strollers, <strong>and</strong> other<br />
load-carrying passengers.<br />
Scoring Guidelines: Full accessibility means<br />
that all trunk stations, vehicles, <strong>and</strong> fare gates<br />
are universally accessible <strong>for</strong> wheelchairs.<br />
System includes drop curbs at all immediate<br />
intersections, Braille readers at all stations,<br />
<strong>and</strong> Tactile Ground Surface Indicators leading<br />
to all stations.<br />
universal accessibility<br />
points<br />
Full accessibility at all stations <strong>and</strong> vehicles 3<br />
Partial accessibility at all stations <strong>and</strong> vehicles 2<br />
Full or partial accessibility at some stations <strong>and</strong> vehicles 1<br />
Corridor not universally accessible 0<br />
Eugene, USA
The <strong>BRT</strong> <strong>St<strong>and</strong>ard</strong> Version 1.0 37<br />
Guangzhou, China, has<br />
physical integration, like<br />
this tunnel connecting<br />
the <strong>BRT</strong> to the Metro.<br />
Integration with Other Public Transport<br />
3 points maximum<br />
Often, when a <strong>BRT</strong> system is built in a city, a<br />
functioning public transport network already<br />
exists, be it rail, bus, or minibus. The <strong>BRT</strong> system<br />
should integrate into the rest of the public<br />
transport network. There are three components<br />
to <strong>BRT</strong> integration:<br />
• Physical transfer points: Physical transfer<br />
points should minimize walking between<br />
modes, be well-sized, <strong>and</strong> not require<br />
passengers to exit one system <strong>and</strong><br />
enter another<br />
• Fare payment: The fare system should be<br />
integrated so that one fare card may be used<br />
<strong>for</strong> all modes<br />
• In<strong>for</strong>mation: All transit modes, including <strong>BRT</strong>,<br />
should appear in a single set of in<strong>for</strong>mation.<br />
Thus, the <strong>BRT</strong> system should be integrated into<br />
existing public transport maps, <strong>and</strong> schedules<br />
should be available from a single source.<br />
Scoring Guidelines: The <strong>BRT</strong> corridor should<br />
integrate physically with other public transport<br />
modes where lines cross. If no lines cross, points<br />
may still be awarded <strong>for</strong> physical integration. If no<br />
other <strong>for</strong>mal public transport modes exist in the<br />
city, full points may be awarded <strong>for</strong> all aspects<br />
of integration.<br />
integration with<br />
other public transport<br />
points<br />
Integration of physical design, fare payment, 3<br />
<strong>and</strong> in<strong>for</strong>mational systems<br />
Integration of two of the following: 2<br />
physical design, fare payment, <strong>and</strong><br />
in<strong>for</strong>mational systems<br />
Integration of one of the following: 1<br />
physical design, fare payment, <strong>and</strong><br />
in<strong>for</strong>mational systems<br />
No integration 0
The <strong>BRT</strong> <strong>St<strong>and</strong>ard</strong> Version 1.0<br />
38<br />
Metrobus,<br />
Mexico City, Mexico<br />
Pedestrian Access<br />
3 points maximum<br />
A <strong>BRT</strong> system could be extremely well-designed<br />
<strong>and</strong> functioning but if passengers cannot access<br />
it safely, it cannot achieve its goals. Good<br />
pedestrian access is imperative in <strong>BRT</strong> system<br />
design. Additionally, as a new <strong>BRT</strong> system is a<br />
good opportunity <strong>for</strong> street <strong>and</strong> public-space<br />
redesign, existing pedestrian environments<br />
along the corridor should be improved.<br />
Good pedestrian access is defined as:<br />
• At-grade pedestrian crossings where<br />
pedestrians cross a maximum of two lanes<br />
be<strong>for</strong>e reaching a pedestrian refuge<br />
(sidewalk, median)<br />
• If crossing more than two lanes at once,<br />
a signalized crosswalk is provided<br />
• While at-grade crossings are preferred,<br />
pedestrian bridges or underpasses with working<br />
escalators or elevators can also be considered<br />
pedestrian access<br />
points<br />
Good, safe pedestrian access at every 3<br />
station <strong>and</strong> <strong>for</strong> a 500-meter catchment<br />
area surrounding the corridor<br />
Good, safe pedestrian access at every station 2<br />
<strong>and</strong> many improvements along corridor<br />
Good, safe pedestrian access at every station 1<br />
<strong>and</strong> modest improvements along corridor<br />
Not every station has good, safe pedestrian 0<br />
access <strong>and</strong> little improvement along corridor<br />
• A well-lit crosswalk where the footpath remains<br />
level <strong>and</strong> continuous
The <strong>BRT</strong> <strong>St<strong>and</strong>ard</strong> Version 1.0 39<br />
Secure bike parking in a<br />
terminal, TransMilenio,<br />
Bogotá, Colombia<br />
Secure Bicycle Parking<br />
2 points maximum<br />
The provision of bicycle parking at stations<br />
is necessary <strong>for</strong> passengers who wish to use<br />
bicycles as feeders to the <strong>BRT</strong> system. Formal<br />
bicycle-parking facilities that are secure (either<br />
by an attendant or observed by security camera)<br />
<strong>and</strong> weather protected are more likely to be used<br />
by passengers.<br />
bicycle parking<br />
points<br />
Secure bicycle parking at least in terminal 2<br />
stations <strong>and</strong> st<strong>and</strong>ard bicycle racks elsewhere<br />
<strong>St<strong>and</strong>ard</strong> bicycle racks in most stations 1<br />
Little or no bicycle parking 0<br />
Bike locker, Orange Line,<br />
Los Angeles, USA
The <strong>BRT</strong> <strong>St<strong>and</strong>ard</strong> Version 1.0<br />
40<br />
Parallel bike way to<br />
MyCiTi, Cape Town,<br />
South Africa<br />
Bicycle Lanes<br />
2 points maximum<br />
Bicycle-lane networks integrated with the <strong>BRT</strong><br />
corridor improve customer access, provide a full<br />
set of sustainable travel options, <strong>and</strong> enhance<br />
road safety.<br />
Bicycle lanes should ideally connect major<br />
residential areas, commercial centers, schools,<br />
<strong>and</strong> business centers to nearby <strong>BRT</strong> stations in<br />
order to provide the widest access. All such major<br />
destinations within at least two kilometers of a<br />
trunk corridor should be connected by a <strong>for</strong>mal<br />
cycle way.<br />
Moreover, in most cities, the best <strong>BRT</strong><br />
corridors are also the most desirable bicycle<br />
routes, as they are often the routes with the<br />
greatest travel dem<strong>and</strong>. Yet there is a shortage<br />
of safe cycling infrastructure on those same<br />
corridors. If some accommodation <strong>for</strong> cyclists<br />
is not made, it is possible that cyclists may use<br />
the busway. If the busway has not been designed<br />
<strong>for</strong> dual bike <strong>and</strong> bus use, it is a safety risk<br />
<strong>for</strong> bicyclists. Bicycle lanes should be built<br />
either within the same corridor or on a nearby<br />
parallel street.<br />
bicycle lanes<br />
points<br />
Bicycle lanes on or parallel to entire corridor 2<br />
Bicycle lanes do not span entire corridor 1<br />
No bicycle infrastructure 0
The <strong>BRT</strong> <strong>St<strong>and</strong>ard</strong> Version 1.0 41<br />
Bicycle-sharing Integration<br />
1 point maximum<br />
Having the option to make short trips from the<br />
<strong>BRT</strong> corridor by a shared bike is important to<br />
providing connectivity to some destinations.<br />
Operating costs of providing bus service to the<br />
last mile are often the highest cost of maintaining<br />
a <strong>BRT</strong> network (i.e., feeder buses), thus providing<br />
a low-cost bicycle-sharing alternative to feeders<br />
is generally seen as best practice.<br />
bicycle-sharing integration<br />
points<br />
Bicycle sharing at 50% of trunk 1<br />
stations minimum<br />
Bicycle sharing at less than 50% 0<br />
of trunk stations<br />
Bike share station<br />
along <strong>BRT</strong> corridor<br />
in Nantes, France
The <strong>BRT</strong> <strong>St<strong>and</strong>ard</strong> Version 1.0<br />
42<br />
Point Deductions<br />
Point deductions are only relevant to<br />
systems already in operation. They have<br />
been introduced as a way of mitigating<br />
the risk of recognizing a system as high<br />
quality that has made significant design<br />
errors or has significant management<br />
<strong>and</strong> per<strong>for</strong>mance weaknesses not readily<br />
observable during the design phase.<br />
The penalties from improperly sizing the<br />
infrastructure <strong>and</strong> operations or from poor<br />
system management are as follows >
The <strong>BRT</strong> <strong>St<strong>and</strong>ard</strong> Version 1.0 43<br />
Low Commercial Speeds:<br />
minimum average commercial<br />
speed below 13 kph (8 mph)<br />
-10 points<br />
Peak Passengers per Hour per<br />
Direction (pphpd) Below 1,000<br />
-5 points<br />
Most of the design features included in the<br />
scoring system will always result in higher<br />
speeds. However, there is an exception: higher<br />
dem<strong>and</strong> systems in which too many buses<br />
carrying too many passengers have been<br />
concentrated into a single lane. In this case,<br />
bus speeds could be lower than in mixed traffic<br />
conditions. To mitigate the risk of rewarding such<br />
a system with a quality st<strong>and</strong>ard, this penalty<br />
was imposed. Typical <strong>BRT</strong> operating speeds <strong>for</strong><br />
the better systems in central city areas tend to<br />
be about 15 kph (9.3 mph), so speeds below<br />
this indicate the system has been badly “fit” to<br />
the dem<strong>and</strong>. A penalty rather than a minimum<br />
qualification criterion <strong>for</strong> a slow speed <strong>BRT</strong> (as<br />
was previously used) allows such a system to still<br />
be considered <strong>BRT</strong>, but to achieve a lower score.<br />
Scoring Guidelines: The minimum average<br />
commercial speed refers to the system-wide<br />
average speed <strong>and</strong> not the average speed at the<br />
slowest link. A speed of 13 kph can generally<br />
be achieved in mixed-traffic conditions in a<br />
downtown area. If lower, all ten points should<br />
be deducted.<br />
Where commercial speed is not readily<br />
available, the full penalty should be imposed<br />
if buses are backing up at many <strong>BRT</strong> stations<br />
or junctions.<br />
low commercial speeds<br />
points<br />
<strong>BRT</strong> systems with ridership levels below 1,000<br />
passengers per peak hour per direction (pphpd)<br />
are carrying fewer passengers than a normal<br />
mixed-traffic lane. Very low ridership can be an<br />
indication that other bus services continue to<br />
operate in the corridor along side, <strong>and</strong> competing<br />
with, the <strong>BRT</strong> system. Alternatively, it indicates<br />
that a corridor was poorly selected.<br />
Almost all cities have corridors carrying at<br />
least 1,000 pphpd. Many cities, however, have<br />
corridors where transit dem<strong>and</strong> is very low, even<br />
below this level. While many Gold-<strong>St<strong>and</strong>ard</strong><br />
<strong>BRT</strong> features would still bring benefits in these<br />
conditions, it is unlikely that such levels would<br />
justify the cost <strong>and</strong> dedicated right-of-way<br />
intrinsic to <strong>BRT</strong>. This penalty has been created to<br />
penalize systems which have done a poor job of<br />
service planning or corridor selection, while not<br />
overly penalizing smaller, car-oriented cities with<br />
low transit dem<strong>and</strong>.<br />
Scoring Guidelines: All five points should be<br />
deducted if the ridership on the link in the corridor<br />
with maximum peak-hour ridership is under 1,000<br />
pphpd in the peak hour. Otherwise, no deduction<br />
is necessary.<br />
peak passengers per hour<br />
per direction (pphpd)<br />
points<br />
PPHPD below 1,000 -5<br />
Minimum average commercial speed -10<br />
is below 13 kph (8 mph)
The <strong>BRT</strong> <strong>St<strong>and</strong>ard</strong> Version 1.0<br />
44<br />
Lack of En<strong>for</strong>cement of Right-of-Way<br />
-5 points MAXIMUM<br />
En<strong>for</strong>cing the exclusive right-of-way of the<br />
busway is critical to achieving higher bus speeds,<br />
but the means by which it is en<strong>for</strong>ced are multiple<br />
<strong>and</strong> somewhat context specific. The committee<br />
generally recommends on-board camera<br />
en<strong>for</strong>cement <strong>and</strong> regular policing at points of<br />
frequent encroachment, coupled with high fines<br />
<strong>for</strong> violators, to minimize invasions of the lanes<br />
by non-authorized vehicles. Camera en<strong>for</strong>cement<br />
at high-risk locations is somewhat less<br />
effective, however, the selection of appropriate<br />
en<strong>for</strong>cement is left to local conditions.<br />
lack of en<strong>for</strong>cement<br />
points<br />
Regular encroachment on <strong>BRT</strong> right-of-way -5<br />
Some encroachment on <strong>BRT</strong> right-of-way -3<br />
Occaisional encroachment on -1<br />
<strong>BRT</strong> right-of-way<br />
Significant Gap Between<br />
Bus Floor <strong>and</strong> Station Plat<strong>for</strong>m<br />
-5 points MAXIMUM<br />
Even systems that have been designed to<br />
accommodate plat<strong>for</strong>m-level boarding could<br />
have gaps if the buses do not dock properly. A<br />
significant gap between the plat<strong>for</strong>m <strong>and</strong> the<br />
bus floor undermines the time-savings benefits<br />
of plat<strong>for</strong>m-level boarding <strong>and</strong> introduces a<br />
significant safety risk <strong>for</strong> passengers. Such gaps<br />
could occur <strong>for</strong> a variety of reasons, from poor<br />
basic design to poor driver training. Technical<br />
opinion varies on the best way to minimize the<br />
gap. Most experts feel that optical-guidance<br />
gap minimization<br />
systems are more expensive <strong>and</strong> less effective<br />
than measures such as the use of simple painted<br />
alignment markers <strong>and</strong> special curbs at station<br />
plat<strong>for</strong>ms where the drivers are able to feel the<br />
wheel touching the curb, yet the curb does not<br />
damage the wheel. Boarding bridges are used<br />
successfully in many systems <strong>and</strong> would tend to<br />
eliminate gap problems.<br />
points<br />
Large gaps everywhere or kneeling buses required to minimize gaps -5<br />
Slight gap remaining at some stations, large gap at remaining stations -4<br />
Slight gap at most stations -3<br />
No gap at some stations, slight gap at remaining stations -2<br />
No gap at most stations, slight gap at remaining stations -1<br />
No gap at all stations 0
The <strong>BRT</strong> <strong>St<strong>and</strong>ard</strong> Version 1.0 45<br />
Station Encroaches on<br />
Sidewalk or Busway<br />
-3 points MAXIMUM<br />
Overcrowding<br />
-3 points<br />
Some <strong>BRT</strong> systems have been observed where<br />
the sidewalk has been significantly narrowed,<br />
encroached upon, or even eliminated to make<br />
space <strong>for</strong> the <strong>BRT</strong> system. In one case, the busway<br />
right-of-way dropped below three meters at the<br />
station stop in order to avoid encroaching on the<br />
mixed-traffic lane. Rather than giving additional<br />
points <strong>for</strong> these elements of st<strong>and</strong>ard design<br />
practice it was decided, instead, to penalize<br />
their violation.<br />
Scoring Guidelines: The sidewalk at station stops<br />
should be of a consistent width to the sidewalk in<br />
other parts of the corridor <strong>and</strong> the sidewalk width<br />
should not drop below 2 m (6.5 ft.). The rightof-way<br />
<strong>for</strong> the busway should be no less than<br />
3.5 m (12 ft.) per lane or 3 m (10 ft.) per lane at a<br />
<strong>BRT</strong> station stop.<br />
station enchroachment<br />
points<br />
Multiple encroachments of bus stops -3<br />
or stations on the sidewalk or busway<br />
Some encroachments of bus stops -2<br />
or stations on the sidewalk or busway<br />
One encroachment of a bus stop -1<br />
or station on the sidewalk or busway<br />
This was included because many systems which<br />
are generally well-designed are being operated<br />
such that buses are so overcrowded that the<br />
systems become alienating to passengers.<br />
While average “passenger st<strong>and</strong>ing density” is<br />
a reasonable indicator, getting this in<strong>for</strong>mation<br />
is not easy so we have allowed a more subjective<br />
measure to be used in cases of obvious<br />
overcrowding.<br />
Scoring Guidelines: The full penalty should be<br />
imposed if the average passenger density <strong>for</strong><br />
buses during the peak hour is greater than five<br />
passengers per square meter (0.46 per square<br />
ft.). If this metric is not available, then clearly<br />
visible signs of overcrowding on buses or in<br />
stations should be used, such as doors on the<br />
buses regularly being unable to close, stations<br />
overcrowded with passengers because they are<br />
unable to board buses that are full, etc.<br />
overcrowding<br />
points<br />
Average passenger density during -3<br />
peak hour is > 5 passengers/sq. m<br />
(.46/sq. ft.), or clearly visible signs<br />
of overcrowding present
The <strong>BRT</strong> <strong>St<strong>and</strong>ard</strong> Version 1.0<br />
46<br />
Poorly-maintained Buses <strong>and</strong> Stations<br />
-3 points MAXIMUM<br />
Even a <strong>BRT</strong> system that is well built <strong>and</strong> attractive<br />
can fall into disrepair. It is important that buses<br />
<strong>and</strong> stations be regularly cleaned <strong>and</strong> maintained.<br />
maintenance of<br />
buses <strong>and</strong> stations<br />
points<br />
Stations <strong>and</strong> station approaches -3<br />
with plat<strong>for</strong>m or roof damage, graffiti,<br />
litter, occupancy by vagrants or vendors<br />
Poor maintenance of buses with -2<br />
litter on floor, graffiti, <strong>and</strong> damaged seats<br />
Buses <strong>and</strong> stations are somewhat dirty -1<br />
<strong>and</strong> unmaintained<br />
Distances Between Stations<br />
Too Long or Too Short<br />
-2 points<br />
In a consistently built-up area, the distance<br />
between station stops optimizes at around 450 m<br />
(1,476 ft.) between stations. Beyond this, more<br />
time is imposed on customers walking to stations<br />
than is saved by higher bus speeds. Below<br />
this distance, bus speeds will be reduced by<br />
more than the time saved with shorter walking<br />
distances. Thus, in keeping reasonably consistent<br />
with optimal station spacing, average distances<br />
between stations should not exceed 0.8 km (0.5<br />
mi.), <strong>and</strong> should not be below 0.3 km (0.2 mi.).<br />
distance between stations<br />
points<br />
Stations are spaced, on average, -2<br />
more than 0.8 km (0.5 mi.) or less than<br />
0.3 km (0.2 mi.) apart
The <strong>BRT</strong> <strong>St<strong>and</strong>ard</strong> Version 1.0 47<br />
9 East 19th Street, 7th Floor, New York, NY, 10003<br />
tel +1 212 629 8001 fax +1 646 380 2360<br />
Deutsche Gesellschaft für Internationale Zusammenarbeit (GIZ) GmbH<br />
Dag-Hammarskjöld-Weg 1-5 65760 Eschborn Germany<br />
tel +49 6196 79-0 fax +49 6196 79-1115