D R A F T Application of PARAMICS Simulation At a Diamond ...
D R A F T Application of PARAMICS Simulation At a Diamond ...
D R A F T Application of PARAMICS Simulation At a Diamond ...

Create successful ePaper yourself
Turn your PDF publications into a flip-book with our unique Google optimized e-Paper software.
<strong>Application</strong> <strong>of</strong> <strong>PARAMICS</strong> <strong>Simulation</strong> at a <strong>Diamond</strong> Interchange Page 13<br />
(i.e., 90% or 95% level <strong>of</strong> confidence), according to commonly accepted statistical<br />
principles.<br />
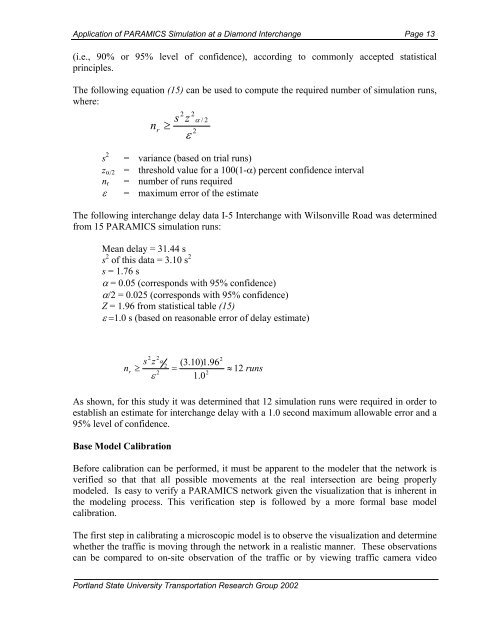
The following equation (15) can be used to compute the required number <strong>of</strong> simulation runs,<br />
where:<br />
s 2<br />
n r<br />
≥<br />
s<br />
2<br />
z<br />
2<br />
ε<br />
2<br />
α / 2<br />
= variance (based on trial runs)<br />
z α/2 = threshold value for a 100(1-α) percent confidence interval<br />
n r = number <strong>of</strong> runs required<br />
ε = maximum error <strong>of</strong> the estimate<br />
The following interchange delay data I-5 Interchange with Wilsonville Road was determined<br />
from 15 <strong>PARAMICS</strong> simulation runs:<br />
Mean delay = 31.44 s<br />
s 2 <strong>of</strong> this data = 3.10 s 2<br />
s = 1.76 s<br />
α = 0.05 (corresponds with 95% confidence)<br />
α/2 = 0.025 (corresponds with 95% confidence)<br />
Z = 1.96 from statistical table (15)<br />
ε =1.0 s (based on reasonable error <strong>of</strong> delay estimate)<br />
2 2<br />
s z α<br />
2<br />
2<br />
(3.10)1.96<br />
n r<br />
≥ =<br />
≈ 12 runs<br />
2<br />
2<br />
ε 1.0<br />
As shown, for this study it was determined that 12 simulation runs were required in order to<br />
establish an estimate for interchange delay with a 1.0 second maximum allowable error and a<br />
95% level <strong>of</strong> confidence.<br />
Base Model Calibration<br />
Before calibration can be performed, it must be apparent to the modeler that the network is<br />
verified so that that all possible movements at the real intersection are being properly<br />
modeled. Is easy to verify a <strong>PARAMICS</strong> network given the visualization that is inherent in<br />
the modeling process. This verification step is followed by a more formal base model<br />
calibration.<br />
The first step in calibrating a microscopic model is to observe the visualization and determine<br />
whether the traffic is moving through the network in a realistic manner. These observations<br />
can be compared to on-site observation <strong>of</strong> the traffic or by viewing traffic camera video<br />
Portland State University Transportation Research Group 2002