Generating Transit Performance Measures with ... - Transportation
Generating Transit Performance Measures with ... - Transportation
Generating Transit Performance Measures with ... - Transportation

You also want an ePaper? Increase the reach of your titles
YUMPU automatically turns print PDFs into web optimized ePapers that Google loves.
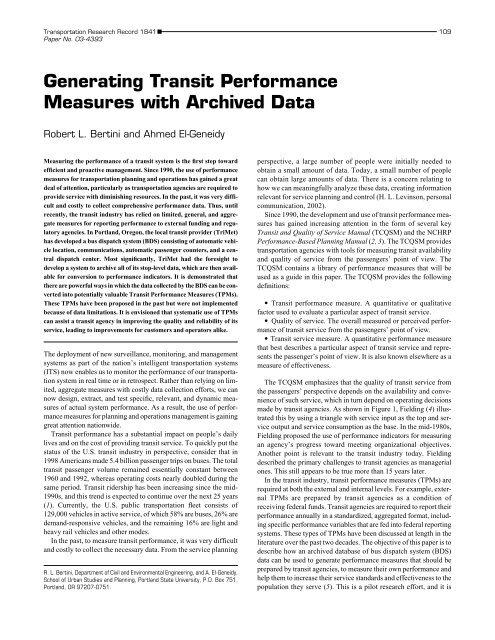
<strong>Transportation</strong> Research Record 1841■ 109<br />
Paper No. 03-4393<br />
<strong>Generating</strong> <strong>Transit</strong> <strong>Performance</strong><br />
<strong>Measures</strong> <strong>with</strong> Archived Data<br />
Robert L. Bertini and Ahmed El-Geneidy<br />
Measuring the performance of a transit system is the first step toward<br />
efficient and proactive management. Since 1990, the use of performance<br />
measures for transportation planning and operations has gained a great<br />
deal of attention, particularly as transportation agencies are required to<br />
provide service <strong>with</strong> diminishing resources. In the past, it was very difficult<br />
and costly to collect comprehensive performance data. Thus, until<br />
recently, the transit industry has relied on limited, general, and aggregate<br />
measures for reporting performance to external funding and regulatory<br />
agencies. In Portland, Oregon, the local transit provider (TriMet)<br />
has developed a bus dispatch system (BDS) consisting of automatic vehicle<br />
location, communications, automatic passenger counters, and a central<br />
dispatch center. Most significantly, TriMet had the foresight to<br />
develop a system to archive all of its stop-level data, which are then available<br />
for conversion to performance indicators. It is demonstrated that<br />
there are powerful ways in which the data collected by the BDS can be converted<br />
into potentially valuable <strong>Transit</strong> <strong>Performance</strong> <strong>Measures</strong> (TPMs).<br />
These TPMs have been proposed in the past but were not implemented<br />
because of data limitations. It is envisioned that systematic use of TPMs<br />
can assist a transit agency in improving the quality and reliability of its<br />
service, leading to improvements for customers and operators alike.<br />
The deployment of new surveillance, monitoring, and management<br />
systems as part of the nation’s intelligent transportation systems<br />
(ITS) now enables us to monitor the performance of our transportation<br />
system in real time or in retrospect. Rather than relying on limited,<br />
aggregate measures <strong>with</strong> costly data collection efforts, we can<br />
now design, extract, and test specific, relevant, and dynamic measures<br />
of actual system performance. As a result, the use of performance<br />
measures for planning and operations management is gaining<br />
great attention nationwide.<br />
<strong>Transit</strong> performance has a substantial impact on people’s daily<br />
lives and on the cost of providing transit service. To quickly put the<br />
status of the U.S. transit industry in perspective, consider that in<br />
1998 Americans made 5.4 billion passenger trips on buses. The total<br />
transit passenger volume remained essentially constant between<br />
1960 and 1992, whereas operating costs nearly doubled during the<br />
same period. <strong>Transit</strong> ridership has been increasing since the mid-<br />
1990s, and this trend is expected to continue over the next 25 years<br />
(1). Currently, the U.S. public transportation fleet consists of<br />
129,000 vehicles in active service, of which 58% are buses, 26% are<br />
demand-responsive vehicles, and the remaining 16% are light and<br />
heavy rail vehicles and other modes.<br />
In the past, to measure transit performance, it was very difficult<br />
and costly to collect the necessary data. From the service planning<br />
R. L. Bertini, Department of Civil and Environmental Engineering, and A. El-Geneidy,<br />
School of Urban Studies and Planning, Portland State University, P.O. Box 751,<br />
Portland, OR 97207-0751.<br />
perspective, a large number of people were initially needed to<br />
obtain a small amount of data. Today, a small number of people<br />
can obtain large amounts of data. There is a concern relating to<br />
how we can meaningfully analyze these data, creating information<br />
relevant for service planning and control (H. L. Levinson, personal<br />
communication, 2002).<br />
Since 1990, the development and use of transit performance measures<br />
has gained increasing attention in the form of several key<br />
<strong>Transit</strong> and Quality of Service Manual (TCQSM) and the NCHRP<br />
<strong>Performance</strong>-Based Planning Manual (2, 3). The TCQSM provides<br />
transportation agencies <strong>with</strong> tools for measuring transit availability<br />
and quality of service from the passengers’ point of view. The<br />
TCQSM contains a library of performance measures that will be<br />
used as a guide in this paper. The TCQSM provides the following<br />
definitions:<br />
• <strong>Transit</strong> performance measure. A quantitative or qualitative<br />
factor used to evaluate a particular aspect of transit service.<br />
• Quality of service. The overall measured or perceived performance<br />
of transit service from the passengers’ point of view.<br />
• <strong>Transit</strong> service measure. A quantitative performance measure<br />
that best describes a particular aspect of transit service and represents<br />
the passenger’s point of view. It is also known elsewhere as a<br />
measure of effectiveness.<br />
The TCQSM emphasizes that the quality of transit service from<br />
the passengers’ perspective depends on the availability and convenience<br />
of such service, which in turn depend on operating decisions<br />
made by transit agencies. As shown in Figure 1, Fielding (4) illustrated<br />
this by using a triangle <strong>with</strong> service input as the top and service<br />
output and service consumption as the base. In the mid-1980s,<br />
Fielding proposed the use of performance indicators for measuring<br />
an agency’s progress toward meeting organizational objectives.<br />
Another point is relevant to the transit industry today. Fielding<br />
described the primary challenges to transit agencies as managerial<br />
ones. This still appears to be true more than 15 years later.<br />
In the transit industry, transit performance measures (TPMs) are<br />
required at both the external and internal levels. For example, external<br />
TPMs are prepared by transit agencies as a condition of<br />
receiving federal funds. <strong>Transit</strong> agencies are required to report their<br />
performance annually in a standardized, aggregated format, including<br />
specific performance variables that are fed into federal reporting<br />
systems. These types of TPMs have been discussed at length in the<br />
literature over the past two decades. The objective of this paper is to<br />
describe how an archived database of bus dispatch system (BDS)<br />
data can be used to generate performance measures that should be<br />
prepared by transit agencies, to measure their own performance and<br />
help them to increase their service standards and effectiveness to the<br />
population they serve (5). This is a pilot research effort, and it is
110 Paper No. 03- 4393 <strong>Transportation</strong> Research Record 1841<br />
Service Inputs<br />
Labor, Capital, Fuel<br />
Cost Efficiency<br />
Cost Effectiveness<br />
Service Outputs<br />
Vehicle Hours,<br />
Vehicle Miles,<br />
Capacity Miles<br />
Service Effectiveness<br />
Service Consumption<br />
Passengers,<br />
Passenger Miles,<br />
Operating Revenue<br />
FIGURE 1<br />
Framework for transit performance concepts.<br />
hoped that these performance measures can be fed into the transit<br />
operations environment for use in revising schedules and operations<br />
strategies.<br />
Provision of reliable service has been a basic transit service objective<br />
for more than a century (H. L. Levinson, personal communication,<br />
2002). This highlights the importance of beginning a process<br />
for developing, testing, using, and incorporating performance measures<br />
into transit agencies’ daily operations. Toward this end, this<br />
paper will concentrate on developing an experimental set of TPMs<br />
that can help transit operators understand and manage their systems<br />
more efficiently and effectively.<br />
DATA<br />
The Portland Tri-County Metropolitan <strong>Transportation</strong> District of<br />
Oregon (TriMet) is the local transit provider for the Portland, Oregon,<br />
metropolitan area. TriMet operates 62 million annual bus trips<br />
to serve an area of 592 mi 2 <strong>with</strong> a population of 1.2 million. TriMet<br />
operates approximately 700 vehicles on 98 routes <strong>with</strong> approximately<br />
9,000 bus stops. TriMet has implemented a unique BDS that<br />
collects stop-level data as a part of its overall service control and<br />
management system. The main components of this system include<br />
• Automatic vehicle location (AVL) using a satellite-based Global<br />
Positioning System;<br />
• Voice and data communications via cellular and radio;<br />
• Onboard computer and control head displaying schedule adherence<br />
to operators; detection and reporting of schedule and route<br />
deviations to dispatchers; and two-way, preprogrammed messaging<br />
between operator and dispatchers;<br />
• Automatic passenger counters on most vehicles; and<br />
• Dispatch center <strong>with</strong> computer-aided dispatch/AVL consoles (6).<br />
The BDS records detailed operating information in real time and<br />
thereby enables the use of a variety of control actions. TriMet also<br />
archives stop-level BDS data that are available for later analysis on<br />
a systemwide basis. Each time the bus arrives at a stop, a new row<br />
of data is added to the database describing the particular stop.<br />
TriMet has geocoded each stop location, and using a geographic<br />
information system, a hypothetical 30-m (98-ft) circle is inscribed<br />
around each stop.<br />
The BDS records the arrive time when the bus enters the stop circle<br />
and records the leave time when the bus departs the same circle.<br />
Table 1 shows a sample of the data obtained from TriMet BDS data<br />
for Route 72. When there is an unscheduled stop, an artificial 30-m<br />
stop circle is created. The type of stop is indicated in another field.<br />
If the door opens at the stop, this means that a dwell occurs, most<br />
likely to serve passengers boarding or alighting, or both. In these situations,<br />
the arrive time is overwritten by the actual time that the door<br />
opens, and the total dwell time (the time that the door remains open)<br />
is recorded in another field. Figure 2 shows the description of the stop<br />
circle and the distribution of different time intervals during a bus trip.<br />
All trips include a layover at the beginning and end of the trip, representing<br />
approximately 12% of the total service time. The nonlayover<br />
travel time (hatched area) will be separated from the layovers in<br />
this study.<br />
PERFORMANCE MEASURES<br />
The <strong>Performance</strong>-Based Planning Manual recommends measures<br />
related to accessibility, mobility, and economic development across<br />
all modes. The recommended accessibility measures related to transit<br />
include the following (3):<br />
• Average travel time;<br />
• Average trip length;<br />
• Percentage of population <strong>with</strong>in X miles of employment;<br />
• Percentage of population that can reach services by transit,<br />
bicycle, or walking;
Bertini and El-Geneidy Paper No. 03- 4393 111<br />
TABLE 1 Sample from TriMet Data for Route 72<br />
Date Train Route Leave_Time Stop_Time Arrive_Time Dwell Location_ID Door Lift Ons Offs<br />
1-Apr-02 7244 72 6:34:40 6:32:00 6:32:54 53 8185 2 0 9 0<br />
1-Apr-02 7244 72 6:35:12 6:32:25 6:34:48 12 4001 1 0 3 0<br />
1-Apr-02 7244 72 6:35:20 6:32:39 6:35:16 0 11008 0 0 0 0<br />
1-Apr-02 7244 72 6:36:04 6:33:30 6:35:58 0 7941 0 0 0 0<br />
1-Apr-02 7244 72 6:36:44 6:34:04 6:36:18 12 7920 1 0 1 0<br />
1-Apr-02 7244 72 6:37:10 6:34:47 6:37:06 0 7918 0 0 0 0<br />
1-Apr-02 7244 72 6:37:20 6:35:10 6:37:16 0 7968 0 0 0 0<br />
1-Apr-02 7244 72 6:37:34 6:35:33 6:37:28 0 8015 0 0 0 0<br />
1-Apr-02 7244 72 6:38:44 6:36:12 6:38:26 4 8017 1 0 1 0<br />
1-Apr-02 7244 72 6:38:48 6:36:12 6:38:46 0 8017 0 0 0 0<br />
1-Apr-02 7244 72 6:39:26 6:36:49 6:39:14 0 7983 0 0 0 0<br />
1-Apr-02 7244 72 6:39:42 6:37:02 6:39:16 10 7995 2 0 1 0<br />
1-Apr-02 7244 72 6:39:52 6:37:16 6:39:46 0 7951 0 0 0 0<br />
1-Apr-02 7244 72 6:40:04 6:37:38 6:40:02 0 7946 0 0 0 0<br />
1-Apr-02 7244 72 6:40:50 6:38:04 6:40:14 17 7976 1 0 1 0<br />
1-Apr-02 7244 72 6:40:56 6:38:12 6:40:56 0 7953 0 0 0 0<br />
1-Apr-02 7244 72 6:41:22 6:38:41 6:41:14 0 7993 0 0 0 0<br />
1-Apr-02 7244 72 6:41:52 6:39:00 6:41:24 15 7962 2 0 3 0<br />
1-Apr-02 7244 72 6:42:36 6:39:41 6:42:08 8 7982 2 0 2 0<br />
1-Apr-02 7244 72 6:43:16 6:40:26 6:42:58 6 7970 1 0 1 0<br />
1-Apr-02 7244 72 6:43:52 6:40:57 6:43:30 9 7960 2 0 1 1<br />
1-Apr-02 7244 72 6:44:06 6:41:26 6:44:02 0 8057 0 0 0 0<br />
1-Apr-02 7244 72 6:44:42 6:41:56 6:44:16 9 8059 1 0 1 0<br />
1-Apr-02 7244 72 6:44:54 6:42:23 6:44:52 0 8027 0 0 0 0<br />
Layover<br />
Travel Time<br />
Layover<br />
First stop<br />
Stop<br />
Stop<br />
Last stop<br />
Time<br />
(a)<br />
Door open<br />
Dwell<br />
time<br />
Door close<br />
Time line<br />
Arrive time<br />
30 m<br />
Leave time<br />
Bus stop<br />
Arrive time if dwell occurs<br />
(b)<br />
FIGURE 2<br />
TriMet BDS System: (a) time distribution and (b) stop circle description.
112 Paper No. 03- 4393 <strong>Transportation</strong> Research Record 1841<br />
• Percentage of transit-dependent population;<br />
• Percentage of transfers between modes to be under X min<br />
and n ft;<br />
• Transfer distance at passenger facility;<br />
• Percentage of workforce that can reach worksite by transit<br />
<strong>with</strong>in 1 h and <strong>with</strong> no more than two transfers;<br />
• Percentage of population <strong>with</strong>in access to transit service;<br />
• Percentage of urban and rural areas <strong>with</strong> direct access to<br />
passenger rail and bus service;<br />
• Access time to passenger facility;<br />
• Route miles of transit service;<br />
• Route spacing;<br />
• Percentage of total transit trip time spent out of vehicle;<br />
• Existence of information services and ticketing; and<br />
• Availability of park and ride.<br />
Mobility measures related to transit include the following (2):<br />
• Percentage of on-time performance,<br />
• Percentage of scheduled departures that do not leave <strong>with</strong>in a<br />
specified time limit,<br />
• Travel time contour,<br />
• Minute variation in trip time,<br />
• Fluctuations in traffic volumes,<br />
• Average transfer time and delay,<br />
• Dwell time at intermodal facilities,<br />
• Proportion of persons delayed,<br />
• In-vehicle travel time,<br />
• Frequency of service,<br />
• Average wait time to board transit, and<br />
• Number of public transportation trips.<br />
The one economic development measure related to transit includes<br />
the percentage of a region’s unemployed or low-income citizens<br />
that cite transportation access as a principal barrier to seeking<br />
employment (3).<br />
There are ideal transit performance measures for enhancing bus<br />
supervision strategies, to improve service reliability (7). In the<br />
past, it was more difficult to collect the necessary data. Now, how-<br />
ever, it is relatively easy to use the BDS data already being collected<br />
to produce TPMs using the archived data. This paper<br />
demonstrates some of the TPMs that can be extracted from the<br />
BDS data at four different levels: system level, route level, segment<br />
level, and point level. These levels will be discussed in the<br />
following sections.<br />
SYSTEM-LEVEL PERFORMANCE MEASURES<br />
A system-level TPM can include all data reported in external<br />
reports pertaining to ridership, boardings, revenue, and expenditures<br />
for the overall system. In addition, route-level measures can<br />
be aggregated over the entire transit network. Therefore, we will<br />
not focus on system-level TPMs here.<br />
ROUTE-LEVEL PERFORMANCE MEASURES<br />
Figure 3 shows the time distribution between trip time and layover<br />
time for Route 12 during 1 selected weekday of service (January<br />
24, 2002). Using archived BDS data, it is possible to create a daily<br />
report for each route. The control of layover time is crucial, for the<br />
operator and vehicle are not producing any revenue to the transit<br />
agency. As shown in the figure, for 1 day on Route 12, the layover<br />
time made up 9% of the total service time.<br />
As shown in Table 2 for Route 14, some of the following information<br />
can be extracted readily (2, 7):<br />
• Scheduled hours of service,<br />
• Actual hours of service,<br />
• Number of scheduled trips,<br />
• Number of actual trips,<br />
• Number of scheduled miles,<br />
• Number of actual miles operated,<br />
• Number of passengers carried,<br />
• Total boardings and alightings,<br />
• Average passenger load during each trip,<br />
• Number of passengers per mile,<br />
Stop Circle <strong>with</strong><br />
Dwells, 17%<br />
Nonstop Circle w<br />
Dwells, 21%<br />
Dwell, 9%<br />
p Circle, 4%<br />
er, 9%<br />
Stop Circle <strong>with</strong> N<br />
Dwells, 9%<br />
Dwe<br />
Nonstop Circle <strong>with</strong> No<br />
Dwells, 35%<br />
FIGURE 3<br />
Time distribution for Route 12 during 1 weekday.
Bertini and El-Geneidy Paper No. 03- 4393 113<br />
TABLE 2 Daily Report for Route 14<br />
Inbound Outbound Total<br />
Hours Minutes Seconds Hours Minutes Seconds Hours Minutes Seconds<br />
Hours of service 77 37 48 71 15 40 148 53 28<br />
Scheduled hours of service 72 18 0 71 55 0 144 13 0<br />
Number of scheduled trips 105 107 212<br />
Number of actual trips 103 104 207<br />
Number of scheduled miles 814.8 862.4 1,677.2<br />
Number of actual miles operated 843.6 806.8 1,650.3<br />
Number of passengers carried 3,772 4,165 7,937<br />
Total boardings and alightings 7,544 8,331 15,875<br />
Average passenger load during the trip 73.2 80.1 116.7<br />
Number of passengers per mile 8.9 10.3 14.8<br />
Average scheduled speed mile/hour 11.3 12.0 11.7<br />
Average speed mile/hour 10.9 11.3 11.1<br />
Number of operators 46 24 70<br />
• Average scheduled speed (mi/h),<br />
• Average speed (mi/h), and<br />
• Number of operators.<br />
These data can also be compared for peak periods only, and from<br />
day to day, and, if archived systematically, they can be compared<br />
longitudinally over many years. As shown in Table 2, on Route 14<br />
there were 103 inbound trips per day, and the average delay was<br />
3 min per trip which resulted in total delay of approximately 5 h and<br />
19 min. At the system level, TriMet operates approximately 98<br />
routes in the Portland metropolitan area. A total of daily 531 h of<br />
lost time can be extrapolated from the data from the single route.<br />
Table 3 shows a sample of a peak period analysis for Route 12,<br />
indicating the following variables:<br />
• Actual trip time,<br />
• Scheduled trip time,<br />
• Actual layover time,<br />
• Total dwell time,<br />
• Total passenger boardings,<br />
• Total passenger alightings, and<br />
• Total number of trips.<br />
Dwell time is another measure that can be analyzed at the system,<br />
route, or point level. Table 4 shows an example of route-level analysis<br />
of dwell time for Route 12 over 3 consecutive days, using the<br />
following measures:<br />
• Total number of stops,<br />
• Total dwell time and layovers,<br />
• Total dwell time <strong>with</strong>out layovers,<br />
• Total layover time,<br />
• Total number of dwells and layovers,<br />
• Total number of dwells <strong>with</strong>out layovers,<br />
• Average dwell time,<br />
• Total number of passengers served,<br />
• Total number of passenger boardings,<br />
• Total number of passenger alightings,<br />
• Total number of lift use,<br />
• Total dwell time <strong>with</strong> lift used,<br />
• Total number of dwells <strong>with</strong> passenger movement,<br />
TABLE 3 Peak Period Analysis for Route 12<br />
Inbound trips a.m. peak<br />
Outbound trips p.m.<br />
peak<br />
<strong>Measures</strong> Hours Minutes Seconds<br />
Actual trip time 14 47 46<br />
Scheduled trip time 14 59 0<br />
Actual layover 3 10 12<br />
Total dwell time 1 55 24<br />
Total passenger boardings 747<br />
Total passenger alightings 471<br />
Total number of trips 18<br />
Actual trip time 17 28 10<br />
Scheduled trip time 16 15 0<br />
Actual layover 0 24 14<br />
Total dwell time 4 2 28<br />
Total passenger boardings 712<br />
Total passenger alightings 973<br />
Total number of trips 16
114 Paper No. 03- 4393 <strong>Transportation</strong> Research Record 1841<br />
TABLE 4 Dwell Time Analysis for Route 12<br />
January 23,<br />
2002<br />
January 24,<br />
2002<br />
January 25,<br />
2002 Average<br />
Total number of stops 10,756 11,268 11,254 11,093<br />
Total dwell time and layovers in seconds 115,664 112,384 118,229 115,426<br />
Total dwell time <strong>with</strong>out layovers in seconds 54,393 52,964 57,565 54,974<br />
Total layover time 61,271 59,420 60,664 60,452<br />
Total number of dwells and layovers 4,058 4,171 4,128 4,119<br />
Total number of dwells <strong>with</strong>out layovers 3,850 3,958 3,911 3,906<br />
Average dwell time in seconds 14.1 13.4 14.7 14.1<br />
Total number of passengers served 10,101 10,235 9,513 9,950<br />
Total number of passenger boardings 5,186 5,268 4,960 5,138<br />
Total number of passenger alightings 4,915 4,967 4,553 4,812<br />
Total number of lift use 12.0 8.0 14.0 11.3<br />
Total dwell time <strong>with</strong> lift used in seconds 1,217 609 1,214 1,013<br />
Total number of dwells <strong>with</strong> passenger movement 3,327 3,368 3,065 3,253<br />
Total dwell time <strong>with</strong> passenger movement in seconds 49,351 47,936 46,675 47,987<br />
Average dwell time <strong>with</strong> passenger movement in seconds 14.8 14.2 15.2 14.8<br />
Total number of dwells <strong>with</strong>out passenger movement 523 590 846 653<br />
Total dwell time <strong>with</strong>out passenger movement in seconds 5,042 5,028 10,890 6,987<br />
Average dwell time <strong>with</strong>out passenger movement in seconds 9.6 8.5 12.9 10.7<br />
• Total dwell time <strong>with</strong> passenger movement,<br />
• Average dwell time <strong>with</strong> passenger movement,<br />
• Total number of dwells <strong>with</strong>out passenger movement,<br />
• Total dwell time <strong>with</strong>out passenger movement, and<br />
• Average dwell time <strong>with</strong>out passenger movement.<br />
The TCQSM discusses transit availability as a primary means of<br />
measuring quality of service. As one example of assessing transit<br />
availability in a highly populated area, Figure 4 consists of a sample<br />
census tract (area of 1.5 mi 2 , year 2000 population of 7,900) <strong>with</strong><br />
a 1,300-ft (0.25-mi) buffer around each bus stop, representing a<br />
walking distance in the studied neighborhood. A simple area calculation<br />
indicates that only 38% of the area of the tract is <strong>with</strong>in easy<br />
walking distance of the bus route. A systematic indication like this<br />
can be used to add more service to areas exhibiting population<br />
growth or demographic shifts. Characteristics such as household<br />
income (not yet available from the 2000 census) can also be used to<br />
determine accessibility across income strata, and they can be applied<br />
to the entire system when determining how to add appropriate service<br />
in poorly served areas.<br />
<strong>Transit</strong> operating speed and travel time influence service attractiveness,<br />
costs, and efficiency. They also provide important descriptions<br />
of system performance for use in the transportation planning<br />
process (7). Average speed and travel time are critical measures<br />
from both the passenger and agency perspectives. It is possible to<br />
examine average speed in several ways. Figure 5 shows trajectories<br />
for 14 inbound trips on Route 14 on 1 day. The trajectories are plotted<br />
in a time-space plane where the x-axis is time and the y-axis is<br />
distance, so the slope of the trajectory at any point is the vehicle<br />
speed. It is possible to see how the speed of each vehicle varies <strong>with</strong><br />
time and distance. Average speed can be examined across the entire<br />
day as well as by comparing the average peak hour transit speed<br />
<strong>with</strong> off-peak speed (2, 7, 8). Figure 6 shows the average speed for<br />
1 day for both inbound and outbound Route 14.<br />
As shown in Figure 6, the average speed on 1 day was 27.8 km/h<br />
(17.3 mph) for Route 14 inbound trips and 25.6 km/h (15.9 mph) for<br />
outbound trips. TriMet divides the service day into five periods: early<br />
morning (before 6:00 a.m.), morning peak (6:00 to 9:00 a.m.), midday<br />
(9:00 a.m. to 3:00 p.m.), evening peak (3:00 to 6:00 p.m.), and<br />
night (after 6:00 p.m.). Average speeds are shown for each of these<br />
periods. A similar plot can be developed at a higher aggregated level<br />
to include the entire transit system serving the entire metropolitan area<br />
or at lower levels for each individual route or key route segments.<br />
Another valuable measure of transit reliability is schedule adherence.<br />
This measure translates to customer perception and is also useful<br />
for assessing operator performance and for identifying necessary<br />
schedule modifications. The use of the archived BDS data makes it<br />
possible to observe the relationship between scheduled and actual<br />
departure time at each stop. Figure 7 shows a sample of this analysis<br />
for 1 day on Route 14. An analysis of the data shown in Figure 7<br />
reveals that the bus arrived on time 22.2% of the time, arrived late<br />
50.6% of the time, and arrived early 27.2 % of the time.<br />
Excess dwell time, surges in passenger movements, lift use, and<br />
traffic delays are the main reasons a bus would arrive late at the next<br />
stop. Figure 8 shows a graph of passenger movements and dwell<br />
time for 1 day on outbound Route 14, including passenger movements<br />
and dwell times according to location. In addition, the second<br />
part of the figure shows the total passenger movement at each
Bertini and El-Geneidy Paper No. 03- 4393 115<br />
FIGURE 4<br />
High population census tract <strong>with</strong> Route 67 service.<br />
1410<br />
1402<br />
1403<br />
1411<br />
1404<br />
1407<br />
1408<br />
1405<br />
1406<br />
1403<br />
1404<br />
1407<br />
1408<br />
1405<br />
12<br />
10<br />
Distance (km)<br />
8<br />
6<br />
4<br />
2<br />
0<br />
5:16:48 5:52:48 6:28:48 7:04:48 7:40:48 8:16:48 8:52:48 9:28:48 10:04:48<br />
Time<br />
FIGURE 5<br />
Cumulative distance versus time for 14 trips.
116 Paper No. 03- 4393 <strong>Transportation</strong> Research Record 1841<br />
40<br />
35<br />
30<br />
Average speed (km/h)<br />
25<br />
20<br />
15<br />
Inbound<br />
30.5 km/h<br />
Outbound<br />
31.2 km/h<br />
Inbound<br />
26.3 km/h<br />
Outbound<br />
29.2 km/h<br />
Inbound<br />
25.5 km/h<br />
Outbound<br />
25.9 km/h<br />
Inbound<br />
23.9 km/h<br />
Outbound<br />
22.6 km/h<br />
Inbound<br />
31.0 km/h<br />
Outbound<br />
27.8 m/h<br />
10<br />
5<br />
Inbound<br />
Outbound<br />
0<br />
3 4 5 6 7 8 9 10 11 12 13 14 15 16 17 18 19 20 21 22 23 24<br />
Time<br />
FIGURE 6 Average speed during 1 day of service on Route 14.<br />
1,800<br />
1,600<br />
1,400<br />
Inbound<br />
Outbound<br />
Number of Observations<br />
1,200<br />
1,000<br />
800<br />
600<br />
400<br />
200<br />
0<br />
-7 -6 -5 -4 -3 -2 -1 0 1 2 3 4 5 6 7 8 9 10 11 12 13 14 15<br />
Minutes<br />
FIGURE 7 Schedule adherence during 1 day of service on Route 14.
Bertini and El-Geneidy Paper No. 03- 4393 117<br />
400<br />
6,000<br />
On Off Dwell<br />
350<br />
5,000<br />
300<br />
Number of Passengers<br />
250<br />
200<br />
150<br />
4,000<br />
3,000<br />
2,000<br />
Total Dwell Time<br />
100<br />
50<br />
1,000<br />
0<br />
0<br />
Downtown<br />
FIGURE 8 Total dwell time and passenger movement during 1 day of outbound trips on Route 14.<br />
stop (7). Note that the layovers at the ends of the route were excluded<br />
from the graphs.<br />
SEGMENT-LEVEL PERFORMANCE MEASURES<br />
Many route-level TPMs can also be applied to key segments of<br />
important routes that may require analytical focus. As one example,<br />
a portion of Route 12 has been analyzed to investigate the population<br />
that is being served in a particular area. Figure 9 shows a route segment<br />
map accompanied by a histogram for the land use around this<br />
particular route segment, along <strong>with</strong> the characterization of passenger<br />
movement at each stop. From this analysis, it is shown that the<br />
highest passenger movement occurred around transfer points <strong>with</strong><br />
the highest proportion of commercial land around them. These transfer<br />
points are locations that deserve additional attention, particularly<br />
if timed transfer policies are desired.<br />
POINT-LEVEL PERFORMANCE MEASURES<br />
From the customer’s standpoint, it is often the point-level performance<br />
that is first perceived. If one takes a system perspective, it is<br />
also clear that small delays at individual stops are difficult to make<br />
up, particularly in congested traffic conditions. For any particular<br />
point on a bus route, it would be possible to report the following (7):<br />
• Number of scheduled trips passing this point,<br />
• Number of actual trips,<br />
• Percentage of actual and scheduled trips,<br />
• Number of passengers carried,<br />
• For a maximum 30-min interval of loading time,<br />
• Time interval,<br />
• Average deviation,<br />
• Standard deviation,<br />
• Number of vehicles passing,<br />
• Number of passengers moving, and<br />
• Number of passengers per vehicle.<br />
To examine on-time performance at a significant stop, one can see<br />
that Figure 10 shows a scheduled cumulative bus arrival function for<br />
the stop at Hawthorne and 39th (which is also a time point). The<br />
x-axis is time, and the y-axis records the vehicle number and its<br />
scheduled arrival time. Also shown is a cumulative arrival function<br />
for actual vehicle arrivals. The value of presenting the data in this<br />
fashion is that it is possible to see the vehicular delay as the difference<br />
between the two step-functions. Another benefit is that it is<br />
possible to see the scheduled and actual headways from the perspective<br />
of passengers at the particular stop. Also shown in the figure<br />
are the total passenger movements associated <strong>with</strong> each vehicle.<br />
From this figure, the effects of bus bunching are extremely clear—<br />
that when there are two buses <strong>with</strong> very short headways, the second<br />
bus serves almost no passengers.<br />
From this type of analysis, it would be possible to determine the<br />
percentage of buses that arrived on time during an entire service day,<br />
as well as to compare overall on-time performance <strong>with</strong> that during<br />
the peak periods. Doing so could lead to better decision-making and<br />
prioritization capabilities for stop-level improvements such as stop<br />
consolidations, relocations, boarding area improvements, queue jump<br />
lanes, and traffic signal priority.
118 Paper No. 03- 4393 <strong>Transportation</strong> Research Record 1841<br />
One-Quarter Mile Buffer<br />
One-Half Mile Buffer<br />
FIGURE 9<br />
Segment from Route 12 <strong>with</strong> land use around stops.<br />
CONCLUSIONS<br />
Actually measuring the performance of a transit system is the first<br />
step toward efficient and proactive management. In recent years, the<br />
use of performance measures for transportation planning and operations<br />
has gained a great deal of attention, particularly as transportation<br />
agencies are required to provide service <strong>with</strong> diminishing<br />
resources. In the past, it was very difficult and costly to collect comprehensive<br />
performance data. Thus, until recently, the transit industry<br />
has relied on few, general, and aggregate measures for reporting<br />
performance to external funding and regulatory agencies. It was difficult<br />
to actually tie these measures to service standards and nearly<br />
impossible to track the benefits of individual service improvements.<br />
On the basis of a review of the recent literature, a sampling of<br />
transit performance measures has been developed. This experiment<br />
has shown that by using real archived data from a BDS, it is possible<br />
to obtain information assessing the functionality of the transit<br />
system. The tools shown here will help to determine the best<br />
performance measures for use by various entities <strong>with</strong>in the transit<br />
organization. With simple, directly measurable variables, it is<br />
possible to compare performance from day to day and from route<br />
to route.
Bertini and El-Geneidy Paper No. 03- 4393 119<br />
Actual Scheduled Passengers<br />
12<br />
Number of Buses Passing Through the Stop<br />
20<br />
15<br />
10<br />
5<br />
10<br />
8<br />
6<br />
4<br />
2<br />
Number of Passengers<br />
0<br />
0<br />
15:36:00 15:50:24 16:04:48 16:19:12 16:33:36 16:48:00 17:02:24 17:16:48<br />
Time<br />
FIGURE 10<br />
On-time performance at stop at Hawthorne and 39th Avenue.<br />
Most significantly, TriMet had the foresight to develop a system<br />
to archive all of its stop-level data, which are then available for conversion<br />
to performance indicators. This paper demonstrates the<br />
powerful ways that the data collected by the BDS can be converted<br />
into potentially valuable TPMs. These TPMs have been proposed in<br />
the past but were not implemented owing to data limitations. It is<br />
envisioned that systematic use of TPMs can assist a transit agency<br />
in improving the quality and reliability of its service, leading to<br />
improvements for customers and operators alike.<br />
The value of such an ongoing generator of performance data is that<br />
it eliminates the need to make assumptions and estimates about<br />
time-varying behavior that find their way into aggregate performance<br />
metrics. The TriMet BDS data are being archived every day, so longterm<br />
averages can be calculated rather than estimated. The next step<br />
in this research will be to introduce these and other performance measures<br />
to TriMet and other transit properties and to test their usefulness<br />
to planners, schedulers, and dispatchers. It is conceivable that<br />
some of these measures could be generated automatically each day<br />
for later analysis and research. By getting performance information<br />
into the hands of the transit agency employees, and providing them<br />
<strong>with</strong> tools to help them perform their jobs more effectively, it is<br />
likely that an agency will be able to see measurable improvements<br />
in a relatively short time.<br />
ACKNOWLEDGMENTS<br />
The authors thank Steve Callas of TriMet for providing the data used.<br />
Thomas Kimpel and James Strathman of the Center for Urban Studies<br />
at Portland State University also assisted <strong>with</strong> data acquisition and<br />
provided valuable comments along the way. Sutti Tantiyanugulchai<br />
and Shazia Malik assisted <strong>with</strong> data processing and analysis. Portions<br />
of this work were funded by Portland State University Center for<br />
Urban Studies and the Department of Civil and Environmental Engineering.<br />
Finally, the authors thank Herbert Levinson and the anonymous<br />
reviewers whose valuable comments improved this paper<br />
considerably.<br />
REFERENCES<br />
1. Changing Faces of <strong>Transportation</strong>. BTS00-007. Bureau of <strong>Transportation</strong><br />
Statistics, U.S. Department of <strong>Transportation</strong>, 2000.<br />
2. Web Document No. 6: <strong>Transit</strong> Capacity and Quality of Service Manual.<br />
TCRP, TRB, National Research Council, Washington, D.C., 1999.<br />
3. NCHRP Research Results Digest 226: Multimodal <strong>Transportation</strong> Development<br />
of a <strong>Performance</strong>-Based Planning Process. TRB, National<br />
Research Council, Washington, D.C., 1999.<br />
4. Fielding, G. J. Managing Public <strong>Transit</strong> Strategically: A Comprehensive<br />
Approach to Strengthening Service and Monitoring <strong>Performance</strong>. Jossey-<br />
Bass, San Francisco, Calif., 1987.<br />
5. Fielding, G. J. <strong>Transit</strong> <strong>Performance</strong> Evaluation in the U.S.A. <strong>Transportation</strong><br />
Research, Vol. 26A, No. 6, 1992, pp. 483–491.<br />
6. Strathman, J. G., T. J. Kimpel, K. J. Dueker, R. L. Gerhart, K. Turner,<br />
D. Griffin, and S. Callas. Bus <strong>Transit</strong> Operation Control: Review and an<br />
Experiment Involving TriMet’s Automated Bus Dispatching System.<br />
Journal of Public <strong>Transportation</strong>, Vol. 4, No. 1, 2001, pp. 1–26.<br />
7. Levinson, H. W. Synthesis of <strong>Transit</strong> Practice 15: Supervision Strategies<br />
for Improved Reliability of Bus Routes. TRB, National Research Council,<br />
Washington, D.C., 1991.<br />
8. Klein, D. B., A. T. Moore, and R. Binyamen. Curb Rights, A Foundation<br />
for Free Enterprise in Urban <strong>Transit</strong>. Brooking Institution Press,<br />
Washington, D.C., 1997.<br />
Publication of this paper sponsored by Task force on <strong>Transit</strong> Capacity and Quality<br />
of Service.