Generating Transit Performance Measures with ... - Transportation
Generating Transit Performance Measures with ... - Transportation
Generating Transit Performance Measures with ... - Transportation

Create successful ePaper yourself
Turn your PDF publications into a flip-book with our unique Google optimized e-Paper software.
114 Paper No. 03- 4393 <strong>Transportation</strong> Research Record 1841<br />
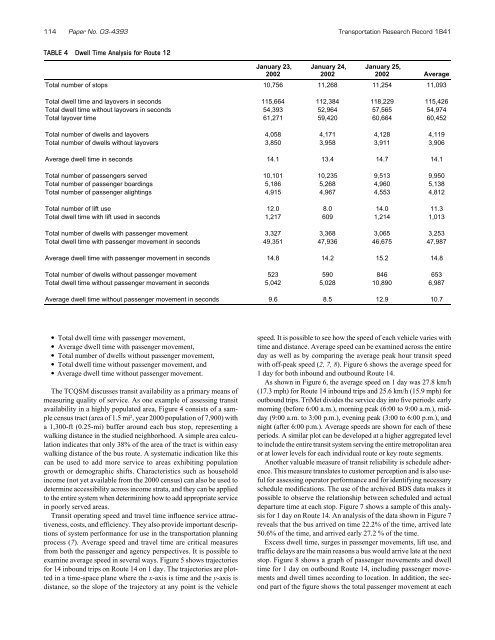
TABLE 4 Dwell Time Analysis for Route 12<br />
January 23,<br />
2002<br />
January 24,<br />
2002<br />
January 25,<br />
2002 Average<br />
Total number of stops 10,756 11,268 11,254 11,093<br />
Total dwell time and layovers in seconds 115,664 112,384 118,229 115,426<br />
Total dwell time <strong>with</strong>out layovers in seconds 54,393 52,964 57,565 54,974<br />
Total layover time 61,271 59,420 60,664 60,452<br />
Total number of dwells and layovers 4,058 4,171 4,128 4,119<br />
Total number of dwells <strong>with</strong>out layovers 3,850 3,958 3,911 3,906<br />
Average dwell time in seconds 14.1 13.4 14.7 14.1<br />
Total number of passengers served 10,101 10,235 9,513 9,950<br />
Total number of passenger boardings 5,186 5,268 4,960 5,138<br />
Total number of passenger alightings 4,915 4,967 4,553 4,812<br />
Total number of lift use 12.0 8.0 14.0 11.3<br />
Total dwell time <strong>with</strong> lift used in seconds 1,217 609 1,214 1,013<br />
Total number of dwells <strong>with</strong> passenger movement 3,327 3,368 3,065 3,253<br />
Total dwell time <strong>with</strong> passenger movement in seconds 49,351 47,936 46,675 47,987<br />
Average dwell time <strong>with</strong> passenger movement in seconds 14.8 14.2 15.2 14.8<br />
Total number of dwells <strong>with</strong>out passenger movement 523 590 846 653<br />
Total dwell time <strong>with</strong>out passenger movement in seconds 5,042 5,028 10,890 6,987<br />
Average dwell time <strong>with</strong>out passenger movement in seconds 9.6 8.5 12.9 10.7<br />
• Total dwell time <strong>with</strong> passenger movement,<br />
• Average dwell time <strong>with</strong> passenger movement,<br />
• Total number of dwells <strong>with</strong>out passenger movement,<br />
• Total dwell time <strong>with</strong>out passenger movement, and<br />
• Average dwell time <strong>with</strong>out passenger movement.<br />
The TCQSM discusses transit availability as a primary means of<br />
measuring quality of service. As one example of assessing transit<br />
availability in a highly populated area, Figure 4 consists of a sample<br />
census tract (area of 1.5 mi 2 , year 2000 population of 7,900) <strong>with</strong><br />
a 1,300-ft (0.25-mi) buffer around each bus stop, representing a<br />
walking distance in the studied neighborhood. A simple area calculation<br />
indicates that only 38% of the area of the tract is <strong>with</strong>in easy<br />
walking distance of the bus route. A systematic indication like this<br />
can be used to add more service to areas exhibiting population<br />
growth or demographic shifts. Characteristics such as household<br />
income (not yet available from the 2000 census) can also be used to<br />
determine accessibility across income strata, and they can be applied<br />
to the entire system when determining how to add appropriate service<br />
in poorly served areas.<br />
<strong>Transit</strong> operating speed and travel time influence service attractiveness,<br />
costs, and efficiency. They also provide important descriptions<br />
of system performance for use in the transportation planning<br />
process (7). Average speed and travel time are critical measures<br />
from both the passenger and agency perspectives. It is possible to<br />
examine average speed in several ways. Figure 5 shows trajectories<br />
for 14 inbound trips on Route 14 on 1 day. The trajectories are plotted<br />
in a time-space plane where the x-axis is time and the y-axis is<br />
distance, so the slope of the trajectory at any point is the vehicle<br />
speed. It is possible to see how the speed of each vehicle varies <strong>with</strong><br />
time and distance. Average speed can be examined across the entire<br />
day as well as by comparing the average peak hour transit speed<br />
<strong>with</strong> off-peak speed (2, 7, 8). Figure 6 shows the average speed for<br />
1 day for both inbound and outbound Route 14.<br />
As shown in Figure 6, the average speed on 1 day was 27.8 km/h<br />
(17.3 mph) for Route 14 inbound trips and 25.6 km/h (15.9 mph) for<br />
outbound trips. TriMet divides the service day into five periods: early<br />
morning (before 6:00 a.m.), morning peak (6:00 to 9:00 a.m.), midday<br />
(9:00 a.m. to 3:00 p.m.), evening peak (3:00 to 6:00 p.m.), and<br />
night (after 6:00 p.m.). Average speeds are shown for each of these<br />
periods. A similar plot can be developed at a higher aggregated level<br />
to include the entire transit system serving the entire metropolitan area<br />
or at lower levels for each individual route or key route segments.<br />
Another valuable measure of transit reliability is schedule adherence.<br />
This measure translates to customer perception and is also useful<br />
for assessing operator performance and for identifying necessary<br />
schedule modifications. The use of the archived BDS data makes it<br />
possible to observe the relationship between scheduled and actual<br />
departure time at each stop. Figure 7 shows a sample of this analysis<br />
for 1 day on Route 14. An analysis of the data shown in Figure 7<br />
reveals that the bus arrived on time 22.2% of the time, arrived late<br />
50.6% of the time, and arrived early 27.2 % of the time.<br />
Excess dwell time, surges in passenger movements, lift use, and<br />
traffic delays are the main reasons a bus would arrive late at the next<br />
stop. Figure 8 shows a graph of passenger movements and dwell<br />
time for 1 day on outbound Route 14, including passenger movements<br />
and dwell times according to location. In addition, the second<br />
part of the figure shows the total passenger movement at each