Generating Transit Performance Measures with ... - Transportation
Generating Transit Performance Measures with ... - Transportation
Generating Transit Performance Measures with ... - Transportation

Create successful ePaper yourself
Turn your PDF publications into a flip-book with our unique Google optimized e-Paper software.
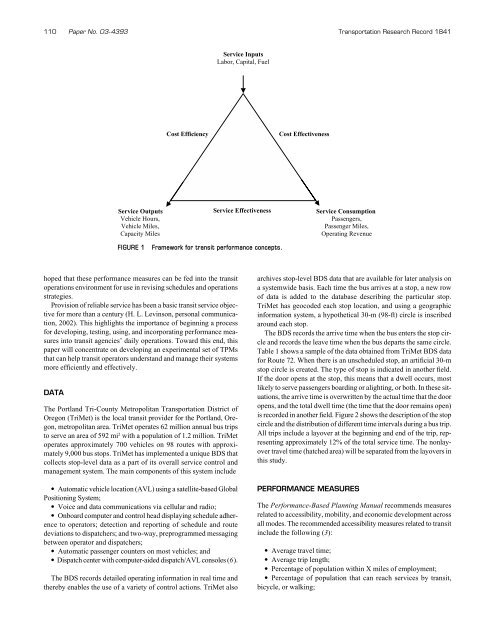
110 Paper No. 03- 4393 <strong>Transportation</strong> Research Record 1841<br />
Service Inputs<br />
Labor, Capital, Fuel<br />
Cost Efficiency<br />
Cost Effectiveness<br />
Service Outputs<br />
Vehicle Hours,<br />
Vehicle Miles,<br />
Capacity Miles<br />
Service Effectiveness<br />
Service Consumption<br />
Passengers,<br />
Passenger Miles,<br />
Operating Revenue<br />
FIGURE 1<br />
Framework for transit performance concepts.<br />
hoped that these performance measures can be fed into the transit<br />
operations environment for use in revising schedules and operations<br />
strategies.<br />
Provision of reliable service has been a basic transit service objective<br />
for more than a century (H. L. Levinson, personal communication,<br />
2002). This highlights the importance of beginning a process<br />
for developing, testing, using, and incorporating performance measures<br />
into transit agencies’ daily operations. Toward this end, this<br />
paper will concentrate on developing an experimental set of TPMs<br />
that can help transit operators understand and manage their systems<br />
more efficiently and effectively.<br />
DATA<br />
The Portland Tri-County Metropolitan <strong>Transportation</strong> District of<br />
Oregon (TriMet) is the local transit provider for the Portland, Oregon,<br />
metropolitan area. TriMet operates 62 million annual bus trips<br />
to serve an area of 592 mi 2 <strong>with</strong> a population of 1.2 million. TriMet<br />
operates approximately 700 vehicles on 98 routes <strong>with</strong> approximately<br />
9,000 bus stops. TriMet has implemented a unique BDS that<br />
collects stop-level data as a part of its overall service control and<br />
management system. The main components of this system include<br />
• Automatic vehicle location (AVL) using a satellite-based Global<br />
Positioning System;<br />
• Voice and data communications via cellular and radio;<br />
• Onboard computer and control head displaying schedule adherence<br />
to operators; detection and reporting of schedule and route<br />
deviations to dispatchers; and two-way, preprogrammed messaging<br />
between operator and dispatchers;<br />
• Automatic passenger counters on most vehicles; and<br />
• Dispatch center <strong>with</strong> computer-aided dispatch/AVL consoles (6).<br />
The BDS records detailed operating information in real time and<br />
thereby enables the use of a variety of control actions. TriMet also<br />
archives stop-level BDS data that are available for later analysis on<br />
a systemwide basis. Each time the bus arrives at a stop, a new row<br />
of data is added to the database describing the particular stop.<br />
TriMet has geocoded each stop location, and using a geographic<br />
information system, a hypothetical 30-m (98-ft) circle is inscribed<br />
around each stop.<br />
The BDS records the arrive time when the bus enters the stop circle<br />
and records the leave time when the bus departs the same circle.<br />
Table 1 shows a sample of the data obtained from TriMet BDS data<br />
for Route 72. When there is an unscheduled stop, an artificial 30-m<br />
stop circle is created. The type of stop is indicated in another field.<br />
If the door opens at the stop, this means that a dwell occurs, most<br />
likely to serve passengers boarding or alighting, or both. In these situations,<br />
the arrive time is overwritten by the actual time that the door<br />
opens, and the total dwell time (the time that the door remains open)<br />
is recorded in another field. Figure 2 shows the description of the stop<br />
circle and the distribution of different time intervals during a bus trip.<br />
All trips include a layover at the beginning and end of the trip, representing<br />
approximately 12% of the total service time. The nonlayover<br />
travel time (hatched area) will be separated from the layovers in<br />
this study.<br />
PERFORMANCE MEASURES<br />
The <strong>Performance</strong>-Based Planning Manual recommends measures<br />
related to accessibility, mobility, and economic development across<br />
all modes. The recommended accessibility measures related to transit<br />
include the following (3):<br />
• Average travel time;<br />
• Average trip length;<br />
• Percentage of population <strong>with</strong>in X miles of employment;<br />
• Percentage of population that can reach services by transit,<br />
bicycle, or walking;