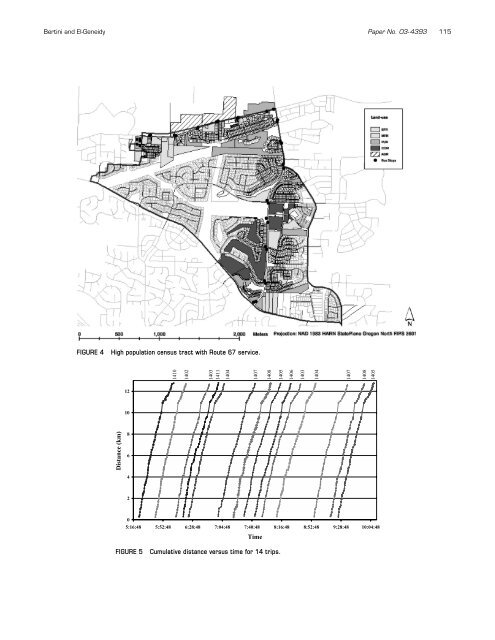
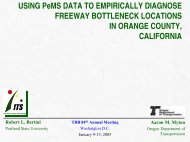
114 Paper No. 03- 4393 <strong>Transportation</strong> Research Record 1841 TABLE 4 Dwell Time Analysis for Route 12 January 23, 2002 January 24, 2002 January 25, 2002 Average Total number of stops 10,756 11,268 11,254 11,093 Total dwell time and layovers in seconds 115,664 112,384 118,229 115,426 Total dwell time <strong>with</strong>out layovers in seconds 54,393 52,964 57,565 54,974 Total layover time 61,271 59,420 60,664 60,452 Total number of dwells and layovers 4,058 4,171 4,128 4,119 Total number of dwells <strong>with</strong>out layovers 3,850 3,958 3,911 3,906 Average dwell time in seconds 14.1 13.4 14.7 14.1 Total number of passengers served 10,101 10,235 9,513 9,950 Total number of passenger boardings 5,186 5,268 4,960 5,138 Total number of passenger alightings 4,915 4,967 4,553 4,812 Total number of lift use 12.0 8.0 14.0 11.3 Total dwell time <strong>with</strong> lift used in seconds 1,217 609 1,214 1,013 Total number of dwells <strong>with</strong> passenger movement 3,327 3,368 3,065 3,253 Total dwell time <strong>with</strong> passenger movement in seconds 49,351 47,936 46,675 47,987 Average dwell time <strong>with</strong> passenger movement in seconds 14.8 14.2 15.2 14.8 Total number of dwells <strong>with</strong>out passenger movement 523 590 846 653 Total dwell time <strong>with</strong>out passenger movement in seconds 5,042 5,028 10,890 6,987 Average dwell time <strong>with</strong>out passenger movement in seconds 9.6 8.5 12.9 10.7 • Total dwell time <strong>with</strong> passenger movement, • Average dwell time <strong>with</strong> passenger movement, • Total number of dwells <strong>with</strong>out passenger movement, • Total dwell time <strong>with</strong>out passenger movement, and • Average dwell time <strong>with</strong>out passenger movement. The TCQSM discusses transit availability as a primary means of measuring quality of service. As one example of assessing transit availability in a highly populated area, Figure 4 consists of a sample census tract (area of 1.5 mi 2 , year 2000 population of 7,900) <strong>with</strong> a 1,300-ft (0.25-mi) buffer around each bus stop, representing a walking distance in the studied neighborhood. A simple area calculation indicates that only 38% of the area of the tract is <strong>with</strong>in easy walking distance of the bus route. A systematic indication like this can be used to add more service to areas exhibiting population growth or demographic shifts. Characteristics such as household income (not yet available from the 2000 census) can also be used to determine accessibility across income strata, and they can be applied to the entire system when determining how to add appropriate service in poorly served areas. <strong>Transit</strong> operating speed and travel time influence service attractiveness, costs, and efficiency. They also provide important descriptions of system performance for use in the transportation planning process (7). Average speed and travel time are critical measures from both the passenger and agency perspectives. It is possible to examine average speed in several ways. Figure 5 shows trajectories for 14 inbound trips on Route 14 on 1 day. The trajectories are plotted in a time-space plane where the x-axis is time and the y-axis is distance, so the slope of the trajectory at any point is the vehicle speed. It is possible to see how the speed of each vehicle varies <strong>with</strong> time and distance. Average speed can be examined across the entire day as well as by comparing the average peak hour transit speed <strong>with</strong> off-peak speed (2, 7, 8). Figure 6 shows the average speed for 1 day for both inbound and outbound Route 14. As shown in Figure 6, the average speed on 1 day was 27.8 km/h (17.3 mph) for Route 14 inbound trips and 25.6 km/h (15.9 mph) for outbound trips. TriMet divides the service day into five periods: early morning (before 6:00 a.m.), morning peak (6:00 to 9:00 a.m.), midday (9:00 a.m. to 3:00 p.m.), evening peak (3:00 to 6:00 p.m.), and night (after 6:00 p.m.). Average speeds are shown for each of these periods. A similar plot can be developed at a higher aggregated level to include the entire transit system serving the entire metropolitan area or at lower levels for each individual route or key route segments. Another valuable measure of transit reliability is schedule adherence. This measure translates to customer perception and is also useful for assessing operator performance and for identifying necessary schedule modifications. The use of the archived BDS data makes it possible to observe the relationship between scheduled and actual departure time at each stop. Figure 7 shows a sample of this analysis for 1 day on Route 14. An analysis of the data shown in Figure 7 reveals that the bus arrived on time 22.2% of the time, arrived late 50.6% of the time, and arrived early 27.2 % of the time. Excess dwell time, surges in passenger movements, lift use, and traffic delays are the main reasons a bus would arrive late at the next stop. Figure 8 shows a graph of passenger movements and dwell time for 1 day on outbound Route 14, including passenger movements and dwell times according to location. In addition, the second part of the figure shows the total passenger movement at each
Bertini and El-Geneidy Paper No. 03- 4393 115 FIGURE 4 High population census tract <strong>with</strong> Route 67 service. 1410 1402 1403 1411 1404 1407 1408 1405 1406 1403 1404 1407 1408 1405 12 10 Distance (km) 8 6 4 2 0 5:16:48 5:52:48 6:28:48 7:04:48 7:40:48 8:16:48 8:52:48 9:28:48 10:04:48 Time FIGURE 5 Cumulative distance versus time for 14 trips.