30 Years of shark fishing in west africa - Shark Specialist Group
30 Years of shark fishing in west africa - Shark Specialist Group
30 Years of shark fishing in west africa - Shark Specialist Group

Create successful ePaper yourself
Turn your PDF publications into a flip-book with our unique Google optimized e-Paper software.
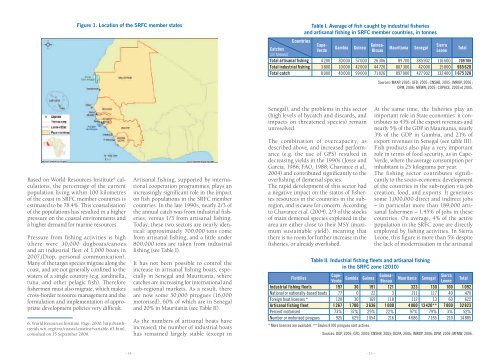
Figure 1. Location <strong>of</strong> the SRFC member states<br />
Countries<br />
Table I. Average <strong>of</strong> fish caught by <strong>in</strong>dustrial fisheries<br />
and artisanal <strong>fish<strong>in</strong>g</strong> <strong>in</strong> SRFC member countries, <strong>in</strong> tonnes<br />
Cape-<br />
Verde<br />
Gambia<br />
Gu<strong>in</strong>ea<br />
Gu<strong>in</strong>ea-<br />
Bissau<br />
Mauritania<br />
Senegal<br />
Sierra<br />
Leone<br />
Catches<br />
(<strong>in</strong> tonnes)<br />
Total artisanal <strong>fish<strong>in</strong>g</strong> 4 200 <strong>30</strong> 000 57 000 26 <strong>30</strong>6 89 700 385 902 116 600 709 708<br />
Total <strong>in</strong>dustrial <strong>fish<strong>in</strong>g</strong> 3 800 10 000 42 000 44 720 807 <strong>30</strong>0 42 000 15 800 965 620<br />
Total catch 8 000 40 000 99 000 71 026 897 000 427 902 132 400 1 675 328<br />
Total<br />
Sources: MAAP, 2005 ; GFD, 2005 ; CNSHB, 2005 ; IMROP, 2006 ;<br />
DPM, 2006 ; MFMW, 2005 ; COPACE, 2003 et 2005.<br />
Based on World Resources Institute 6 calculations,<br />
the percentage <strong>of</strong> the current<br />
population liv<strong>in</strong>g with<strong>in</strong> 100 kilometres<br />
<strong>of</strong> the coast <strong>in</strong> SRFC member countries is<br />
estimated to be 78.4%. This ‘coastalisation’<br />
<strong>of</strong> the populations has resulted <strong>in</strong> a higher<br />
pressure on the coastal environments and<br />
a higher demand for mar<strong>in</strong>e resources.<br />
Pressure from <strong>fish<strong>in</strong>g</strong> activities is high<br />
(there were <strong>30</strong>,000 dugboats/canoes<br />
and an <strong>in</strong>dustrial fleet <strong>of</strong> 1,000 boats <strong>in</strong><br />
2007,(Diop, personal communication).<br />
Many <strong>of</strong> the target species migrate along the<br />
coast, and are not generally conf<strong>in</strong>ed to the<br />
waters <strong>of</strong> a s<strong>in</strong>gle country (e.g. sard<strong>in</strong>ella,<br />
tuna, and other pelagic fish). Therefore<br />
fishermen must also migrate, which makes<br />
cross-border resource management and the<br />
formulation and implementation <strong>of</strong> appropriate<br />
development policies very difficult.<br />
6. World Resources Institute, Page, 2000. http://earthtrends.wri.org/text/coastal-mar<strong>in</strong>e/variable-63.html,<br />
consulted on 15 September 2009.<br />
Artisanal <strong>fish<strong>in</strong>g</strong>, supported by <strong>in</strong>ternational<br />
cooperation programmes, plays an<br />
<strong>in</strong>creas<strong>in</strong>gly significant role <strong>in</strong> the impact<br />
on fish populations <strong>in</strong> the SRFC member<br />
countries. In the late 1990s, nearly 2/3 <strong>of</strong><br />
the annual catch was from <strong>in</strong>dustrial fisheries,<br />
versus 1/3 from artisanal <strong>fish<strong>in</strong>g</strong>.<br />
Today, these two sectors are nearly identical:<br />
approximately 700,000 tons come<br />
from artisanal <strong>fish<strong>in</strong>g</strong>, and a little under<br />
800,000 tons are taken from <strong>in</strong>dustrial<br />
<strong>fish<strong>in</strong>g</strong> (see Table I).<br />
It has not been possible to control the<br />
<strong>in</strong>crease <strong>in</strong> artisanal <strong>fish<strong>in</strong>g</strong> boats, especially<br />
<strong>in</strong> Senegal and Mauritania, where<br />
catches are <strong>in</strong>creas<strong>in</strong>g for <strong>in</strong>ternational and<br />
sub-regional markets. As a result, there<br />
are now some <strong>30</strong>,000 pirogues (16,000<br />
motorised), 60% <strong>of</strong> which are <strong>in</strong> Senegal<br />
and 20% <strong>in</strong> Mauritania (see Table II).<br />
As the numbers <strong>of</strong> artisanal boats have<br />
<strong>in</strong>creased, the number <strong>of</strong> <strong>in</strong>dustrial boats<br />
has rema<strong>in</strong>ed largely stable (except <strong>in</strong><br />
Senegal), and the problems <strong>in</strong> this sector<br />
(high levels <strong>of</strong> bycatch and discards, and<br />
impacts on threatened species) rema<strong>in</strong><br />
unresolved.<br />
The comb<strong>in</strong>ation <strong>of</strong> overcapacity, as<br />
described above, and <strong>in</strong>creased performance<br />
(e.g. the use <strong>of</strong> GPS) resulted <strong>in</strong><br />
decreas<strong>in</strong>g yields <strong>in</strong> the 1990s (Josse and<br />
Garcia, 1986; FAO, 1988; Chavance et al.,<br />
2004) and contributed significantly to the<br />
over<strong>fish<strong>in</strong>g</strong> <strong>of</strong> demersal species.<br />
The rapid development <strong>of</strong> this sector had<br />
a negative impact on the status <strong>of</strong> fisheries<br />
resources <strong>in</strong> the countries <strong>in</strong> the subregion,<br />
and is cause for concern. Accord<strong>in</strong>g<br />
to Chavance et al. (2004), 2/3 <strong>of</strong> the stocks<br />
<strong>of</strong> ma<strong>in</strong> demersal species exploited <strong>in</strong> the<br />
area are either close to their MSY (maximum<br />
susta<strong>in</strong>able yield), mean<strong>in</strong>g that<br />
there is no room for further <strong>in</strong>crease <strong>in</strong> the<br />
fisheries, or already overfished.<br />
At the same time, the fisheries play an<br />
important role <strong>in</strong> State economies: it contributes<br />
to 43% <strong>of</strong> the export revenues and<br />
nearly 5% <strong>of</strong> the GDP <strong>in</strong> Mauritania, nearly<br />
3% <strong>of</strong> the GDP <strong>in</strong> Gambia, and 21% <strong>of</strong><br />
export revenues <strong>in</strong> Senegal (see table III).<br />
Fish products also play a very important<br />
role <strong>in</strong> terms <strong>of</strong> food security, as <strong>in</strong> Cape-<br />
Verde, where the average consumption per<br />
<strong>in</strong>habitant is 25 kilograms per year.<br />
The <strong>fish<strong>in</strong>g</strong> sector contributes significantly<br />
to the socio-economic development<br />
<strong>of</strong> the countries <strong>in</strong> the sub-region via job<br />
creation, food, and exports. It generates<br />
some 1,000,000 direct and <strong>in</strong>direct jobs<br />
– <strong>in</strong> particular more than 189,000 artisanal<br />
fishermen – 1.45% <strong>of</strong> jobs <strong>in</strong> these<br />
countries. On average, 4% <strong>of</strong> the active<br />
population <strong>in</strong> the SRFC zone are directly<br />
employed by <strong>fish<strong>in</strong>g</strong> activities. In Sierra<br />
Leone, this figure is more than 5% despite<br />
the lack <strong>of</strong> modernisation <strong>in</strong> the artisanal<br />
Table II. Industrial <strong>fish<strong>in</strong>g</strong> fleets and artisanal <strong>fish<strong>in</strong>g</strong><br />
<strong>in</strong> the SRFC zone (2010)<br />
Flottilles<br />
Cape-<br />
Verde Gambia Gu<strong>in</strong>ea Gu<strong>in</strong>ea-<br />
Sierra<br />
Mauritania Senegal<br />
Bissau<br />
Leone<br />
Total<br />
Industrial <strong>fish<strong>in</strong>g</strong> fleets 197 <strong>30</strong> 191 121 323 1<strong>30</strong> 100 1 092<br />
National or nationally-based boats 77 0 22 3 211 117 40 470<br />
Foreign boat licenses * 120 <strong>30</strong> 169 118 112 13 60 622<br />
Artisanal <strong>fish<strong>in</strong>g</strong> fleet 1 267 1 700 3 636 1 000 4 800 13 420** 7 000 32 823<br />
Percent motorised 73% 37% 29% 22% 97% 79% 3% 52%<br />
Number or motorised pirogues 925 629 1 054 216 4 686 7 165 210 14 885<br />
* More licenses are available. ** Seules 8 991 pirogues sont actives.<br />
Sources: DGP, 2005; GFD, 2004; CNSHB, 2005; DGPA, 2006; IMROP, 2006; DPM, 2006; MFMW, 2006.<br />
- 14 - - 15 -