1500 Thu 3 Bristow Group - Jefferies
1500 Thu 3 Bristow Group - Jefferies
1500 Thu 3 Bristow Group - Jefferies
Create successful ePaper yourself
Turn your PDF publications into a flip-book with our unique Google optimized e-Paper software.
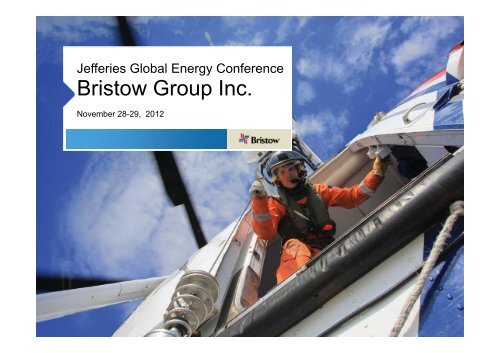
<strong>Jefferies</strong> Global Energy Conference<br />
<strong>Bristow</strong> <strong>Group</strong> Inc.<br />
November 28-29, 2012
Forward-looking statements<br />
This presentation may contain “forward-looking statements” within the meaning of the Private Securities<br />
Litigation Reform Act of 1995. Forward-looking statements include statements about our future<br />
business, operations, capital expenditures, fleet composition, capabilities and results; modeling<br />
information, earnings guidance, expected operating margins and other financial projections; future<br />
dividends, share repurchase and other uses of excess cash; plans, strategies and objectives of our<br />
management, including our plans and strategies to grow earnings and our business, our general<br />
strategy going forward and our business model; expected actions by us and by third parties, including<br />
our customers, competitors and regulators; the valuation of our company and its valuation relative to<br />
relevant financial indices; assumptions underlying or relating to any of the foregoing, including<br />
assumptions regarding factors impacting our business, financial results and industry; and other matters.<br />
Our forward-looking statements reflect our views and assumptions on the date of this presentation<br />
regarding future events and operating performance. They involve known and unknown risks,<br />
uncertainties and other factors, many of which may be beyond our control, that may cause actual<br />
results to differ materially from any future results, performance or achievements expressed or implied by<br />
the forward-looking statements. These risks, uncertainties and other factors include those discussed<br />
under the captions “Risk Factors” and “Management’s Discussion and Analysis of Financial Condition<br />
and Results of Operations” in our Annual Report on Form 10-K for the fiscal year-ended March 31, 2012<br />
and our Quarterly Report on Form 10-Q for the quarter ended September 30, 2012. We do not<br />
undertake any obligation, other than as required by law, to update or revise any forward-looking<br />
statements, whether as a result of new information, future events or otherwise.<br />
2
<strong>Bristow</strong> is the leading provider of helicopter services<br />
and is a unique investment in oil field services<br />
<strong>Bristow</strong> flies crews and light cargo to production platforms, vessels and rigs<br />
• ~20 countries<br />
• 546 aircraft<br />
• ~3,400 employees<br />
• Ticker: BRS<br />
$67<br />
• Stock price * : $49.25/share<br />
• Market cap * : ~$1.8 billion<br />
• Quarterly dividend of $0.20/share<br />
* Based on 36.5 million fully diluted weighted average shares outstanding for the six months ended 09/30/2012 and stock price as of November 9, 2012<br />
3
Why <strong>Bristow</strong>?<br />
• <strong>Bristow</strong> is the largest of only two global helicopter providers<br />
• <strong>Bristow</strong> is stable as we have long term contracts that serve<br />
mostly production<br />
• <strong>Bristow</strong> is growing with demand not dependent on economic<br />
or commodity cycles<br />
• <strong>Bristow</strong>’s asset values are resilient even in depressed<br />
economic times as there $275 is strong demand for helicopters<br />
outside of E&P<br />
• <strong>Bristow</strong> pays a quarterly dividend of $0.20/share after a 33%<br />
increase in June 2012 and has a $100 million share repurchase<br />
reauthorization<br />
4
TARGET ZERO, our industry leading safety program,<br />
creates differentiation and client loyalty<br />
• Safety is our primary core value<br />
• <strong>Bristow</strong>’s ‘Target Zero’ program is now the leading example<br />
emulated industry-wide<br />
• Safety Performance accounts for 25% of management<br />
incentive compensation<br />
• 2011 National Ocean Industries Association (NOIA) Safety<br />
in Seas Award Winner<br />
5
Our value proposition is based on three principles:<br />
secular growth, financial safety, and balanced return<br />
Long term value for our<br />
shareholders<br />
Investment:<br />
FY 2012 - 2016<br />
2. Prudent Balance<br />
Sheet management<br />
with ample liquidity<br />
1. Growth not dependent<br />
on economic or<br />
commodity cycles<br />
3. Capital Return<br />
through dividends and<br />
opportunistic share repurchases<br />
6
1. <strong>Bristow</strong> services are utilized in every phase of<br />
offshore oil and gas activity, especially production<br />
• Largest share of revenues (>60%) relates to<br />
oil and gas production, providing stability and<br />
growth opportunities<br />
• There are ~ 8,000 offshore production<br />
installations worldwide — compared with<br />
>600 exploratory drilling rigs<br />
• ~ 1,700 helicopters are servicing the<br />
worldwide oil and gas industry of which<br />
<strong>Bristow</strong>’s fleet is approximately one-third<br />
Typical revenues by segment<br />
Other 10%<br />
Exploration<br />
20%<br />
Development<br />
10%<br />
• <strong>Bristow</strong> revenues are primarily driven by<br />
operating expenditures<br />
Production<br />
60%<br />
H e l i c o p t e r t r a n s p o r t a t i o n s e r v i c e s<br />
SEISMIC<br />
EXPLORATION<br />
DEVELOPMENT<br />
PRODUCTION<br />
ABANDONMENT<br />
7
<strong>Bristow</strong>’s contract structure generates predictable cashflow:<br />
Significant operating leverage<br />
• Two tiered contract structure includes both:<br />
– Fixed or monthly standing charge to reserve helicopter<br />
capacity<br />
– Variable fees based on hours flown with fuel pass through<br />
• <strong>Bristow</strong> contracts earn 65% of revenue without flying<br />
Revenue sources<br />
Operating income<br />
Variable<br />
hourly<br />
35%<br />
Variable<br />
hourly<br />
30%<br />
Fixed<br />
monthly<br />
65%<br />
Fixed<br />
monthly<br />
70%<br />
8
<strong>Bristow</strong>’s contract structure generates predictable cashflow:<br />
AS332L/EC225 Super Puma Fleet Update<br />
• Operational Update:<br />
• On October 25, 2012, the UK CAA issued a Safety Directive, requiring operators to suspend operations of<br />
certain Eurocopter Super Puma aircraft following two accidents with other operators in the past six months<br />
• <strong>Bristow</strong> currently has not and will not be operating a total of 16 large Eurocopter aircraft until further notice.<br />
We have increased utilization of other in-region aircraft and has moved, or is moving, available aircraft to<br />
minimize or eliminate the impact to our clients<br />
• Clients have also extended rotations, reduced platform manning to minimum levels and moved to seven days<br />
per week flights to perform crew changes and maximize utilization of available aircraft<br />
• Technical Update:<br />
• Eurocopter’s investigation into the root cause for the main gearbox shaft failure is proceeding, and Eurocopter<br />
has advised that the earliest date for full operational availability is expected to be February 2013<br />
• Commercial Update<br />
• Our large Eurocopter aircraft remain under contract with clients who are currently fulfilling their contractual<br />
obligations<br />
• Several other aircraft types due for delivery this quarter have now been contracted in the UK on multi-year<br />
contracts at enhanced rates<br />
• <strong>Bristow</strong> is in discussions with several clients regarding opportunities for contracting the recently announced<br />
ten additional Sikorsky S92 large aircraft order<br />
• Financial Update:<br />
• In light of all the facts we know today, <strong>Bristow</strong> reaffirms FY13 EPS guidance at $3.25-$3.55 per share*<br />
*Please see our earnings release for more information regarding earnings guidance<br />
9
We continue to renew and add new multi-year<br />
contracts for large aircraft with improved rates<br />
OIBU<br />
Lider (Petrobras)<br />
Lider (Petrobras)<br />
4 X LARGE<br />
1 X LARGE BRS LEASED TO LIDER<br />
AUSBU<br />
INPEX<br />
6 X LARGE WITH AN OPTION TO ADD A LONG TERM SAR A/C<br />
EBU<br />
UK North Sea<br />
Norway SAR<br />
Norway<br />
2 X LARGE<br />
3 X LARGE WITH 5 YR OPTION TO EXTEND<br />
4 X LARGE WITH 5 YR OPTION TO EXTEND<br />
PREVIOUSLY ANNOUNCED NEW<br />
CONTRACTS WITH NEW IMPROVED RATES<br />
PREVIOUSLY ANNOUNCED EXISTING<br />
CONTRACTS WITH CURRENT RATES<br />
UPDATED NEW CONTRACTS<br />
WITH NEW IMPROVED RATES<br />
Norway<br />
3 X LARGE<br />
UK<br />
1 X LARGE<br />
UK<br />
2 X LARGE<br />
NABU<br />
Gulf of Mexico<br />
1 X LARGE<br />
Jul-12 Jul-13 Jul-14 Jul-15 Jun-16 Jun-17 Jun-18 Jun-19 Jun-20 Jun-21 Jun-22 Jun-23 Jun-24 Jun-25<br />
10
The market outlook continues to improve in FY13<br />
and FY14<br />
Overall<br />
activity<br />
above pre-<br />
2008 levels<br />
Brazil<br />
growth<br />
accelerates<br />
NABU<br />
market<br />
returning<br />
• The overall market both in terms of tender activity and pricing is<br />
improving<br />
• North Sea tender activity remains at historic levels<br />
• Aircraft supply remains tight with significant SAR requirements<br />
(both governmental and O&G) and is exacerbated by the<br />
recent suspension of certain AS332L/EC225 Super Puma a/c<br />
• Petrobras board approved 52 incremental aircraft through<br />
FY15 with a focus on large aircraft. First ten were awarded, of<br />
which Lider will provide five, and a new bid is expected later<br />
this year for the next tranche.<br />
• Demand outside of Brazil expected to be at least equal to<br />
Petrobras suggesting a further tightening of supply/demand for<br />
large a/c<br />
• Most clients increasing activity in GoM as rigs go back to work<br />
• Eastern Canada new drilling activity increasing with Statoil,<br />
ExxonMobil and Chevron<br />
11
2. <strong>Bristow</strong> enjoys the strongest balance sheet in our<br />
industry with ample liquidity, cash flow and asset value<br />
Prudent<br />
Balance<br />
Sheet<br />
management<br />
• Adjusted Debt/Capital Ratio less than 45% with a BBBrating<br />
from Standard & Poor’s for secured debt<br />
• Operating lease strategy used to finance growth with a<br />
competitive cost of capital<br />
Significant<br />
Cash Flow<br />
generation<br />
• BVA leads to a focus on cash and cash flows from<br />
operations. <strong>Bristow</strong> generated 15% more operating cash<br />
flow in FY12 compared to FY11.<br />
Ample<br />
Liquidity with<br />
underlying<br />
asset value<br />
• <strong>Bristow</strong> closed Q2 FY13 with more than $500 million of<br />
liquidity<br />
• Fair market value of aircraft is above share price at<br />
September 30, 2012<br />
12
Our focus on returns has yielded much higher<br />
operating cash flow generation . . .<br />
Net cash provided by operating activities<br />
250<br />
231<br />
Full fiscal year<br />
YTD (from Apr 1 to Sep 30)<br />
200<br />
195<br />
$ in millions<br />
150<br />
100<br />
128<br />
151<br />
50<br />
55<br />
94<br />
69<br />
117<br />
135<br />
0<br />
FY09 FY10 FY11 FY12 YTD FY13<br />
See September 30, 2012 10-Q for more information on cash flow provided by operating activities<br />
13
. . . leading to a robust cash and liquidity position<br />
600<br />
500<br />
Total Liquidity<br />
508<br />
400<br />
402<br />
$ in millions<br />
300<br />
261<br />
262<br />
348<br />
200<br />
178<br />
116<br />
78<br />
100<br />
100<br />
144 140<br />
159<br />
-<br />
FY10 FY11 FY12 YTD FY13<br />
Undrawn borrowing capacity<br />
Cash<br />
14
3. <strong>Bristow</strong> has a proven commitment to a balanced return<br />
for our shareholders as demonstrated in the past year<br />
Regular<br />
Dividend<br />
• FY12 quarterly dividend initiated at $0.15/share<br />
• Dividend increased by 33% to $0.20/share in<br />
June 2012 quarter<br />
Share<br />
Repurchase<br />
• <strong>Bristow</strong> has renewed its $100 million share<br />
repurchase reauthorization ($25 million was<br />
executed on prior authorization)<br />
• Value is key to decision with net book value<br />
and aircraft FMV being guide posts<br />
15
<strong>Bristow</strong>’s asset values are resilient and serves as<br />
guideposts for buying back our shares<br />
BV and FMV per Share ($)<br />
51<br />
51.4<br />
50.8<br />
46<br />
43.2<br />
41<br />
S O N D J F M A M J J A S<br />
36<br />
Book value of equity per share FMV of ass ets per share Av g Closing P rice<br />
16
Financial highlights:<br />
FY13 guidance reaffirmed<br />
• EPS guidance range of $3.25 - $3.55, excluding aircraft sales and<br />
special items. We anticipate a better overall second half of FY13<br />
compared to the first half<br />
LACE (Large AirCraft Equivalent) 152 - 156 Depreciation expense ~ $90 - 95M<br />
LACE Rate ~ $8.25 - 8.55M Interest expense ~ $38 - 43M<br />
G & A expense (all inclusive) ~ $142 - 147M Tax rate* ~ 20 - 24%<br />
* Assuming revenue earned in same regions and same mix<br />
17
Conclusions<br />
• Continued improvement in revenue generation through new<br />
contract awards across all business units<br />
• Stronger year-over-year EBITDAR and BVA margins show<br />
strength of business model and commercial leadership<br />
• Unmatched financial profile allows <strong>Bristow</strong> to capitalize on<br />
consolidation (Cougar) and react swiftly to challenges (Super<br />
Pumas) for our customers’ benefit<br />
• We are delivering a balanced shareholder return through<br />
dividend increases (quarterly dividend of $0.20 per share or<br />
33% increase from Q2 FY12) and reauthorization and<br />
increase of opportunistic share repurchases ($100 million)<br />
18
Contact us<br />
<strong>Bristow</strong> <strong>Group</strong> Inc. (NYSE: BRS)<br />
2103 City West Blvd., 4 th Floor<br />
Houston, Texas 77042<br />
t 713.267.7600<br />
f 713.267.7620<br />
bristowgroup.com<br />
19
Appendix<br />
20
Organizational Chart - as of September 30, 2012<br />
Operated Aircraft<br />
<strong>Bristow</strong> owned and/or operated<br />
349 aircraft as of September 30,<br />
2012<br />
Affiliated Aircraft<br />
Key<br />
Corporate<br />
Business Unit (% of FY13 Operating Revenue)<br />
<strong>Bristow</strong> affiliates and joint<br />
ventures operated 197 aircraft<br />
as of September 30, 2012<br />
Region ( # of Aircraft / # of Locations)<br />
Joint Venture (# of aircraft)<br />
21
Aircraft Fleet – Medium and Large<br />
As of September 30, 2012<br />
Medium capacity 12-16 passengers<br />
Aircraft<br />
Type No. of PAX Engine Consl Unconsl Total Ordered*<br />
Large Helicopters<br />
AS332L Super Puma 18 Twin Turbine 19 - 19 -<br />
AW189 16 Twin Turbine - - - 6<br />
EC225 25 Twin Turbine 19 - 19 3<br />
Mil MI 8 20 Twin Turbine 7 - 7 -<br />
Sikorsky S-61 18 Twin Turbine 2 - 2 -<br />
Sikorsky S-92 19 Twin Turbine 32 5 37 21<br />
79 5 84 30<br />
LACE 75<br />
Large capacity 18-25 passengers<br />
Next Generation Aircraft<br />
Mature Aircraft Models<br />
Medium Helicopters<br />
AW139 12 Twin Turbine 7 2 9 -<br />
Bell 212 12 Twin Turbine 1 14 15 -<br />
Bell 412 13 Twin Turbine 32 20 52 -<br />
EC155 13 Twin Turbine 1 - 1 -<br />
Sikorsky S-76A/A++ 12 Twin Turbine 15 5 20 -<br />
Sikorsky S-76C/C++ 12 Twin Turbine 51 33 84 -<br />
107 74 181 -<br />
LACE 46<br />
* On November 7, 2012 we entered into an agreement to order 10 large Sikorsky S-92 aircraft.<br />
Fair market value of our owned fleet is $1.7 billion and leased fleet is $400 million<br />
22
Aircraft Fleet – Small, Training and Fixed<br />
As of September 30, 2012 (continued)<br />
Small capacity 4-7 passengers<br />
Aircraft<br />
Type No. of PAX Engine Consl Unconsl Total Ordered<br />
Small Helicopters<br />
Bell 206B 4 Turbine 1 2 3 -<br />
Bell 206 L-3 6 Turbine 4 6 10 -<br />
Bell 206 L-4 6 Turbine 29 1 30 -<br />
Bell 407 6 Turbine 39 - 39 -<br />
BK 117 7 Twin Turbine 2 - 2 -<br />
BO-105 4 Twin Turbine 2 - 2 -<br />
EC135 7 Twin Turbine 6 3 9 -<br />
83 12 95 -<br />
LACE 21<br />
Training capacity 2-6 passengers<br />
Next Generation Aircraft<br />
Mature Aircraft Models<br />
Training Helicopters<br />
AW139 12 Twin Turbine - 3 3 -<br />
Bell 412 13 Twin Turbine - 8 8 -<br />
Bell 212 12 Twin Turbine - 15 15 -<br />
AS355 4 Twin Turbine 5 - 5 -<br />
AS350BB 4 Turbine - 36 36 -<br />
Agusta 109 8 Twin Turbine - 2 2 -<br />
Bell 206B 6 Single Engine 12 - 12 -<br />
Robinson R22 2 Piston 12 - 12 -<br />
Robinson R44 2 Piston 2 - 2 -<br />
Sikorsky 300CB/Cbi 2 Piston 45 - 45 -<br />
Fixed Wing 1 - 1 -<br />
77 64 141 -<br />
Fixed Wing 3 42 45 -<br />
Total 349 197 546 30<br />
•LACE does not include held for sale, training and fixed wing helicopters<br />
TOTAL LACE (Large Aircraft Equivalent) 142<br />
23
Operating lease strategy: lowering the cost and amount of<br />
capital needed to grow<br />
Leased aircraft as of September 30, 2012<br />
Small Medium Large Total Leased LACE Total LACE % Leased<br />
EBU - - 7 7 7 45 16%<br />
WASBU - 1 - 1 1 22 2%<br />
NABU 1 11 2 14 8 31 25%<br />
AUSBU 2 - 3 5 4 17 21%<br />
OIBU - - - - - 28 0%<br />
Total 3 12 12 27 19 142 13%<br />
• Of the 57 aircraft currently leased in our fleet, 30 are training and 27 are<br />
commercial (19 LACE)<br />
• 19 LACE aircraft represent approximately 13% of our commercial fleet<br />
• Our goal is for commercial fleet operating leases to account for 20-30% of our<br />
LACE<br />
See 10-Q Note 6 “Commitments and contingencies” for more information provided on operating leases<br />
24
Consolidated fleet changes and aircraft sales for<br />
Q2 FY13<br />
Q 1 FY13 Q 2 FY13 YTD<br />
Fleet Count Beginning 361 357 361<br />
Delivered -<br />
S-92 2 2<br />
EC225 1 1<br />
Total Delivered 2 1 3<br />
Removed<br />
Fleet changes<br />
Sales (4) (5) (9)<br />
Other* (2) (4) (6)<br />
Total Removed (6) (9) (15)<br />
357 349 349<br />
* Includes destroyed aircraft, lease returns and commencements<br />
# of A/C Sold Received*<br />
Q1 FY12 4 $ 19.0<br />
Q2 FY12 5 24.8<br />
Totals 9 $ 43.8<br />
* Amounts stated in millions<br />
See 10-Q Note 6 “Commitments and contingencies” for more information provided on operating leases<br />
Held for sale aircraft in consolidated fleet<br />
Small Medium Large Total<br />
EBU - 2 3 5<br />
WASU - 1 - 1<br />
NABU - - - -<br />
AUSBU - 2 1 3<br />
OIBU 1 10 - 11<br />
Total 1 15 4 20<br />
Leased aircraft in consolidated fleet<br />
Small Medium Large Training Total<br />
EBU - - 7 - 7<br />
WASU - 1 - - 1<br />
NABU 1 11 2 - 14<br />
AUSBU 2 - 3 - 5<br />
OIBU - - - - -<br />
Academy - - - 30 30<br />
Total 3 12 12 30 57<br />
25
Operating revenue, LACE and LACE rate by BU<br />
Operating Revenue, LACE, and LACE Rate by BU<br />
YTD FY13<br />
Op revenue* LACE LACE Rate*<br />
EBU 248 45 11.03<br />
WASBU 132 22 12.24<br />
NABU 109 31 7.11<br />
AUSBU 77 17 9.29<br />
IBU 65 28 4.62<br />
Total 631 142 8.95<br />
1) $ in millions<br />
2) LACE Rate is annualized<br />
3) $ in millions per LACE<br />
26
Operating revenue, LACE and LACE rate by BU<br />
LACE<br />
2011 2012<br />
2013<br />
Q1 Q2 Q3 Q4 Q1 Q2 Q3 Q4 Q1 Q2<br />
EBU 42 43 48 46 44 46 46 45 47 45<br />
WASBU 24 24 21 22 23 22 22 22 22 22<br />
NABU 39 35 34 29 30 29 30 30 30 31<br />
AUSBU 20 23 24 20 19 20 20 19 18 17<br />
OIBU 33 33 33 38 39 38 38 34 32 28<br />
Consolidated 157 158 159 154 154 154 155 149 147 142<br />
LACE Rate 1,2<br />
2011 2012<br />
2013<br />
Q1 Q2 Q3 Q4 Q1 Q2 Q3 Q4 Q1 Q2<br />
EBU $8.20 $8.50 $7.90 $8.40 $9.80 $9.60 $9.63 $10.09 $10.60 11.03<br />
WASBU 9.70 9.40 10.70 9.90 9.10 10.30 11.17 11.46 12.35 12.24<br />
NABU 5.40 6.10 6.00 6.60 5.80 6.30 5.89 5.79 7.05 7.11<br />
AUSBU 6.80 6.00 6.00 7.50 8.60 7.10 6.96 7.78 8.48 9.29<br />
OIBU 3.90 4.10 4.40 3.90 3.50 3.70 3.78 4.22 4.22 4.62<br />
Consolidated 6.70 6.90 6.90 7.10 7.30 7.40 7.43 7.89 8.55 8.95<br />
1) $ in millions<br />
2) LACE Rate is annualized<br />
27
Order and options book as of November 7, 2012<br />
ORDER BOOK*<br />
Helicopter<br />
Class Delivery Date Location Contracted #<br />
OPTIONS BOOK<br />
Helicopter<br />
Class<br />
#<br />
Delivery Date<br />
5 Large December 2012 EBU 5 of 5 1 Large June 2014<br />
2 Large March 2013 EBU 2 of 2 1 Large September 2014<br />
4 Large September 2013 NABU 1 of 4 3 Large December 2014<br />
2 Large December 2013 AUSBU 1 of 2 4 Large March 2015<br />
2 Large December 2013 WASBU 3 Large June 2015<br />
2 Large December 2013 EBU 3 Large September 2015<br />
1 Large March 2014 AUSBU 3 Large December 2015<br />
1 Large March 2014 EBU 2 Large March 2016<br />
1 Large March 2014 WASBU 3 Large June2016<br />
1 Large June 2014 EBU 3 Large September 2016<br />
1 Large June 2014 NABU 3 Large December 2016<br />
1 Large September 2014 EBU 2 Large March 2017<br />
2 Large September 2014 NABU 1 of 2 2 Large June2017<br />
1 Large December 2014 WASBU 2 Large September 2017<br />
1 Large March 2015 OIBU 2 Large December 2017<br />
1 Large June 2015 EBU 2 Medium June 2014<br />
1 Large March 2016 EBU 1 Medium September 2014<br />
1 Large June 2016 AUSBU 2 Medium December 2014<br />
30 10 of 30 1 Medium March 2015<br />
3 Medium September 2015<br />
* Six large ordered aircraft expected to enter service late 3 Medium December 2015<br />
calendar 2014 are subject to the successful development 49<br />
and certification of the aircraft.<br />
On November 7, 2012 we entered into an agreement<br />
to order ten large Sikorsky S-92 aircraft and<br />
obtain options for 16 large Sikorsky S-92 aircraft, which are<br />
reflected in this table.<br />
28
Adjusted EBITDAR margin* trend<br />
2010 2011<br />
Q1 Q2 Q3 Q4 Full Year Q1 Q2 Q3 Q4 Full Year<br />
EBU 31.2% 31.7% 31.9% 28.0% 30.8% 29.8% 31.5% 34.6% 34.4% 32.7%<br />
WASBU 31.7% 36.8% 33.7% 39.1% 36.0% 33.7% 36.9% 35.8% 34.3% 35.2%<br />
NABU 18.3% 20.0% 14.9% 17.7% 17.8% 20.8% 25.8% 15.9% 8.5% 18.5%<br />
AUSBU 26.5% 36.7% 34.4% 31.3% 32.4% 33.2% 26.1% 27.0% 31.1% 29.3%<br />
OIBU 34.4% 37.6% 25.9% 25.1% 31.0% 18.3% 40.2% 37.4% 59.4% 39.3%<br />
Consolidated 24.7% 27.8% 24.7% 23.9% 25.3% 23.8% 27.5% 25.9% 29.6% 26.7%<br />
2012 2013<br />
Q1 Q2 Q3 Q4 Full Year Q1 Q2<br />
EBU 33.0% 31.4% 30.7% 36.1% 32.9% 32.2% 34.6%<br />
WASBU 29.5% 35.5% 37.2% 36.6% 35.0% 31.9% 26.5%<br />
NABU 14.3% 20.6% 14.8% 19.4% 17.3% 23.2% 20.7%<br />
AUSBU 20.2% 14.4% 23.5% 35.6% 24.3% 27.0% 28.0%<br />
OIBU 48.1% 19.1% 47.8% 42.9% 39.5% 36.2% 44.2%<br />
Consolidated 23.4% 24.0% 27.6% 31.2% 26.6% 26.3% 26.1%<br />
* Adjusted EBITDAR excludes special items and asset dispositions and calculated by taking adjusted EBITDAR divided by operating revenue<br />
29
Adjusted EBITDAR* reconciliation<br />
Fiscal year ended,<br />
3/31/2010 3/31/2011<br />
($ in millions) Q1 Q2 Q3 Q4 YTD Q1 Q2 Q3 Q4 YTD<br />
Net income $24.0 $33.7 $27.1 $28.7 $113.5 $20.9 $38.8 $42.3 $31.2 $133.3<br />
Income tax expense 9.5 11.2 5.7 2.6 29.0 8.5 3.3 -11.8 7.1 7.1<br />
Interest expense 10.0 10.6 11.0 10.8 42.4 11.1 11.5 13.8 9.9 46.2<br />
Gain on disposal of assets -6.0 -4.9 -2.4 -5.3 -18.7 -1.7 -1.9 0.0 -5.1 -8.7<br />
Depreciation and amortization 18.2 18.5 20.7 17.4 74.7 19.3 21.0 21.3 27.7 89.4<br />
Special items 2.5 -2.4 -1.2 1.0 0.0 0.0 0.0 -1.2 2.4 1.2<br />
EBITDA Subtotal 58.2 66.7 60.8 55.1 240.9 58.1 72.7 64.4 73.3 268.5<br />
Rental expense 7.0 6.9 7.2 6.3 27.3 6.6 6.1 8.7 7.7 29.2<br />
Adjusted EBITDAR $65.2 $73.6 $0.1 $61.3 $268.2 $64.7 $78.8 $73.1 $81.1 $297.7<br />
3/31/2012 3/31/2013<br />
($ in millions) Q1 Q2 Q3 Q4 YTD Q1 Q2<br />
Net income $21.2 $3.0 $26.5 $14.6 $65.2 $24.2 $30.4<br />
Income tax expense 6.6 -1.9 7.1 2.4 14.2 6.2 8.3<br />
Interest expense 9.0 9.5 9.8 10.0 38.1 8.8 8.6<br />
Gain on disposal of assets -1.4 1.6 2.9 28.6 31.7 5.3 1.3<br />
Depreciation and amortization 22.7 25.4 22.7 25.3 96.1 21.4 23.3<br />
Special items 0.0 24.6 0.0 3.4 28.1 2.2 -2.3<br />
EBITDA Subtotal 58.1 62.1 68.9 84.3 273.4 68.0 69.7<br />
Rental expense 9.0 9.1 12.8 15.1 46.0 16.3 15.3<br />
Adjusted EBITDAR $67.0 $71.2 $81.8 $99.5 $319.5 $84.3 $84.9<br />
* Adjusted EBITDAR excludes special items and asset dispositions<br />
30
<strong>Bristow</strong> Value Added (BVA)<br />
Sample calculation for Q2 FY13 and Q2 FY12<br />
<strong>Bristow</strong> Value Added = Gross Cash Flow – (Gross Operating Assets X Capital Charge)<br />
BVA = GCF - ( GOA X 10.5%** )<br />
<strong>Bristow</strong> Value Added calculation for Q2 FY13<br />
$2.1 = $79* - ( $2,922* X 2.625%** )<br />
<strong>Bristow</strong> Value Added calculation for Q2 FY12<br />
$0 = $76* - ( $2,907* X 2.625%** )<br />
* Reconciliation for these items follows right after this slide<br />
** Quarterly capital charge of 2.625% is based on annual capital charge of 10.5%<br />
31
Gross Cash Flow Presentation<br />
(in millions)<br />
Gross Cash Flow Reconciliation FY12Q2 FY13Q2<br />
Net Income 3 30<br />
Depreciation and Amortization 25 23<br />
Interest Expense 9 9<br />
Interest Income (0) (0)<br />
Rent 9 15<br />
Other Income/expense-net (1) 0<br />
Earnings of Discontinued Operations - -<br />
Gain/loss on Asset Sale 2 1<br />
Special Items 25 0<br />
Tax Effect from Special Items (6) 0<br />
Earnings (losses) from Unconsolidated Affiliates, Net 4 (7)<br />
Non-controlling Interests 0 1<br />
Gross Cash Flow before Lider $71 $72<br />
Gross Cashflow -Lider proportional 6 7<br />
Gross Cash Flow after Lider $76 $79<br />
Special items:<br />
FY13 includes: $2.2m special charge for severance costs related to the termination of a contract in the Southern North Sea<br />
32
Gross Operating Asset Presentation<br />
(in millions)<br />
Adjusted Gross Operating Assets Reconciliation Q2 FY12 Q2 FY13<br />
Total Assets 2,700 2,785<br />
Accumulated Depreciation 465 464<br />
Capitalized Operating Leases 129 225<br />
Cash and Cash Equivalents (140) (348)<br />
Investment in Unconsolidated Entities (202) (215)<br />
Goodwill (29) (30)<br />
Intangibles (6) (4)<br />
Assets Held for Sale: Net (32) (20)<br />
Assets Held for Sale: Gross 75 83<br />
Adj. for gains & losses on assets sales 34 120<br />
Accounts Payable (47) (56)<br />
Accrued Maintenance and Repairs (14) (19)<br />
Other Accrued Taxes (5) (8)<br />
Accrued Wages, Benefits and Related Taxes (35) (45)<br />
Other Accrued Liabilities (20) (27)<br />
Income Taxes Payable (14) (13)<br />
Deferred Revenue (12) (13)<br />
ST Deferred Taxes (7) (15)<br />
LT Deferred Taxes (145) (144)<br />
Adjusted Gross Operating Assets before Lider $2,696 $2,723<br />
Adjusted Gross Operating Assets-Lider proportional 212 199<br />
Adjusted Gross Operating Assets after Lider $2,907 $2,922<br />
33
GAAP reconciliation<br />
Three Months Ended Six Months Ended<br />
September 30, September 30,<br />
2012 2011 2012 2011<br />
(In thousands)<br />
Adjusted operating income ................................................................ $ 46,274 $ 38,493 $ 93,276 $ 73,482<br />
Loss on disposal of assets ................................................................(1,262) (1,611) (6,577) (195)<br />
Special items ................................................................................................ 2,316 (27,287) 622 (27,287)<br />
Operating income ................................................................................................<br />
$ 47,328 $ 9,595 $ 87,321 $ 46,000<br />
Adjusted EBITDAR ................................................................................................<br />
$ 84,922 $ 71,235 $ 168,727 $ 138,260<br />
Loss on disposal of assets ................................................................(1,262) (1,611) (6,577) (195)<br />
Special items ................................................................................................ 2,316 (24,610) 622 (24,610)<br />
Depreciation and amortization ................................................................ (23,321) (25,431) (44,693) (48,139)<br />
Rent expense ................................................................................................ (15,282) (9,108) (31,556) (18,061)<br />
Interest expense ................................................................................................ (8,597) (9,459) (17,371) (18,414)<br />
(Provision) benefit for income taxes ................................................................ (8,342) 1,945 (14,522) (4,661)<br />
Net income ................................................................................................ $ 30,434 $ 2,961 $ 54,630 $ 24,180<br />
Adjusted net income ................................................................................................<br />
$ 29,153 $ 23,287 $ 58,425 $ 43,227<br />
Loss on disposal of assets ................................................................ (990) (1,257) (5,196) (152)<br />
Special items ................................................................................................ 1,505 (19,319) 101 (19,319)<br />
Net income attributable to <strong>Bristow</strong> <strong>Group</strong> ................................ $ 29,668 $ 2,711 $ 53,330 $ 23,756<br />
Adjusted diluted earnings per share ................................................................ $ 0.80 $ 0.63 $ 1.60 $ 1.18<br />
Loss on disposal of assets ................................................................ (0.03) (0.03) (0.14) —<br />
Special items ................................................................................................ 0.04 (0.53) — (0.53)<br />
Diluted earnings per share ................................................................ 0.82 0.07 1.46 0.65<br />
34
Leverage Reconciliation<br />
Debt Investment Capital Leverage<br />
(a) (b) (c) = (a) + (b) (a) / (c)<br />
(in millions)<br />
As of September 30, 2012 $ 734.7 $ 1,580.2 $ 2,314.9 31.7%<br />
Adjust for:<br />
Unfunded Pension Liability 112.2 112.2<br />
NPV of Lease Obligations 224.8 224.8<br />
Letters of credit 1.5 1.5<br />
Adjusted $ 1,073.2 (d) $ 1,580.2 $ 2,653.4 40.4%<br />
Calculation of debt to adjusted EBITDAR multiple<br />
Adjusted EBITDAR*:<br />
TTM FY 2013 $ 350.0 (e)<br />
= (d) / (e) 3.07:1<br />
*Adjusted EBITDAR exclude gains and losses on dispositions of assets<br />
35
Contact Us<br />
<strong>Bristow</strong> <strong>Group</strong> Inc. (NYSE: BRS)<br />
2103 City West Blvd., 4 th Floor<br />
Houston, Texas 77042<br />
t 713.267.7600<br />
f 713.267.7620<br />
bristowgroup.com<br />
36


![1530 Wed 3 Basic Energy Services [Compatibility Mode] - Jefferies](https://img.yumpu.com/23648530/1/190x135/1530-wed-3-basic-energy-services-compatibility-mode-jefferies.jpg?quality=85)

