full report - Jefferies
full report - Jefferies
full report - Jefferies

Create successful ePaper yourself
Turn your PDF publications into a flip-book with our unique Google optimized e-Paper software.
INDUSTRY NOTE<br />
Rating | Target | Estimate Change<br />
Healthcare | Pharmaceuticals May 28, 2013<br />
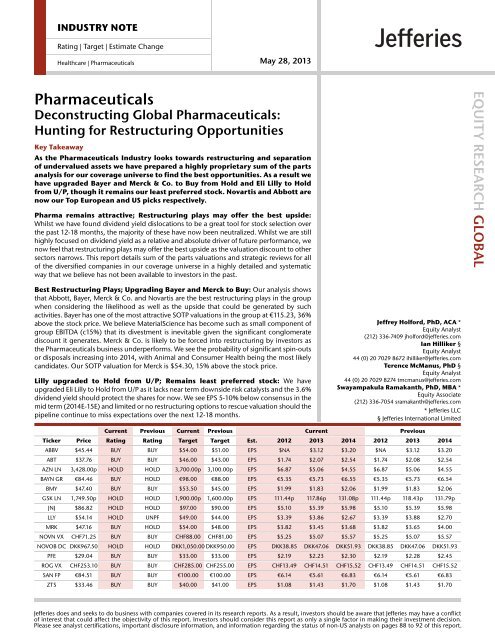
Pharmaceuticals<br />
Deconstructing Global Pharmaceuticals:<br />
Hunting for Restructuring Opportunities<br />
Key Takeaway<br />
As the Pharmaceuticals Industry looks towards restructuring and separation<br />
of undervalued assets we have prepared a highly proprietary sum of the parts<br />
analysis for our coverage universe to find the best opportunities. As a result we<br />
have upgraded Bayer and Merck & Co. to Buy from Hold and Eli Lilly to Hold<br />
from U/P, though it remains our least preferred stock. Novartis and Abbott are<br />
now our Top European and US picks respectively.<br />
Pharma remains attractive; Restructuring plays may offer the best upside:<br />
Whilst we have found dividend yield dislocations to be a great tool for stock selection over<br />
the past 12-18 months, the majority of these have now been neutralized. Whilst we are still<br />
highly focused on dividend yield as a relative and absolute driver of future performance, we<br />
now feel that restructuring plays may offer the best upside as the valuation discount to other<br />
sectors narrows. This <strong>report</strong> details sum of the parts valuations and strategic reviews for all<br />
of the diversified companies in our coverage universe in a highly detailed and systematic<br />
way that we believe has not been available to investors in the past.<br />
EQUITY RESEARCH GLOBAL<br />
Best Restructuring Plays; Upgrading Bayer and Merck to Buy: Our analysis shows<br />
that Abbott, Bayer, Merck & Co. and Novartis are the best restructuring plays in the group<br />
when considering the likelihood as well as the upside that could be generated by such<br />
activities. Bayer has one of the most attractive SOTP valuations in the group at €115.23, 36%<br />
above the stock price. We believe MaterialScience has become such as small component of<br />
group EBITDA (c15%) that its divestment is inevitable given the significant conglomerate<br />
discount it generates. Merck & Co. is likely to be forced into restructuring by investors as<br />
the Pharmaceuticals business underperforms. We see the probability of significant spin-outs<br />
or disposals increasing into 2014, with Animal and Consumer Health being the most likely<br />
candidates. Our SOTP valuation for Merck is $54.30, 15% above the stock price.<br />
Lilly upgraded to Hold from U/P; Remains least preferred stock: We have<br />
upgraded Eli Lilly to Hold from U/P as it lacks near term downside risk catalysts and the 3.6%<br />
dividend yield should protect the shares for now. We see EPS 5-10% below consensus in the<br />
mid term (2014E-15E) and limited or no restructuring options to rescue valuation should the<br />
pipeline continue to miss expectations over the next 12-18 months.<br />
Jeffrey Holford, PhD, ACA *<br />
Equity Analyst<br />
(212) 336-7409 jholford@jefferies.com<br />
Ian Hilliker §<br />
Equity Analyst<br />
44 (0) 20 7029 8672 ihilliker@jefferies.com<br />
Terence McManus, PhD §<br />
Equity Analyst<br />
44 (0) 20 7029 8274 tmcmanus@jefferies.com<br />
Swayampakula Ramakanth, PhD, MBA *<br />
Equity Associate<br />
(212) 336-7054 sramakanth@jefferies.com<br />
* <strong>Jefferies</strong> LLC<br />
§ <strong>Jefferies</strong> International Limited<br />
Current Previous Current Previous Current Previous<br />
Ticker Price Rating Rating Target Target Est. 2012 2013 2014 2012 2013 2014<br />
ABBV $45.44 BUY BUY $54.00 $51.00 EPS $NA $3.12 $3.20 $NA $3.12 $3.20<br />
ABT $37.76 BUY BUY $46.00 $43.00 EPS $1.74 $2.07 $2.54 $1.74 $2.08 $2.54<br />
AZN LN 3,428.00p HOLD HOLD 3,700.00p 3,100.00p EPS $6.87 $5.06 $4.55 $6.87 $5.06 $4.55<br />
BAYN GR €84.46 BUY HOLD €98.00 €88.00 EPS €5.35 €5.73 €6.55 €5.35 €5.73 €6.54<br />
BMY $47.40 BUY BUY $53.50 $45.00 EPS $1.99 $1.83 $2.06 $1.99 $1.83 $2.06<br />
GSK LN 1,749.50p HOLD HOLD 1,900.00p 1,600.00p EPS 111.44p 117.86p 131.08p 111.44p 118.43p 131.79p<br />
JNJ $86.82 HOLD HOLD $97.00 $90.00 EPS $5.10 $5.39 $5.98 $5.10 $5.39 $5.98<br />
LLY $54.14 HOLD UNPF $49.00 $44.00 EPS $3.39 $3.86 $2.67 $3.39 $3.88 $2.70<br />
MRK $47.16 BUY HOLD $54.00 $48.00 EPS $3.82 $3.45 $3.68 $3.82 $3.65 $4.00<br />
NOVN VX CHF71.25 BUY BUY CHF88.00 CHF81.00 EPS $5.25 $5.07 $5.57 $5.25 $5.07 $5.57<br />
NOVOB DC DKK967.50 HOLD HOLD DKK1,050.00 DKK950.00 EPS DKK38.85 DKK47.06 DKK51.93 DKK38.85 DKK47.06 DKK51.93<br />
PFE $29.04 BUY BUY $33.00 $33.00 EPS $2.19 $2.23 $2.30 $2.19 $2.28 $2.45<br />
ROG VX CHF253.10 BUY BUY CHF285.00 CHF255.00 EPS CHF13.49 CHF14.51 CHF15.52 CHF13.49 CHF14.51 CHF15.52<br />
SAN FP €84.51 BUY BUY €100.00 €100.00 EPS €6.14 €5.61 €6.83 €6.14 €5.61 €6.83<br />
ZTS $33.46 BUY BUY $40.00 $41.00 EPS $1.08 $1.43 $1.70 $1.08 $1.43 $1.70<br />
<strong>Jefferies</strong> does and seeks to do business with companies covered in its research <strong>report</strong>s. As a result, investors should be aware that <strong>Jefferies</strong> may have a conflict<br />
of interest that could affect the objectivity of this <strong>report</strong>. Investors should consider this <strong>report</strong> as only a single factor in making their investment decision.<br />
Please see analyst certifications, important disclosure information, and information regarding the status of non-US analysts on pages 88 to 92 of this <strong>report</strong>.
Healthcare<br />
Rating | Target | Estimate Change<br />
May 28, 2013<br />
Executive Summary<br />
We have made significant changes to our ratings, Price Targets and order of preference<br />
across our coverage universe to reflect what we think will be the most important drivers<br />
of share price performance for the Large Cap Pharmaceuticals sector. We have intensified<br />
our focus on dividend yield as a relative and absolute driver of stock performance as well<br />
as integrating a thorough review of restructuring potential across our universe into our<br />
valuation methodology.<br />
Changes to our recommendations, Price Targets and order of preference are summarized<br />
in Exhibit 1 and Exhibit 2, with the most significant being:<br />
• Novartis is now our Top Pick due to the greatest total upside available versus<br />
current prices as well as having the most restructuring potential over the next<br />
12-18 months in our view,<br />
• Abbott has been moved to 3 rd place from 7 th previously and is now our Top US<br />
Pick as we anticipate a positive inflection in revenue and earnings growth from<br />
H2’13 as the Established Pharmaceuticals business performance improves.<br />
Abbott also has significant further restructuring potential in our view, which is<br />
not well recognized by the market,<br />
• We have Upgraded Bayer to Buy from Hold to reflect the positive momentum in<br />
the Pharmaceuticals and CropScience divisions as well as some of the most<br />
significant upside potential from restructuring, which we believe could be<br />
crystallized over the next 12-24 months,<br />
• We have upgraded Merck & Co. to Buy from Hold as management clearly<br />
begins to recognize pressure from shareholders for better returns by the<br />
activation of an accelerated share repurchase program. We believe that further<br />
pressure over the next 12-18 months will lead to some restructuring of the<br />
business with Consumer and Animal Health being the most likely assets that<br />
could be sold or spun out,<br />
• We have upgraded Eli Lilly to Hold from Underperform as, even though it has<br />
been the worst performing US Large Cap Pharmaceuticals stock year to date, we<br />
do not see enough downside over the next 3-6 months to justify an<br />
Underperform rating. Furthermore we believe that the 2013E dividend yield of<br />
3.6% yield will protect it to a degree for now. We also see positive headline risk<br />
from ramucirumab in breast cancer over the summer, though we believe that<br />
the detailed data expected to be presented at the San Antonio Breast Cancer<br />
Symposium in December will show that the product is unlikely to gain approval<br />
in this indication. Eli Lilly remains our least preferred stock within the entire<br />
Large Cap Pharmaceuticals group,<br />
• Roche and Bristol-Myers have both dropped 3 places (Roche to 7 th , Bristol-Myers<br />
to 9 th ) as recent outperformance of the shares has reduced the upside potential<br />
relative to other stocks based on our current target prices.<br />
page 2 of 92<br />
Jeffrey Holford, PhD, ACA, Equity Analyst, (212) 336-7409, jholford@jefferies.com<br />
Please see important disclosure information on pages 88 - 92 of this <strong>report</strong>.
Healthcare<br />
Rating | Target | Estimate Change<br />
May 28, 2013<br />
Exhibit 1: Global Pharmaceuticals coverage and order of preference<br />
Rank Prior Company Rating Positive attributes Negative attributes<br />
1 2 Novartis Buy Data (QVA149; Tasigna, Afinitor, Farydak, AIN457; Dovitinib);<br />
QVA149/ Relaxin EU reg decisions; Restructuring; Glivec patent<br />
2 1 Sanofi Buy Data (U300, otamixiban, iniparib, PCSK9, JAK-2, sarilumab,<br />
Lyxumia); Lemtrada reg. decision; Aubagio launch; Tresiba delay<br />
<br />
3 7 Abbott Buy Nutrition divison growth; Product cross-registrations in EPD;<br />
MitraClip/ ABSORB and Xpedition regulatory approvals/ launches<br />
4 3 AbbVie Buy Data (ABT-199, veliparib, Elagolix, GLPG0634, Hep C portfolio); +ve<br />
Humira revisions<br />
<br />
5 9 Bayer Buy Data (Nexavar, tedizolid, Eylea); Eylea/ regorafenib/ Xarelto/<br />
alpharadin/ Lemtrada/ Riociguat reg. decisions and launches<br />
Lucentis/ Gilenya/ Afinitor competition; Generics (US Diovan<br />
Sep'12); OTC manufacturing; DPPIV safety<br />
Generics (Plavix May'12/ Eloxatin Aug'12); Lantus competition/<br />
biosimilars; Lantus-Lixi delay; GLP-1 safety; EM/ AH growth<br />
European pricing pressure in EPD; MD pricing/ volume pressures<br />
Competitive data in Hep C; Xeljanz launch; AndroGel generics;<br />
Biosimilars<br />
Betaseron/ Nexavar/ Kogenate/ Xarelto competitive threats; YAZ<br />
litigation; Tough comps in CropScience; MaterialScience margins<br />
6 5 Zoetis Buy N. America drought resolution; Margin expansion Avian Flu; Pfizer share exchange offer<br />
<br />
<br />
<br />
<br />
<br />
<br />
<br />
<br />
7 4 Roche Buy Data (GA101, crenezumab, anti-PD-L1; ABT-199); Perjeta/ TDM-1/<br />
Erivedge launches/ reg decisions; Capital allocation changes<br />
8 11 Merck & Co. Buy Data (preladenant; anti-PD1;MK-7009; MK-5172; V419; V503);<br />
suvorexant reg. decision; yield support; share repurchases<br />
9 6 Bristol-Myers Buy Data (HCV portfolio, anti-PD1, Yervoy prostate, Onglyza [SAVOR]);<br />
Forxiga US reg. decision; Eliquis launch<br />
10 8 Pfizer Buy Data (Dacomitinib, pablociclib, Prevnar-13, Eliquis, tofacitinib);<br />
Restructuring/ Buybacks; Eliquis/ Xeljanz launches<br />
11 10 Johnson &<br />
Johnson<br />
Source: <strong>Jefferies</strong> research<br />
Hold<br />
Data (TMC 435, canagliflozin, Ibrutinib, ACC-001); Restructuring<br />
(OCD); Buy backs; Pharma Review; Xarelto reg. decisions<br />
12<br />
13<br />
13<br />
14<br />
GlaxoSmithKline<br />
AstraZeneca<br />
Hold<br />
Hold<br />
Data (albiglutide, migalastat, MAGE 3, Arzerra, darapladib); Tykerb/<br />
BRAF/ MEK/ Relvar/ Dolutegravir/ ANORO reg decisions;<br />
Restructuring<br />
Data (fostamatinib, olaparib, selumetinib, lesinurad, phase II<br />
portfolio); Yield support; Forxiga US refiling & reg decision<br />
14 12 Novo Nordisk Hold Data (Victoza obesity, LArFVIII, NN8828); Turoctocog alpha reg.<br />
decisions; Ex-US Tresiba launch<br />
= 15 15 Eli Lilly Hold Data (dulaglutide, empagliflozin, insulins, baricitinib, Edivoxetine,<br />
ramucirumab, Enzastaurin, necitumumab)<br />
Lucentis/ Pegasys/ Zelboraf/ Actemra competition; Biosimilars;<br />
Diabetes Care pricing, reimbursement<br />
Januvia growth; Generics (Singulair Aug'12); Odanacatib safety;<br />
DPPIV safety<br />
Generics (Plavix May'12); anti-PD-1 competitors; DPPIV/ GLP-1<br />
safety; DPPIV market slowdown; High PE multiple<br />
CAPiTA downside risk to Prevnar-13; Patent expiry drag<br />
MD pricing/ volume pressures; Consumer manufacturing; Zytiga/<br />
Xarelto/ Remicade competition; DPPIV safety<br />
Advair generic approvals timing visibility (EU); European/ US<br />
pricing pressure; GLP-1 safety<br />
Crestor/ Seroquel XR substitution; Pulmicort generics; DPPIV/ GLP-<br />
1 safety<br />
Tresiba/ Ryzodeg regulatory delays (US); GLP-1 competition/<br />
biosimilars/ safety; Prandin generics; Index reweighting<br />
Alimta challenge; Insulin share losses; High PE multiple; Cashflow;<br />
R&D setbacks (sola, tabalumab, basal insulin); DPPIV/ GLP-1 safety<br />
Exhibit 2: Summary of Global Pharmaceuticals coverage and recommendations<br />
Company Ticker Rating MV MV Price Target Up/down Dividend Total Revenue EPS PEG<br />
L.C. $m 24-May-13 price side Yield Return CAGR CAGR 12A-17E<br />
L.C. L.C. 2013E (%) 12A-17E 12A-17E 2013 PE<br />
Abbott ABT BUY $59,372m $59,372 $37.76 $46 21.8% 1.5% 23.3% 8.4% 19.0% 0.96<br />
AbbVie* ABBV BUY $72,340m $72,340 $45.44 $54 18.8% 3.5% 22.4% 5.9% *14.4% *1.01<br />
AstraZeneca AZN LN HOLD £44,641m $67,582 3428p 3700p 7.9% 5.4% 13.3% -4.0% -6.9% NA<br />
Bayer BAYN GR BUY €69,906m $90,391 €84.54 €98 15.9% 2.3% 18.2% 4.9% 12.2% 1.21<br />
Bristol-Myers BMY BUY $80,016m $80,016 $47.40 $53.5 12.9% 3.0% 15.8% 3.5% 9.9% 2.62<br />
Eli Lilly LLY HOLD $62,824m $62,824 $54.14 $49 -9.5% 3.6% -5.9% -0.4% -3.6% NA<br />
GlaxoSmithKline GSK LN HOLD £88,315m $133,699 1750p 1900p 8.6% 4.5% 13.1% 5.1% 10.3% 1.44<br />
Johnson & Johnson JNJ HOLD $238,328m $238,328 $86.82 $97 11.7% 3.0% 14.7% 3.9% 6.8% 2.33<br />
Merck & Co. MRK BUY $143,555m $143,555 $47.16 $54 14.5% 3.7% 18.2% 0.0% 3.5% 3.91<br />
Novartis NOVN VX BUY CHF172,332m $179,363 CHF71.25 CHF88 23.5% 3.3% 26.8% 3.3% 7.3% 1.99<br />
Novo Nordisk NOVOB DC HOLD DKK538,767m $93,476 DKK967.50 DKK1050 8.5% 2.3% 10.8% 6.9% 13.6% 1.51<br />
Pfizer PFE BUY $218,919m $218,919 $29.04 $33 13.6% 3.3% 17.0% 0.2% 3.8% 3.42<br />
Roche ROG VX BUY CHF214,522m $223,274 CHF253.10 CHF285 12.6% 3.1% 15.7% 4.0% 9.2% 1.89<br />
Sanofi SAN FP BUY €112,781m $145,831 €84.51 €100 18.3% 3.3% 21.6% 5.0% 11.3% 1.34<br />
Zoetis ZTS BUY $16,897m $16,897 $33.46 $40 19.5% 0.8% 20.3% 6.0% 17.7% 1.32<br />
Pan Euro Sector (wtd) $933,617 3.4% 4.0% 8.9% 1.52<br />
US Sector (wtd) $892,252 3.1% 2.5% 6.7% 2.50<br />
EU+US Average (wtd) $1,825,870 3.3% 3.3% 7.8% 2.00<br />
*Note: ABBV EPS CAGR and PEG based on 2013E-17E<br />
Source: Thomson One DataStream, <strong>Jefferies</strong> estimates<br />
page 3 of 92<br />
Jeffrey Holford, PhD, ACA, Equity Analyst, (212) 336-7409, jholford@jefferies.com<br />
Please see important disclosure information on pages 88 - 92 of this <strong>report</strong>.
Dividend Yield<br />
2014E P/E<br />
Healthcare<br />
Jan-09<br />
Apr-09<br />
Jul-09<br />
Oct-09<br />
Jan-10<br />
Apr-10<br />
Jul-10<br />
Oct-10<br />
Jan-11<br />
Apr-11<br />
Jul-11<br />
Oct-11<br />
Jan-12<br />
Apr-12<br />
Jul-12<br />
Oct-12<br />
Jan-13<br />
Apr-13<br />
2014E P/E<br />
US Pharma Dividend Yield Spread<br />
Jan-09<br />
Apr-09<br />
Jul-09<br />
Oct-09<br />
Jan-10<br />
Apr-10<br />
Jul-10<br />
Oct-10<br />
Jan-11<br />
Apr-11<br />
Jul-11<br />
Oct-11<br />
Jan-12<br />
Apr-12<br />
Jul-12<br />
Oct-12<br />
Jan-13<br />
Apr-13<br />
Rating | Target | Estimate Change<br />
May 28, 2013<br />
Absolute yield trade still on, but relative trade<br />
drying up<br />
We have previously made the observation that there appeared to be a stronger than usual<br />
influence of dividend yield against the performance of our Large Cap Pharmaceuticals<br />
universe and little correlation of P/E multiples against future growth over the past few<br />
years (Exhibit 3 and Exhibit 4).<br />
Exhibit 3: 2014E P/E versus 2012A-17E EPS CAGR for US<br />
Large Cap Pharmaceuticals universe<br />
LLY<br />
24X<br />
20X<br />
16X<br />
12X<br />
8X<br />
4X<br />
MRK<br />
PFE<br />
JNJ<br />
0X<br />
-5.0% 0.0% 5.0% 10.0% 15.0% 20.0%<br />
2012E-2017E EPS CAGR<br />
Source: DataStream, <strong>Jefferies</strong> research<br />
BMY<br />
ABBV<br />
Exhibit 4: 2014E P/E versus 2012A-17E EPS CAGR for<br />
European Large Cap Pharmaceuticals universe<br />
AZN<br />
20X<br />
16X<br />
12X<br />
8X<br />
4X<br />
0X<br />
-10.0% -5.0% 0.0% 5.0% 10.0% 15.0%<br />
2012E-2017E EPS CAGR<br />
Source: DataStream, <strong>Jefferies</strong> research<br />
NOVN<br />
ROG<br />
GSK<br />
SAN<br />
NOVOB<br />
BAYN<br />
This trend had helped us to be positive towards the sector overall given the well covered<br />
attractive yields available for many of the names that we cover. However, as dividend<br />
yields (particularly across the US names, which are less influenced in terms of relative<br />
performance by local market moves and FX) have coalesced, the ‚easy money‛ trades<br />
based on yield alone, such as AbbVie, have mostly disappeared.<br />
Exhibit 5: 2013E Dividend yield over time for US Large Cap<br />
Pharmaceuticals universe<br />
7.5%<br />
7.0%<br />
6.5%<br />
6.0%<br />
5.5%<br />
5.0%<br />
4.5%<br />
4.0%<br />
3.5%<br />
3.0%<br />
2.5%<br />
Exhibit 6: Dividend yield spread (Highest vs. lowest) for US<br />
Pharmaceuticals universe from January 2009<br />
350bps<br />
300bps<br />
250bps<br />
200bps<br />
150bps<br />
100bps<br />
50bps<br />
0bps<br />
ABBV BMY JNJ LLY MRK PFE<br />
Source: DataStream, <strong>Jefferies</strong> research<br />
Source: DataStream, <strong>Jefferies</strong> research<br />
page 4 of 92<br />
Jeffrey Holford, PhD, ACA, Equity Analyst, (212) 336-7409, jholford@jefferies.com<br />
Please see important disclosure information on pages 88 - 92 of this <strong>report</strong>.
Dividend Yield<br />
Dividend Yield<br />
Healthcare<br />
EU Pharma Div Yield Spread<br />
Rating | Target | Estimate Change<br />
May 28, 2013<br />
Whilst this trend has been less pervasive in the European names due to the influence of FX<br />
movements and other local market factors, we have seen it become more apparent over<br />
the last 12 months (Exhibit 7 and Exhibit 8).<br />
Exhibit 7: 2013E Dividend yield over time for European<br />
Large Cap Pharmaceuticals Universe<br />
8.0%<br />
7.0%<br />
6.0%<br />
5.0%<br />
4.0%<br />
3.0%<br />
2.0%<br />
1.0%<br />
Exhibit 8: Dividend yield spread (Highest vs. lowest) for<br />
European Pharmaceuticals universe from May 2012<br />
500bps<br />
450bps<br />
400bps<br />
350bps<br />
300bps<br />
250bps<br />
200bps<br />
150bps<br />
100bps<br />
50bps<br />
0bps<br />
AZN GSK NOVN NOVOB<br />
SAN ROG BAYN<br />
Source: DataStream, <strong>Jefferies</strong> research<br />
Source: DataStream, <strong>Jefferies</strong> research<br />
As a result we now expect performance to once again be more linked to earnings growth<br />
(as a driver of future yield) as well as other factors that could help stocks to ‚break out‛<br />
from their peer groups on yield, such as major R&D breakthroughs, corporate<br />
restructuring, M&A and other shareholder friendly actions.<br />
Whilst we already closely monitor future drivers of dividend growth and yield for our<br />
coverage universe (Exhibit 9 and Exhibit 10) and potential restructuring opportunities, we<br />
have not previously formally reviewed the latter across our entire coverage universe in<br />
detail.<br />
Exhibit 9: Dividend yield estimates for US Large Cap Pharmaceuticals, 2012A-17E<br />
8%<br />
6%<br />
4%<br />
2%<br />
0%<br />
ABT ABBV BMY JNJ LLY MRK PFE ZTS<br />
2012A 2013E 2014E 2015E 2016E 2017E<br />
Source: <strong>Jefferies</strong> estimates, Thomson One DataStream<br />
page 5 of 92<br />
Jeffrey Holford, PhD, ACA, Equity Analyst, (212) 336-7409, jholford@jefferies.com<br />
Please see important disclosure information on pages 88 - 92 of this <strong>report</strong>.
Dividend Yield<br />
Healthcare<br />
US$ (billions)<br />
Growth rate<br />
Rating | Target | Estimate Change<br />
May 28, 2013<br />
Exhibit 10: Dividend yield estimates for European Large Cap Pharmaceuticals, 2012A-17E<br />
8%<br />
6%<br />
4%<br />
2%<br />
0%<br />
AZN BAYN GSK NOVN NOVO ROG SAN<br />
2012A 2013E 2014E 2015E 2016E 2017E<br />
Source: <strong>Jefferies</strong> estimates, Thomson One DataStream<br />
Restructuring is the new diversification<br />
As the industry began to see the 2012 patent cliff forming ahead during the last decade<br />
there was a strong push towards diversification used to justify bolt-on acquisitions as well<br />
as mega-mergers. With the patent cliff now mostly in the ‚rear view mirror‛ for the sector<br />
(Exhibit 11), management teams now appear to be once again focused on maximizing<br />
the potential of their ‚Core‛ Pharmaceuticals divisions.<br />
Exhibit 11: Consolidated Core Pharmaceuticals Revenue Growth, 2007A-17E<br />
450<br />
400<br />
350<br />
300<br />
250<br />
200<br />
150<br />
100<br />
50<br />
0<br />
8%<br />
6%<br />
4%<br />
2%<br />
0%<br />
-2%<br />
-4%<br />
-6%<br />
Pharma Revenues<br />
Pharma Revenue Growth<br />
Source: <strong>Jefferies</strong> estimates, company data<br />
Recent examples would include the spin-off of Mead Johnson (MJN, $84.44, NC) by<br />
Bristol-Myers, the disposal of Nutrition assets and spin-off of Zoetis by Pfizer and the spinoff<br />
of AbbVie from Abbott. All three of these were ultimately well received by the market<br />
as it appears that the sum of the parts was greater than the whole in all cases.<br />
page 6 of 92<br />
Jeffrey Holford, PhD, ACA, Equity Analyst, (212) 336-7409, jholford@jefferies.com<br />
Please see important disclosure information on pages 88 - 92 of this <strong>report</strong>.
Healthcare<br />
Rating | Target | Estimate Change<br />
May 28, 2013<br />
Hunting for the next restructuring investment opportunities<br />
Seeking out the next most likely Large Cap Pharmaceuticals restructuring opportunities<br />
for investors would seem to be a worthwhile pursuit given the rising interest and<br />
valuations in the sector. Weeding out the first few companies that are unlikely contenders<br />
is relatively straightforward as they are those that have little or no diversification to their<br />
business.<br />
Exhibit 12 shows how our universe looks in terms of revenue diversification across the<br />
group, with AbbVie, Bristol-Myers, AstraZeneca, Novo Nordisk and Zoetis being the least<br />
diversified companies and hence the least likely to be able to perform any kind of valueenhancing<br />
restructuring.<br />
Exhibit 12: 2014E revenue diversification as a percentage of Group revenues by key operating segments<br />
100%<br />
90%<br />
80%<br />
70%<br />
60%<br />
50%<br />
40%<br />
30%<br />
20%<br />
10%<br />
0%<br />
Core Pharma Est. Pharma Vaccines Consumer Generics<br />
Diagnostics Devices Nutrition Animal Health Specialty Chemicals<br />
Cropscience Opthalmology Biosimilars<br />
Source: <strong>Jefferies</strong> research<br />
page 7 of 92<br />
Jeffrey Holford, PhD, ACA, Equity Analyst, (212) 336-7409, jholford@jefferies.com<br />
Please see important disclosure information on pages 88 - 92 of this <strong>report</strong>.
Healthcare<br />
Rating | Target | Estimate Change<br />
May 28, 2013<br />
Spin Doctors - Who, When, How and<br />
How Much?<br />
The main focus of this <strong>report</strong> has been to review the remainder of our coverage list in<br />
detail for the best restructuring plays, given that we believe this will become an increasing<br />
industry trend. We have based our conclusions as to which companies might be the most<br />
attractive in this regard based on our sum of the parts (SOTP) analyses as well as recent<br />
management commentary regarding this specific issue as well as our own intuition, based<br />
on our experience of covering the broad US and European Large Cap Pharmaceuticals<br />
group.<br />
We have summarized our view on which companies have restructuring potential in<br />
Exhibit 13.<br />
Exhibit 13: Summary of JEF expectations for potential restructuring opportunities within Large Cap Pharmaceuticals<br />
Company Management Support* Separation Candidates Likelihood Accretion/ Potential JEF Price Mean Group SOTP vs.<br />
Dilution** Timing Target SOTP Valuation Stock Price<br />
Abbott Has historically performed spin-outs Nutrition/ Established Pharma; High<br />
16.4% 2015 $46 $48 27%<br />
Diagnostics;<br />
High<br />
1.5% 2015<br />
Medical Devices<br />
High<br />
-0.9% 2015<br />
Bayer<br />
Eli Lilly<br />
Glaxo<br />
SmithKline<br />
Johnson &<br />
Johnson<br />
Merck & Co.<br />
Novartis<br />
Pfizer<br />
Roche<br />
Sanofi<br />
Has indicated MaterialScience spin-out<br />
could be used to fund Healthcare<br />
acquisitions<br />
MaterialScience;<br />
Healthcare/ CropScience<br />
Has commented that it is not infavour of Animal Health;<br />
separation of the Animal Health business, Core Pharma<br />
but could be forced to consider it if the R&D<br />
pipeline misses expectations<br />
Has indicated potential to separate<br />
Established Pharma and ViiV<br />
Has indicated OCD will likely be separated;<br />
has not previously supported large scale<br />
break up<br />
Has previously indicated some interest in<br />
exploring strategic options for Consumer<br />
Health, but less so for Animal Health<br />
Established Pharma;<br />
ViiV;<br />
Consumer Health<br />
Ortho Clinical Diagnostics;<br />
Consumer Health<br />
Consumer Health;<br />
Animal Health;<br />
Vaccines<br />
Management has indicated Roche stake is Roche Bearer shares;<br />
for sale at the right premium and it will Vaccines;<br />
conduct a portfolio review over the next 24- OTC Consumer;<br />
36 months<br />
Animal Health;<br />
Diagnostics<br />
Management has inidicated it is considering Animal Health;<br />
separating Established Products over the Established Products;<br />
next 3 years<br />
Consumer Health<br />
Management has commented that it does<br />
not support separation of Diagnostics from<br />
the Group<br />
Management has stated that it is reviewing<br />
strategic options for Established<br />
Pharmaceutical tail products<br />
*Note – refers to JEF interpretation of management commentary on specific restructuring opportunities<br />
**Note – based on assuming cash proceeds are used to repurchase shares at the current market valuation<br />
Source: <strong>Jefferies</strong> research<br />
High<br />
High<br />
Low<br />
Low<br />
High<br />
High<br />
Low<br />
High<br />
Low<br />
Medium<br />
Medium<br />
Low<br />
High<br />
High<br />
Medium<br />
Medium<br />
Low<br />
High<br />
Medium<br />
Low<br />
1.8%<br />
37.6%<br />
2.9%<br />
-11.6%<br />
-0.4%<br />
1.3%<br />
8.4%<br />
0.1%<br />
9.5%<br />
2.5%<br />
3.4%<br />
2.4%<br />
4.3%<br />
3.3%<br />
4.8%<br />
1.6%<br />
-0.2%<br />
1.2%<br />
-2.0%<br />
2.4%<br />
2014<br />
2014<br />
NA<br />
NA<br />
2015<br />
2015<br />
NA<br />
2013<br />
NA<br />
2014<br />
2014<br />
NA<br />
2013<br />
2014<br />
2015<br />
2015<br />
NA<br />
2013<br />
2016<br />
NA<br />
€ 98 € 115 36%<br />
$49 $48 -11%<br />
1,900p 1,817p 4%<br />
$97 $91 5%<br />
$54 $54 15%<br />
CHF 88 CHF 85 19%<br />
$33 $32 10%<br />
Diagnostics Low -1.7% NA CHF 285 CHF 280 11%<br />
Established Pharma;<br />
Animal Health;<br />
Consumer Health<br />
Medium<br />
Low<br />
Low<br />
-0.1%<br />
3.1%<br />
5.1%<br />
2015<br />
NA<br />
NA<br />
€ 100 € 102 21%<br />
page 8 of 92<br />
Jeffrey Holford, PhD, ACA, Equity Analyst, (212) 336-7409, jholford@jefferies.com<br />
Please see important disclosure information on pages 88 - 92 of this <strong>report</strong>.
Healthcare<br />
Rating | Target | Estimate Change<br />
May 28, 2013<br />
Best Restructuring Plays – ABT, BAYN, MRK, NOVN<br />
We see Abbott, Bayer, Merck & Co. and Novartis as the best restructuring plays within the<br />
Large Cap Pharmaceuticals universe when considering both the likelihood of any action as<br />
well as the ultimate level of upside versus the current share price that could be generated<br />
by such activities.<br />
Abbott - Significant restructuring potential that could surprise investors<br />
Abbott management has one of the industry’s strongest pedigrees when it comes to M&A<br />
and restructuring, in our view. Over the next two years we expect that management will<br />
execute their plan of strong top line growth through geographic expansion, new product<br />
launches and bolt-on acquisitions whilst laying the foundation for the next major<br />
restructuring of the group, which still contains four separate and distinct segments in<br />
Nutrition, Pharmaceuticals, Medical Devices and Diagnostics. In our view this will likely be<br />
followed by further break-up of the group, potentially into three pieces.<br />
We believe that Nutrition and Established Pharmaceuticals will likely be separated into a<br />
single company by 2015. We would then expect that the Medical Devices and Diagnostics<br />
businesses would be sold to other players or spun out around the same timeline as these<br />
industry segments likely consolidate in the future.<br />
Our mean sum of the parts valuation for Abbott is $47.81 per share versus the current<br />
price of $37.76 and our official Target Price of $46.<br />
Bayer – Upgrade to Buy as we wait for the inevitable separation of<br />
MaterialScience<br />
Even though MaterialScience now only represents circa 15% of EBITDA we believe that it<br />
still drags on the Group’s multiple due to its volatility and recent margin weakness.<br />
Management has clearly positioned it to one side, highlighting the synergies between<br />
Healthcare and CropScience and stating that MaterialScience could be used to fund<br />
further acquisitions in Healthcare if a suitably large opportunity came up.<br />
We are increasingly optimistic about the future prospects for the Pharmaceuticals division<br />
due the strong flow of new products and improving R&D productivity evident within the<br />
business. We now see a 5% revenue CAGR and 12% EPS CAGR for the business between<br />
2012A-17E, which are some of the highest growth rates in the group.<br />
As the future growth profile of the Pharmaceuticals business becomes increasingly<br />
attractive, we believe that the pressure to isolate it from the MaterialScience business will<br />
increase to realize the best overall valuation. Whilst we only see marginal accretion from<br />
theoretically monetizing MaterialScience and using the proceeds for share repurchases,<br />
we see significant upside to the valuation of the Pharmaceuticals and Healthcare business<br />
by separating them from it.<br />
The various sum of the parts valuation methodologies used by us provide a valuation<br />
range of €112 to €118 per share, with a mean valuation of €115 per share. This<br />
represents a mean of 36% upside and a maximum of 40% upside, relative to the current<br />
share price of €84.46. Our current target price based on valuing the 2014E earnings at a<br />
30% to 35% P/E premium relative to the German market is €98.<br />
Bayer currently trades on a 19% P/E premium to the German market based on 2014E EPS,<br />
which we believe does not give <strong>full</strong> credit to its above average growth profile. As a result<br />
of our increasing enthusiasm for Bayer’s Pharmaceuticals business, significant<br />
restructuring potential and attractive valuation we have upgraded the shares to Buy from<br />
Hold.<br />
page 9 of 92<br />
Jeffrey Holford, PhD, ACA, Equity Analyst, (212) 336-7409, jholford@jefferies.com<br />
Please see important disclosure information on pages 88 - 92 of this <strong>report</strong>.
Healthcare<br />
Rating | Target | Estimate Change<br />
May 28, 2013<br />
Merck & Co. – Upgrade to Buy as mounting shareholder pressure will likely<br />
lead to restructuring<br />
Merck & Co. faces multiple challenges including several patent expiries over the next few<br />
years, a worrying decline in the growth of the DPP-IV class (including Januvia), safety<br />
concerns on the incretin class (which includes DPP-IVs and GLP-1s) and poor R&D<br />
productivity. Whilst management has taken action to address these issues, including<br />
announcing significant additional share repurchases at the Q1’13 results as well as the<br />
appointment of a new head of R&D, these actions do not <strong>full</strong>y address the significant midterm<br />
issues that face the company.<br />
The success of Pfizer’s and Abbott’s recent corporate reorganizations has only added to<br />
the pressure on Merck & Co.’s management to respond to a lackluster share price<br />
performance versus its peers to make more significant changes to its strategy. We suspect<br />
that as the DPP-IV market likely undergoes a further slow down and the company appears<br />
to fall further behind in R&D that shareholders will demand the separation of one or two<br />
of the non-core businesses, which we believe could include Animal Health and Consumer<br />
Health. We estimate that the separation of these businesses and use of cash proceeds to<br />
fund further share repurchases would be circa 6% accretive to 2014E EPS and potentially<br />
focus the market towards a sum of the parts based valuation of the business, which by<br />
our estimates could drive up to 15% upside versus the current valuation. Furthermore,<br />
Merck & Co. continues to have one of the most attractive yields in the US Large Cap<br />
Pharmaceuticals universe at 3.7% versus the sector average of 3.3%.<br />
Our mean sum of the parts valuation for Merck & Co. is $54.30 per share versus the<br />
current price of $47.16 and our official Target Price of $54. Based on our valuation and<br />
belief that pressure to increase returns to shareholders will lead to divestments we have<br />
raised our PT to $54 from $48 and raised our rating to Buy from Hold.<br />
Novartis – Strong evidence of multiple divestments in place<br />
We have focused on Novartis as a restructuring play since September 2012, after which<br />
time we have seen Daniel Vasella step down as Chairman as well as management talk<br />
about the potential sales of the Roche Bearer share stake at valuations in excess of the<br />
current market value as well as the potential for a strategic review of the current portfolio.<br />
We continue to believe that there is a high probability of a disposal of the Roche stake in<br />
either H2’13 or 2014 followed by the divestment of the Vaccines business in 2014 with<br />
Merck & Co., Pfizer and Johnson & Johnson being the most logical potential acquirers.<br />
We then also see a decent probability that this could be followed by the disposal of the<br />
OTC Consumer and Animal Health businesses from 2015, by which time margins and<br />
revenue growth should be restored to normal after the recent manufacturing issues.<br />
Our mean sum of the parts valuation for Novartis is CHF84.59 per share versus the current<br />
price of CHF71.25 and our official Target Price of CHF88.<br />
page 10 of 92<br />
Jeffrey Holford, PhD, ACA, Equity Analyst, (212) 336-7409, jholford@jefferies.com<br />
Please see important disclosure information on pages 88 - 92 of this <strong>report</strong>.
Healthcare<br />
Rating | Target | Estimate Change<br />
May 28, 2013<br />
Potential Opportunities – GSK, JNJ, PFE<br />
Whilst we see a high likelihood that GlaxoSmithKline and Pfizer will undergo some form of<br />
further restructuring over the next few years, we do not see these potential events as<br />
investment opportunities given our sum of the parts valuations versus the current stock<br />
prices. Johnson & Johnson may also complete some asset disposals, such as OCD over the<br />
next year or so, though the more significant upside from a disposal of its Consumer unit is<br />
much less likely to occur in our view.<br />
GlaxoSmithKline – Restructuring lacks appeal on valuation<br />
GlaxoSmithKline has been active in divesting non-core businesses in the recent past (e.g.<br />
Australian brands, non-Core OTC brands) and has signaled that further divestments are in<br />
process (Lucozade and Ribena brands), as well as recently discussing potential future<br />
options for the newly formed Global Established Products portfolio and ViiV joint venture.<br />
We have been impressed with management's willingness to consider major restructuring<br />
of the business, which was a positive surprise when it was announced at the Q1’13<br />
results. However, we struggle to see how the separation of this business on its own can<br />
generate shareholder value as it would likely trade or be priced at a discount to the<br />
current Group multiple in our view. Our mean sum of the parts valuation for<br />
GlaxoSmithKline is 1,817p per share versus the current price of 1,749p and our official<br />
Target Price of 1,900p. Therefore, even though we see potential restructuring at<br />
GlaxoSmithKline as being highly likely over the next few years, we have maintained our<br />
Hold recommendation on the shares.<br />
Johnson & Johnson – Small moves on restructuring raise hopes of bigger<br />
things to come<br />
Management has repeatedly stated its commitment to remaining a diversified healthcare<br />
conglomerate with its Pharmaceuticals, Medical Devices & Diagnostics and Consumer<br />
units being core businesses within that strategy. However, a change in leadership last year<br />
and the recent announcement that the Ortho Clinical Diagnostic (OCD) business could be<br />
sold or spun out at the Q1’13 results may have raised market expectations for more<br />
significant changes within the Group structure.<br />
Aside from the separation of OCD business, which we see as being neutral in terms of its<br />
impact on earnings accretion/ dilution, the only other major piece we envisage being a<br />
potential disposal candidate is the Consumer Health business. Valued by us at circa $51bn<br />
we see it as a potential spin out candidate that would be circa 9% accretive to earnings if<br />
the proceeds were used to fund share repurchases. Our mean sum of the parts valuation<br />
for Johnson & Johnson is $91.38 per share versus the current price of $86.82 and our<br />
official Target Price of $97.<br />
Pfizer – The restructuring teaser turns into a saga<br />
Pfizer has been one of the most proactive companies in the sector within the last few<br />
years in terms of driving shareholder value through financial engineering and<br />
restructuring. With the Nutrition disposal success<strong>full</strong>y completed and Zoetis likely to be<br />
<strong>full</strong>y divested through a share exchange offer during June, investors have been hungry for<br />
more news of a potential break up of the Pharmaceuticals business into separate<br />
‚Innovative Core‛ and ‚Value Core‛ pieces, the latter of which likely has a weaker growth<br />
profile, but pays a decent dividend.<br />
However, as management significantly pushed back timing expectations on this potential<br />
transaction to 2016 at the earliest at the Q1’13 earnings call, and many questions remain<br />
unanswered as to how such a separation could actually work in practice, there is little<br />
upside for shareholders from this in the near term at least, it seems. Such a business<br />
separation could even destroy value given that the ‚Established Products‛ piece would<br />
page 11 of 92<br />
Jeffrey Holford, PhD, ACA, Equity Analyst, (212) 336-7409, jholford@jefferies.com<br />
Please see important disclosure information on pages 88 - 92 of this <strong>report</strong>.
Healthcare<br />
Rating | Target | Estimate Change<br />
May 28, 2013<br />
likely trade at a discount to the Group unless it paid a hefty dividend, which may be<br />
unsustainable in the mid- to long-term.<br />
We have also considered the potential value implications of the completion of the Zoetis<br />
share exchange offer in this <strong>report</strong>, which appears to only be 1.1% accretive to 2014E EPS<br />
as well as the potential divestment of the Consumer Health business, which we calculate<br />
would drive 2.4% EPS accretion if the proceeds were used to repurchase shares.<br />
Our mean sum of the parts valuation for Pfizer is $31.87 per share versus the current price<br />
of $29.04 and our official Target Price of $33.<br />
Least Likely - LLY, SAN, ROG<br />
Other companies that could consider restructuring include Eli Lilly, Sanofi, and Roche, in<br />
our view. However, each of these appears very unlikely for the reasons described here.<br />
Eli Lilly – Animal health could spin out, but only if the pipeline blows up<br />
It is sometimes mooted by investors and stock market commentators that management<br />
could unlock value from the company through a reorganization of the business into its<br />
Core Pharmaceuticals and Animal Health components. However, our analysis shows that<br />
this is unlikely to be the case unless the stock undergoes a significant decline in value<br />
given that the Animal Health business would be unlikely to trade at a significant premium<br />
to the current Group multiple. Furthermore the Core Pharmaceuticals business might<br />
struggle to maintain the current level of dividend if separated from the cash flow<br />
generating Animal Health business.<br />
We estimate that the Core Pharma business would have a valuation of circa $44.5bn if it<br />
existed as a separate entity today, whilst the Animal Health businesses could be spun out<br />
or sold for circa $8.0bn. On this basis our mean sum of the parts valuation for Eli Lilly is<br />
$48.29 per share versus the current price of $54.14 and our Target Price of $49.<br />
We have upgraded Eli Lilly to Hold from Underperform as, even though it has been the<br />
worst performing US Large Cap Pharmaceuticals stock year to date, we do not see<br />
enough downside over the next 3-6 months to justify an Underperform rating.<br />
Furthermore we believe that the 2013E dividend yield of 3.6% will protect it to a degree<br />
for now. We also see positive headline risk from ramucirumab in breast cancer over the<br />
summer, though we believe that the detailed data expected to be presented at the San<br />
Antonio Breast Cancer Symposium in December will show that the product is unlikely to<br />
gain approval in this indication. Eli Lilly remains our least preferred stock within the entire<br />
Large Cap Pharmaceuticals group.<br />
Sanofi – Diversification has worked well at Sanofi so no need to change it<br />
With Sanofi set to return to sustained double-digit earnings growth from Q4’13, we see<br />
little pressure for management to embark on re-structuring or disposals beyond perhaps<br />
Western European Established Products. Each of the non-pharmaceutical divisions are key<br />
parts of management’s growth strategy, being identified growth drivers which form part<br />
of the company’s long-term guidance. In addition, none of the non-pharmaceuticals<br />
divisions are sub-scale. There remains the possibility for specific disposals, such as the<br />
Animal Health, Consumer Health, Vaccines, Generics or Established Pharmaceuticals<br />
segments.<br />
We see Animal Health and the Vaccines businesses as being assets which are set to<br />
perform well, with comparable margins to Core Pharmaceuticals business. In addition the<br />
Vaccines business is too large and well-integrated with the Pharmaceuticals business to be<br />
considered as a spin-off. With sub-Group estimated EBITDA margins and growth, Generics<br />
and Consumer Health business units may be seen as viable divestment options. However<br />
both divisions remain integral to management’s strategy for diversified growth. Sanofi<br />
page 12 of 92<br />
Jeffrey Holford, PhD, ACA, Equity Analyst, (212) 336-7409, jholford@jefferies.com<br />
Please see important disclosure information on pages 88 - 92 of this <strong>report</strong>.
Healthcare<br />
Rating | Target | Estimate Change<br />
May 28, 2013<br />
management has recently commented about exploring options with Western European<br />
tail products. This follows Pfizer’s and GlaxoSmithKline’s moves to separately <strong>report</strong> tail<br />
products in Established Products business units and talk openly about potential<br />
divestment options in the future. However, valuation of such a business and the<br />
practicalities of separation make this unlikely any time soon.<br />
Our sum of the parts valuation for Sanofi is €102 per share, a c21% premium to the<br />
current share price, though very much in line with the €100 Price Target we already place<br />
on the business on the basis of remaining a diversified healthcare conglomerate.<br />
Roche – Few real options for restructuring; more likely to buy and build<br />
Roche consists of two main divisions, Pharmaceuticals and Diagnostics, between which<br />
the actual level of synergy is frequently debated in financial markets. The diagnostics<br />
division could theoretically exist as a stand-alone entity. However, the drive towards<br />
personalized medicine and the continuing growth in the use of companion diagnostics to<br />
correctly target novel treatments, which in turn helps raise their success rate, firmly links<br />
the Diagnostics division with the Core Pharma business in the eyes of management.<br />
Recent press speculation that Roche might also look to sell off the Diabetes Care unit<br />
seems unlikely for a number of reasons. Roche is already the leading global player in<br />
Diabetes care, accounting for almost a third of the market. Whilst a potential buyer might<br />
want to merge this business into its own operations and strip cost out, it would only be<br />
feasible for other major players, which would likely run into anti-trust issues.<br />
We believe that separating the Diagnostics division from the rest of the business would<br />
actually be dilutive to shareholders as it would be unlikely to achieve the group multiple<br />
as a standalone entity. For this reason, as well as management’s general aversion to any<br />
kind of restructuring we believe that separation of the Diagnostics division is highly<br />
unlikely. Instead we believe that Roche is more likely to add further businesses to both its<br />
Pharmaceuticals and Diagnostics divisions. We see AbbVie as a logical ‚bolt-on‛ to the<br />
Pharmaceuticals division to create another major business outside of oncology, whilst<br />
management also appear to be actively pursuing various strategies to add additional<br />
sequencing platforms to the Diagnostics division.<br />
Our mean sum of the parts valuation of circa CHF280 for Roche represents potential<br />
upside of circa 11%, versus the current share price of CHF253.10. Our current Target Price<br />
based on valuing 2014E earnings at a 25% to 30% P/E relative premium to the Swiss<br />
market is CHF285.<br />
ABBV, BMY and ZTS remain potential consolidation<br />
targets; AZN remains “in limbo”<br />
As already discussed, AbbVie, AstraZeneca, Bristol-Myers and Zoetis are not considered to<br />
be restructuring candidates by us due to their sole focus on Pharmaceuticals or Animal<br />
Health products in the case of Zoetis. However, several of these companies are potential<br />
acquisition targets in our view because of this focus, which could lead them to be viewed<br />
as large ‚bolt-on‛ transactions, particularly in the cases of AbbVie, Bristol-Myers and<br />
Zoetis.<br />
AbbVie – Looks like a prime consolidation target for Roche, maybe Novartis<br />
and Novo Nordisk too<br />
We believe that AbbVie presents an attractive consolidation target due to the focus of the<br />
business on Humira. This would make it an exceptionally easy company to integrate<br />
versus other large cap acquisitions due to the relative lack of complexity in its product<br />
mix, manufacturing and marketing infrastructure. Furthermore the dominance of Humira<br />
page 13 of 92<br />
Jeffrey Holford, PhD, ACA, Equity Analyst, (212) 336-7409, jholford@jefferies.com<br />
Please see important disclosure information on pages 88 - 92 of this <strong>report</strong>.
Healthcare<br />
Rating | Target | Estimate Change<br />
May 28, 2013<br />
on AbbVie’s earnings would be significantly diluted if acquired by another larger<br />
Pharmaceuticals company.<br />
Roche makes the most sense to us as a strategic acquirer of AbbVie given its need to<br />
diversify away from oncology in the long run, its focus on protein manufacturing, strong<br />
hepatitis C platform and low financing costs. However, we also see Novartis and Novo<br />
Nordisk as potential candidates to acquire AbbVie.<br />
AstraZeneca – Looks unattractive as a consolidation target; needs to fix R&D<br />
We believe that AstraZeneca is likely to be left on the sidelines as far as any industry<br />
consolidation over the next year or so is concerned due to an extended patent cliff<br />
through to 2017. A strong dividend yield of 5.4% should support the shares in the<br />
meantime as it progresses its internal R&D pipeline as well as potentially adds further<br />
assets via bolt on acquisitions.<br />
Bristol-Myers – Chances of a take-out from Pfizer diminishing as valuation<br />
soars<br />
We have previously stated that Bristol-Myers would make an excellent strategic fit for<br />
Pfizer given their collaboration on Eliquis and Bristol-Myers strong internal R&D efforts in<br />
cancer. Since that time the valuation of Bristol-Myers has risen substantially and may now<br />
be too expensive for Pfizer to justify an acquisition. Or it could be that PD-1 and Yervoy<br />
will be such attractive assets that Pfizer ultimately pays more than we previously expected<br />
to gain access to some of the most attractive products in the Pharmaceuticals industry.<br />
Zoetis – Likely acquisition target once the tax implications disappear in 2015<br />
We continue to believe that Zoetis remains an attractive acquisition target for other<br />
healthcare conglomerates without a significant presence in Animal Health such as<br />
GlaxoSmithKline and Johnson & Johnson. However, we believe that the negative tax<br />
implications of acquiring Zoetis prior to 2015 will keep any potential M&A interest on the<br />
sidelines.<br />
page 14 of 92<br />
Jeffrey Holford, PhD, ACA, Equity Analyst, (212) 336-7409, jholford@jefferies.com<br />
Please see important disclosure information on pages 88 - 92 of this <strong>report</strong>.
Healthcare<br />
EBITDA margin (2014E)<br />
Rating | Target | Estimate Change<br />
May 28, 2013<br />
Abbott (Buy; PT $46)<br />
Well positioned, but the best is yet to come<br />
Abbott management has one of the industry’s strongest pedigrees when it comes to M&A<br />
and restructuring in our view, boasting possibly one of the best acquisitions ever in the<br />
Pharmaceuticals industry (Knoll Pharma in 2001) as well as the successful spin-outs of<br />
Hospira (HSP, $35.18, NC) in 2003 and AbbVie as recently as January 2013. Whilst the<br />
‚stump‛ business at Abbott still appears well positioned for future growth even without<br />
AbbVie, we believe that the next few years are likely to see further value creation for<br />
shareholders through significant restructuring.<br />
Over the next two years we expect that management will execute their plan of strong top<br />
line growth through geographic expansion, new product launches and bolt-on<br />
acquisitions whilst laying the foundation for the next major restructuring of the group,<br />
which still contains four separate and distinct segments in Nutrition, Pharmaceuticals,<br />
Medical Devices and Diagnostics. In our view this will likely be followed by further break<br />
up of the group, potentially into three pieces.<br />
Three is better than one – 27% better in the case of Abbott<br />
We believe that Nutrition and Established Pharmaceuticals will likely be separated into a<br />
single company once the majority of the planned aggressive margin expansion inside<br />
Nutrition is completed by 2015. This will likely be complemented by a significant inflexion<br />
in revenue and operating profit growth within Established Pharmaceuticals as likely<br />
hundreds of products are cross-licensed into new geographic markets as a result of the<br />
Solvay and Piramal acquisitions. We would then expect that the Medical Devices and<br />
Diagnostics businesses would be sold to other players or spun out around the same<br />
timeline as these industry segments likely consolidate in the future.<br />
We estimate that the combined Nutrition/ Established Pharmaceuticals business would<br />
have a market capitalization of circa $44.7bn if it existed as a separate entity today, whilst<br />
the Medical Devices and Diagnostics businesses could be sold for circa $14.1bn and<br />
$12.5bn respectively each. On this basis our mean sum of the parts valuation for Abbott is<br />
$47.81 per share versus the current price of $37.76 and our official Target Price of $46.<br />
Exhibit 14: 2014E EBITDA margin versus growth (2014E-17E) by division<br />
35%<br />
30%<br />
25%<br />
20%<br />
15%<br />
Medical Devices<br />
$1,497m<br />
Diagnostics<br />
$1,185m<br />
Est. Pharma<br />
$1,684m<br />
Nutrition<br />
$1,871m<br />
10%<br />
5%<br />
0%<br />
0% 5% 10% 15% 20%<br />
EBITDA CAGR (2014E-2017E)<br />
Source: <strong>Jefferies</strong> estimates, company data<br />
page 15 of 92<br />
Jeffrey Holford, PhD, ACA, Equity Analyst, (212) 336-7409, jholford@jefferies.com<br />
Please see important disclosure information on pages 88 - 92 of this <strong>report</strong>.
Healthcare<br />
Rating | Target | Estimate Change<br />
May 28, 2013<br />
Exhibit 15, Exhibit 16, and Exhibit 17 give a snapshot of our estimates for 2014E revenues,<br />
EBITDA and EPS split across the four main business segments, which we have used as the<br />
basis for our sum of the parts calculations.<br />
Exhibit 15: Estimated 2014E revenue<br />
contribution split ($m)<br />
Exhibit 16: Estimated 2014E EBITDA<br />
contribution split ($m)<br />
Exhibit 17: Estimated 2014E EPS<br />
contribution split ($ per share)<br />
Est. Pharma<br />
$5,928m<br />
Nutrition<br />
$7,874m<br />
Est. Pharma<br />
$1,684m<br />
Nutrition<br />
$1,871m<br />
Est. Pharma<br />
$0.70<br />
Nutrition<br />
$0.78<br />
Medical<br />
Devices<br />
$6,027m<br />
Diagnostics<br />
$5,038m<br />
Medical<br />
Devices<br />
$1,497m<br />
Diagnostics<br />
$1,185m<br />
Medical<br />
Devices<br />
$0.62<br />
Diagnostics<br />
$0.49<br />
Source: <strong>Jefferies</strong> estimates<br />
Source: <strong>Jefferies</strong> estimates<br />
Source: <strong>Jefferies</strong> estimates<br />
Nutrition/ Established Pharma make a nice combo with a juicy valuation of<br />
circa $44.7bn<br />
The broad geographic reach of the Nutrition and Established Pharmaceuticals businesses<br />
with their focus on Emerging Markets in particular make them a perfect combination as a<br />
stand alone business in our view. Whilst Abbott does not give detailed margin<br />
information for each individual segment of the business, we estimate that the Nutrition<br />
and Established Pharmaceuticals businesses are the two most profitable in the group from<br />
both an EBITDA and EPS perspective (Exhibit 16 and Exhibit 17). We also estimate that<br />
they are the highest growth opportunities within the group as well (Exhibit 14).<br />
We expect that management will separate these assets from the remainder of the group<br />
once Nutrition has completed the majority of the ongoing restructuring, implemented to<br />
achieve an operating margin target of >20% by 2015 from the lowly historic margins of<br />
13% back in 2011. During the same time we expect that the Established Pharmaceuticals<br />
business will enter a new rapid phase of growth and margin expansion as significant<br />
revenue synergies are achieved through the cross-registration and launches of products<br />
from the Solvay and Piramal acquisitions.<br />
We have separately valued each of these assets at $27.6bn for Nutrition (c3.5x sales;<br />
c14.8x EBITDA; c22.9x earnings) and $17.1bn for Established Pharmaceuticals (c2.9x<br />
sales; c10.2x EBITDA; c15.7x earnings), which we calculate is c$7.3bn or 16% higher than<br />
their combined implied valuation within the current Abbott stock price.<br />
Medical Devices likely to end up as a consolidation target worth $14.1bn<br />
We would expect that the Medical Devices and Diagnostics units would likely end up as<br />
consolidation targets or further spin-offs in the event that Nutrition and Established<br />
Pharma are separated from the group. The Medical Devices business could be a good<br />
consolidation play for companies looking to broaden their offering to hospitals to try to<br />
offset the dominant force of Johnson & Johnson in the sector.<br />
We would expect that such an asset would fetch at least $14.1bn (c2.3x sales; c9.4x<br />
EBITDA; c14.6x earnings) in this instance. Whilst this is not a particularly attractive<br />
valuation versus the current group P/E multiple of 14.8x, it would be less than 1% dilutive<br />
by our estimates and by far offset by the gains from separating Nutrition and Established<br />
Pharma.<br />
page 16 of 92<br />
Jeffrey Holford, PhD, ACA, Equity Analyst, (212) 336-7409, jholford@jefferies.com<br />
Please see important disclosure information on pages 88 - 92 of this <strong>report</strong>.
Valuation/ Share<br />
Healthcare<br />
Rating | Target | Estimate Change<br />
May 28, 2013<br />
Diagnostics most likely to be spun out into a $12.5bn market cap entity<br />
We see few strategic partners for Abbott’s diagnostics business and the most logical way<br />
to separate it from the Nutrition and Established Pharma businesses may be through an<br />
IPO. On this basis we would expect it to achieve a market capitalisation of circa $12.5bn<br />
(2.5x sales; c10.6x EBITDA; c16.4x earnings), which would equate to c1.5% accretion<br />
versus its implied valuation within the group as it stands today.<br />
SOTP Valuations yield c27% upside<br />
Assuming that a ‚real-world‛ sum of the parts for Abbott is achieved by separating the<br />
business into three entities as described, we estimate that the group is worth circa $47.81<br />
per share, a c27% premium to the current share price. We have summarised the various<br />
SOTP valuations for Abbott in this section in Exhibit 18 alongside our more conventional<br />
P/E relative valuation for the shares of $46 (based on 25-30% 2014E P/E premium to the<br />
US market).<br />
Exhibit 18: Summary of share price evaluation by different valuation<br />
methodologies ($ per share)<br />
$60<br />
$50<br />
$46.00<br />
$48.86<br />
$47.48 $47.09<br />
$40<br />
$30<br />
$20<br />
$10<br />
$0<br />
PE REL EV/Sales EV/EBITDA P/E multiple<br />
Source: <strong>Jefferies</strong> estimates<br />
The individual SOTP valuations based on EV/Sales, EV/EBITDA and P/E multiples are<br />
included in this <strong>report</strong> in Exhibit 20, Exhibit 21 and Exhibit 22. Exhibit 19 summarises<br />
these as well as providing a comparison of how the average of these valuations for each<br />
business unit compares to their valuation based on our estimate of earnings on the<br />
current group multiple.<br />
Exhibit 19: Summary of share price evaluation by different valuation methodologies ($ per share)<br />
EV/sales EV/EBITDA P/E SOTP Mean<br />
Valuation<br />
Value at Group<br />
Multiple<br />
Multiple<br />
Arbitrage/<br />
share<br />
Nutrition $17.31 $17.62 $17.07 $17.33 $11.53 $5.81<br />
Diagnostics $7.91 $7.81 $7.86 $7.86 $7.30 $0.56<br />
Medical Devices $9.46 $8.46 $8.69 $8.87 $9.22 ($0.35)<br />
Est. Pharma $11.17 $10.57 $10.47 $10.74 $10.37 $0.36<br />
Non-operating income/(expense) NA NA NA NA ($0.68) NA<br />
Net cash/ (debt) - 2012A $3.01 $3.01 $3.01 $3.01 NA NA<br />
Group $48.86 $47.48 $47.09 $47.81 $37.74 $6.38<br />
Source: <strong>Jefferies</strong> estimates<br />
page 17 of 92<br />
Jeffrey Holford, PhD, ACA, Equity Analyst, (212) 336-7409, jholford@jefferies.com<br />
Please see important disclosure information on pages 88 - 92 of this <strong>report</strong>.
Healthcare<br />
Rating | Target | Estimate Change<br />
May 28, 2013<br />
SOTP Valuation Tables<br />
EV/Sales valuation<br />
Our EV/Sales valuation for Abbott yields $48.86 on a sum of the parts basis. This<br />
represents a 29% premium to the current stock price of $37.76.<br />
Exhibit 20: EV/Sales SOTP valuation summary ($m or $ per share where indicated)<br />
Sales<br />
2014E ($m)<br />
% Sales<br />
Contribution<br />
EV/Sales Multiple Implied EV ($m) Valuation per<br />
share ($)<br />
Nutrition $7,874m 32% 3.5x $27,560m $17.31<br />
Diagnostics $5,038m 20% 2.5x $12,594m $7.91<br />
Medical Devices $6,027m 24% 2.5x $15,068m $9.46<br />
Est. Pharma $5,928m 24% 3.0x $17,783m $11.17<br />
Group sales $24,867m 100% $73,006m $45.85<br />
Net cash/ (debt) - 2012A $4,787m $3.01<br />
Avg. shares outstanding (2012A) 1,592<br />
Group EV/Sales (SOTP) valuation $77,793m $48.86<br />
Source: <strong>Jefferies</strong> estimates<br />
EV/EBITDA valuation<br />
Our EV/EBITDA valuation for Abbott yields $47.48 on a sum of the parts basis. This<br />
represents a 26% premium to the current stock price of $37.76.<br />
Exhibit 21: EV/EBITDA SOTP valuation summary ($m or $ per share where indicated)<br />
EBITDA<br />
2014E<br />
($M)<br />
EBITDA<br />
Contribution<br />
2014E<br />
EV/EBITDA<br />
2014<br />
Implied EV ($m)<br />
Valuation per<br />
share ($)<br />
Nutrition $1,871m 30.0% 15.0x $28,062m $17.62<br />
Diagnostics $1,185m 19.0% 10.5x $12,441m $7.81<br />
Medical Devices $1,497m 24.0% 9.0x $13,470m $8.46<br />
Est. Pharma $1,684m 27.0% 10.0x $16,837m $10.57<br />
Total EBITDA $6,236m 100.0% $70,809m $44.47<br />
Net cash/ (debt) - 2012A $4,787m $3.01<br />
Avg. shares outstanding (2012A) 1,592<br />
Group EV/EBITDA (SOTP) Valuation $75,596m $47.48<br />
Source: <strong>Jefferies</strong> estimates<br />
P/E Multiple valuation<br />
Our P/E multiple based valuation for Abbott yields $47.09 on a sum of the parts basis.<br />
This represents a 25% premium to the current stock price of $37.76.<br />
Exhibit 22: P/E SOTP valuation summary ($m or $ per share where indicated)<br />
P/E (SOTP) Summary<br />
Operating<br />
Profit 2014E<br />
Operating<br />
Margin 2014E<br />
Net Income<br />
2014E<br />
Division<br />
EPS<br />
2014E<br />
P/E multiple<br />
Valuation per<br />
share ($)<br />
Nutrition $1,527m 19% $1,208m $0.78 22.0x $17.07<br />
Diagnostics $967m 82% $765m $0.49 16.0x $7.86<br />
Medical Devices $1,221m 82% $966m $0.62 14.0x $8.69<br />
Est. Pharma $1,374m 82% $1,087m $0.70 15.0x $10.47<br />
Non-operating income/(expense) ($90m) ($71m) ($0.05) - NA<br />
Net cash/ (debt) - 2012A $3.01<br />
Total $5,088m 20.5% $3,954m $2.54 18.5x $47.09<br />
Source: <strong>Jefferies</strong> estimates<br />
page 18 of 92<br />
Jeffrey Holford, PhD, ACA, Equity Analyst, (212) 336-7409, jholford@jefferies.com<br />
Please see important disclosure information on pages 88 - 92 of this <strong>report</strong>.
Healthcare<br />
Rating | Target | Estimate Change<br />
May 28, 2013<br />
Bayer (Buy; PT €98)<br />
Restructuring continues to look inevitable<br />
Marijn Dekkers was appointed as CEO at Bayer on 1 st October 2010. He was the first<br />
external appointee to take the top job in the company’s near 150 year history and his<br />
arrival caused much speculation as to the implications of the move. He had previously<br />
been at Thermo Fisher (TMO, $87.22, Buy), where he was known as a deal maker having<br />
transformed the company with numerous acquisitions into the world’s largest laboratory<br />
equipment maker.<br />
As the largest remaining pharmaceuticals/ chemicals conglomerate in Europe,<br />
expectations focused on the likelihood that Bayer could be broken up, with chemicals<br />
disposals likely used to help finance pharmaceutical acquisitions. Management<br />
commentary did not play down the expectations, either. At the time of his appointment<br />
as CEO, Dr Dekkers had suggested he would like to further build up the Pharmaceuticals<br />
unit, noting that Bayer could finance a transaction similar in size to the earlier circa €17bn<br />
Schering AG acquisition. By mid-2011, this had further evolved into a potential ‘merger of<br />
equals’ for the healthcare unit and the observation that there could be three or four<br />
companies that might be good strategic options for Bayer.<br />
Meanwhile on the subject of disposals, at the time of his appointment Dr Dekkers<br />
commented that he wouldn’t consider shedding either of the CropScience,<br />
MaterialScience or Healthcare divisions unless they lost their positions of market<br />
leadership. He noted “We have a leading position in all three areas….we don’t have two<br />
favourite children and a stepchild” (Bloomberg, 28 th Sept 2010).<br />
However, by early 2011 the commentary had progressed with recognition that the<br />
disposal of the MaterialScience division could be used to help finance a larger transaction<br />
in Healthcare. Dr Dekkers was quoted as saying that it would only be sold if “we wanted<br />
to do something so big that we had to use it as currency”. He further clarified that “We’ll<br />
stay with the three strategic groups as long as they are competitive in their particular<br />
areas”(Financial Times, 22 nd Feb 2011).<br />
At the recent Meet Management day at Leverkusen in March 2013, it was increasingly<br />
apparent that the MaterialScience division continues to be positioned apart from the rest<br />
of the company. In his introduction, Dr Dekkers noted, “Another way to depict our business<br />
is along the lines of Life Sciences and MaterialScience..….Life Science is, basically, Healthcare<br />
and CropSciences, which represents human health, animal health and plant health,<br />
representing 70% of revenue, and MaterialScience 30%......when you look at ….adjusted<br />
EBITDA for 2012, Life Science is represented at 85% of EBITDA, and MaterialScience 15%. So,<br />
a significant portion of our financials are driven by our two Life Sciences businesses”.<br />
Whilst the overall commentary seems to point in the direction of an eventual<br />
MaterialScience separation, it also seems the transaction will most likely occur as a<br />
consequence of a larger acquisition within Healthcare. With large healthcare acquisition<br />
opportunities more elusive than ever, there appears to be little immediate urgency.<br />
Moreover, following a difficult couple of quarters it’s likely management may want to see<br />
some clear improvements at MaterialScience to help maximize value before considering<br />
any disposal options.<br />
page 19 of 92<br />
Jeffrey Holford, PhD, ACA, Equity Analyst, (212) 336-7409, jholford@jefferies.com<br />
Please see important disclosure information on pages 88 - 92 of this <strong>report</strong>.
Healthcare<br />
EBITDA margin (2014E)<br />
Rating | Target | Estimate Change<br />
May 28, 2013<br />
Significant restructuring options exist and make sense for shareholders<br />
Exhibit 23 illustrates how the company is dominated by the Pharmaceuticals division,<br />
which has the highest uEBITDA margins and uEBITDA growth expectations, out of all the<br />
divisions. This is closely followed by CropScience.<br />
Exhibit 23: 2012A EBITDA margin versus growth (2014E-17E) by division<br />
50%<br />
45%<br />
40%<br />
35%<br />
30%<br />
25%<br />
20%<br />
15%<br />
Medical Care,<br />
€749<br />
Animal Health,<br />
€457<br />
Consumer Care,<br />
€874<br />
Pharmaceuticals,<br />
€3,789<br />
CropScience,<br />
€2,360<br />
10%<br />
5%<br />
MaterialScience,<br />
€1,331<br />
0%<br />
0% 2% 4% 6% 8% 10%<br />
Source: <strong>Jefferies</strong> estimates, company data<br />
EBITDA CAGR (2014E-2017E)<br />
Whilst Bayer discloses revenues for its three Consumer sub-divisions (Consumer Care,<br />
Medical care and Animal Health) it does not disclose their individual uEBITDA margins.<br />
However, we have been able to make estimates for these based on our knowledge of<br />
other comparable companies. Within the Consumer division, the OTC focused Consumer<br />
Care business is expected to deliver the most robust growth, with Animal Health close<br />
behind reflecting good longer term growth prospects, particularly in emerging markets.<br />
However, Medical Care (which consists of Diabetes care as well as contrast imaging<br />
agents and medical devices) is likely to be a significant drag on the overall Consumer<br />
division growth due to the increasingly challenging conditions within diabetes care.<br />
Increasing competition is being compounded by austerity measures in Europe and CMS<br />
reimbursement cutbacks in the US which are pressuring diabetes care margins and<br />
hampering growth in the short to medium term, despite the attractive longer term<br />
fundamentals of the diabetes market. Outside Medical Care, MaterialScience has the<br />
weakest growth/ uEBITDA margin combination.<br />
Separating both the MaterialScience and the Medical Care operations should leave a<br />
higher growth, higher margin business behind. However, whilst we have already<br />
established that MaterialScience is the most likely candidate for disposal, Bayer appears<br />
more wedded to Medical/Diabetes Care. At the Q1’13 results Wolfgang Plischke<br />
(Chairman of Bayer Healthcare and Member of the Board) said, “….we are committed to<br />
this business…we are doing quite well if you compare this with other competitors…. In<br />
addition….this business is providing quite a significant cashflow for us, which is important for<br />
our overall performance….”.<br />
However, this commitment may be more a function of necessity, than desire. In July 2012,<br />
the Financial Times Deutschland <strong>report</strong>ed ‘sources’ as saying Bayer was in talks to sell its<br />
blood glucose meter business. However, by December 2012 Reuters <strong>report</strong>ed that Sanofi,<br />
the last remaining bidder, had pulled out of a deal that could have been valued at around<br />
$1.5bn.<br />
page 20 of 92<br />
Jeffrey Holford, PhD, ACA, Equity Analyst, (212) 336-7409, jholford@jefferies.com<br />
Please see important disclosure information on pages 88 - 92 of this <strong>report</strong>.
Healthcare<br />
Rating | Target | Estimate Change<br />
May 28, 2013<br />
Exhibit 24: Estimated 2014E revenue<br />
contribution split (€m)<br />
MaterialScience<br />
€ 12,134<br />
Reconciliation,<br />
€ 1,261<br />
Core Pharma,<br />
€ 12,172<br />
Exhibit 25: Estimated 2014E EBITDA<br />
contribution split (€m)<br />
MaterialScience,<br />
€ 1,331<br />
Reconciliation,<br />
-€ 74<br />
Core Pharma,<br />
€ 3,789<br />
Exhibit 26: Estimated 2014E EPS<br />
contribution split (€ per share)<br />
MaterialScience,<br />
€ 0.84<br />
Core Pharma,<br />
€ 2.72<br />
CropScience,<br />
€ 2,360<br />
CropScience,<br />
€ 1.86<br />
Consumer Care,<br />
€ 4,301<br />
CropScience,<br />
€ 9,584<br />
Animal Health,<br />
€ 1,409<br />
Medical Care,<br />
€ 2,628<br />
Animal Health,<br />
€ 458<br />
Medical Care,<br />
€ 749<br />
Consumer Care,<br />
€ 874<br />
Animal Health,<br />
€ 0.36<br />
Medical Care,<br />
€ 0.59<br />
Consumer Care,<br />
€ 0.69<br />
Source: <strong>Jefferies</strong> estimates<br />
Source: <strong>Jefferies</strong> estimates<br />
Source: <strong>Jefferies</strong> estimates<br />
Uncovering Pharma’s hidden value – the conglomerate discount<br />
When considering the summary valuation table (Exhibit 28), the first observation is that<br />
the most significant potential upside would come from <strong>full</strong>y valuing the Core Pharma<br />
division itself, versus the implied group multiple that it currently trades on. We believe<br />
that the Pharmaceuticals division suffers from a significant conglomerate discount due to<br />
the diversified nature of the company and unpredictability of the MaterialScience division.<br />
We conclude that the valuation upside from separating the MaterialScience division goes<br />
far beyond the modest 1.8% earnings accretion that could be achieved by using any<br />
proceeds to repurchase shares. Instead we believe that there is circa 36% valuation upside<br />
to the group on a sum of the parts valuation on the basis that the Healthcare and<br />
CropScience divisions reach <strong>full</strong> valuations when compared to their peers.<br />
We have valued the Core Pharmaceuticals business at €39bn (c3.2x sales; 10.3x EBITDA;<br />
c17.3x earnings). This implies that there is circa €12.06 per share upside available from<br />
<strong>full</strong>y valuing just the Pharmaceuticals division alone and another €11.84 per share from<br />
doing the same with the Consumer division.<br />
Who would be the most likely acquirers?<br />
With Bayer MaterialScience already holding the global number one or two positions in its<br />
major business areas (representing between 20% and 40% market shares), anti-trust<br />
issues would prevent Bayer from selling the business to one of the major competitors. In<br />
this situation, Bayer would either have to find a chemicals company that wanted to enter<br />
this market afresh, sell it off piecemeal (which may destroy some of its value), or consider<br />
floating the business as a stand-alone operation.<br />
Given the current global economic climate and difficult conditions (pricing / raw material<br />
costs) within the industry at present, we would not see this as imminent. However, as<br />
soon as the global economic cycle once again begins to show signs of a sustainable pickup<br />
we would anticipate the demand for and valuation of more cyclical assets to follow<br />
suit. At which point this will start to become a far more attractive proposition.<br />
page 21 of 92<br />
Jeffrey Holford, PhD, ACA, Equity Analyst, (212) 336-7409, jholford@jefferies.com<br />
Please see important disclosure information on pages 88 - 92 of this <strong>report</strong>.
Healthcare<br />
Rating | Target | Estimate Change<br />
May 28, 2013<br />
Consumer Care also a valuable asset<br />
Bayer has not given any indications that it may be willing to dispose of its Consumer Care<br />
business and on that basis we would not expect it to be divested. If anything, Bayer has<br />
been looking to bolster this area. Whilst it was outbid by Reckitt Benkiser (RB LN, 4850p,<br />
Hold) in its attempt to acquire Schiff Nutrition, it has recently announced the bolt-on<br />
acquisition of Steigerwald Arzneimittelwerk GmBH, a privately held pharmacy-only herbal<br />
medicines company, for an undisclosed amount. Nevertheless, as part of our valuation<br />
process we note that disposing of this division could generate valuation upside. The<br />
longer duration nature of these businesses, usually due to high levels of brand<br />
recognition means there are ready buyers for these assets. A list of potential acquirers<br />
could include: GlaxoSmithKline, Merck & Co., Pfizer, Sanofi, Johnson & Johnson, Novartis<br />
and Reckitt Benkiser.<br />
In the event that this division is not disposed of, it should be noted that (just as with the<br />
Core Pharma division), disposing of MaterialScience would potentially remove the<br />
conglomerate discount, allowing the market to attribute a <strong>full</strong>er valuation to this division.<br />
We have valued the Consumer Care operation at up to around €14.2bn (c3.3x sales;<br />
16.3x EBITDA; c25x earnings), representing €8.32 per share of incremental value over the<br />
current share price of €84.46 (Exhibit 28).<br />
Further opportunities remain in Medical Care and Animal Health<br />
Animal Health remains a highly attractive area of the life science market given the strong<br />
fundamentals. Increasing global wealth and affluence, particularly in Emerging Markets is<br />
driving demand for higher protein diets and also leads to increased pet ownership as well<br />
as spend per pet. Bayer is the fifth largest player in the global Animal Health market, with<br />
a similar share to the fourth, sixth and seventh players, Eli Lilly, Boehringer and Novartis,<br />
respectively.<br />
With all the major players, including Bayer, expressing their intent to increase ownership<br />
in this space there is little available to acquire. As a result the best way to create value here<br />
may be to either sell to one of the other players at a significant premium, reflecting the<br />
available synergies, opportunities and scarcity value, or JV the operations with one of the<br />
similar sized competitors. With relatively low exposure to the companion animal market,<br />
either Eli Lilly, Boehringer, Zoetis and Merck & Co. could be ideal partners and a<br />
combination with either should immediately create synergies and further critical mass. We<br />
have valued the Animal Health division at circa €5.5bn (c3.9x sales; 12x EBITDA; c18.4x<br />
earnings), representing €1.99 per share of incremental value over the current share price<br />
(Exhibit 28).<br />
Whilst our valuation work suggests there could be at least another €1.53 per share of<br />
value in Medical Care, releasing value from Medical Care is likely to be more difficult,<br />
particularly given that Bayer already appears to have tried and failed to sell the Diabetes<br />
Care business. Nevertheless, in what is becoming an increasingly difficult market it<br />
remains the case that one way of creating value would be for one player to act as a<br />
consolidator, stripping out duplicate cost.<br />
page 22 of 92<br />
Jeffrey Holford, PhD, ACA, Equity Analyst, (212) 336-7409, jholford@jefferies.com<br />
Please see important disclosure information on pages 88 - 92 of this <strong>report</strong>.
Target Share Price (Euro)<br />
Healthcare<br />
Rating | Target | Estimate Change<br />
May 28, 2013<br />
SOTP Valuations yield 36% upside and support our upgrade to Buy<br />
We have carried out sum of the parts valuations utilising EV/Sales, EV/EBITDA and P/E<br />
calculations. As summarized in Exhibit 27, utilizing ‚real-world‛ valuation multiples, these<br />
different valuation methodologies provide a valuation range of €111.58 to €118.22 per<br />
share, with a mean valuation of €115.23 per share. This represents upside of 36%, relative<br />
to the current share price of €84.46. Our current target price based on valuing the 2014E<br />
earnings at a 30% to 35% P/E premium relative to the German market is €98.<br />
We have Upgraded Bayer to Buy from Hold to reflect the positive momentum in the<br />
Pharmaceuticals and CropScience divisions as well as some of the most significant upside<br />
potential from restructuring, which we believe could be crystallized over the next 12-24<br />
months.<br />
Exhibit 27: Summary of share price evaluation by different valuation<br />
methodologies (€ per share)<br />
€140<br />
€120<br />
€100<br />
€98.00<br />
€118.22 €115.90<br />
€111.58<br />
€80<br />
€60<br />
€40<br />
€20<br />
€0<br />
PE (Market premium/<br />
discount)<br />
EV/Sales (SOTP) EV/EBITDA PE (SOTP)<br />
Source: <strong>Jefferies</strong> estimates<br />
Summary of valuation methodologies<br />
The individual SOTP calculations based on EV/Sales, EV/EBITDA, and P/E multiples are<br />
shown below in Exhibit 29, Exhibit 30 and Exhibit 31. Exhibit 28 provides a summary of<br />
these different methodologies, as well as providing a comparison of how the average of<br />
these valuations for each business unit compares to the valuation based on our estimate<br />
of earnings on the current group multiple.<br />
Exhibit 28: Summary of share price evaluation by different valuation methodologies (€ per share)<br />
Division EV/Sales EV/EBITDA P/E SOTP Mean<br />
Valuation<br />
Value at Group<br />
Multiple<br />
Arbitrage/<br />
Share<br />
Pharmaceuticals €47.10 €48.11 €46.22 €47.15 €35.09 €12.06<br />
Consumer €34.55 €32.60 €31.90 €33.02 €21.17 €11.84<br />
Consumer Care €18.20 €16.90 €16.54 €17.22 €8.89 €8.32<br />
Medical Care €9.53 €9.06 €8.86 €9.15 €7.62 €1.53<br />
Animal Health €6.82 €6.64 €6.50 €6.65 €4.66 €1.99<br />
CropScience €32.45 €31.39 €31.61 €31.82 €23.99 €7.83<br />
MaterialScience €13.21 €12.88 €10.94 €12.34 €10.86 €1.48<br />
Other charges (Interest expense, etc) NA NA NA NA (€6.65) NA<br />
Net Debt - Q1 2013E (€9.09) (€9.09) (€9.09) (€9.09) NA NA<br />
Total €118.22 €115.90 €111.58 €115.23 €84.46 €33.21<br />
Source: <strong>Jefferies</strong> estimates, company data<br />
page 23 of 92<br />
Jeffrey Holford, PhD, ACA, Equity Analyst, (212) 336-7409, jholford@jefferies.com<br />
Please see important disclosure information on pages 88 - 92 of this <strong>report</strong>.
Healthcare<br />
Rating | Target | Estimate Change<br />
May 28, 2013<br />
Based on these valuations, we note that splitting out any of the divisions should generate<br />
varying degrees of accretion to earnings assuming that the cash raised is reinvested in<br />
share buybacks at the current share price and no dis-synergies are created. However, the<br />
single biggest upside is in the Core Pharma division, which highlights the true impact of<br />
the conglomerate discount the company suffers from. Our expectation is that if the lower<br />
growth, lower margin MaterialScience division was sold off, the market would be able to<br />
more accurately value the remaining Healthcare/ Life Sciences businesses at the<br />
appropriate multiple. Although we do not anticipate this happening until an appropriate<br />
Healthcare focussed acquisition target becomes available, our valuation work suggests<br />
that circa €33 per share of value may be created, predominantly from splitting off<br />
MaterialScience.<br />
SOTP Valuation Tables<br />
EV/Sales SOTP<br />
Our EV/Sales valuation for Bayer yields €118.22 on a sum of the parts basis. This<br />
represents c40% upside to the current share price of €84.46.<br />
Exhibit 29: EV/Sales SOTP valuation summary (€m or € per share where indicated)<br />
Division<br />
Sales<br />
2014E (€m)<br />
% Sales<br />
Contribution<br />
EV/Sales<br />
Multiple<br />
Implied value<br />
(€m)<br />
Valuation per<br />
share (€)<br />
Core Pharma €12,172m 28% 3.2x €38,950m €47.10<br />
Consumer €8,338m 19% 3.4x €28,574m €34.55<br />
Consumer Care €4,301m 10% 3.5x €15,053m €18.20<br />
Medical Care €2,628m 6% 3.0x €7,883m €9.53<br />
Animal Health €1,409m 3% 4.0x €5,637m €6.82<br />
CropScience €9,584m 22% 2.8x €26,835m €32.45<br />
MaterialScience €12,134m 28% 0.9x €10,920m €13.21<br />
Reconciliation €1,261m 3% 0.0x €0m €0.00<br />
Group Sales €43,488m 100% 2.4x €105,279m €127.31<br />
Net Debt - Q1 2013E (€7,513m) (€9.09)<br />
Avg. shares outstanding (Q1 2013A) 826.95<br />
Group EV/Sales (SOTP) valuation €97,766m €118.22<br />
Source: <strong>Jefferies</strong> estimates, company data<br />
EV/EBITDA SOTP<br />
Our EV/EBITDA valuation for Bayer yields €115.90 on a sum of the parts basis. This<br />
represents c37% upside to the current share price of €84.46.<br />
Exhibit 30: EV/EBITDA SOTP valuation summary (€m or € per share where indicated)<br />
Division<br />
uEBITDA 2014E<br />
(€m)<br />
uEBITDA<br />
Contribution<br />
2014E<br />
EV/EBITDA<br />
2014E<br />
Implied value<br />
(€m)<br />
Valuation per<br />
share (€)<br />
Core Pharma €3,789m 39.6% 10.5x €39,788m €48.11<br />
Consumer €2,080m 21.8% 13.0x €26,958m €32.60<br />
Consumer Care €874m 9.1% 16.0x €13,978m €16.90<br />
Medical Care €749m 7.8% 10.0x €7,488m €9.06<br />
Animal Health €458m 4.8% 12.0x €5,491m €6.64<br />
CropScience €2,360m 24.7% 11.0x €25,958m €31.39<br />
MaterialScience €1,331m 13.9% 8.0x €10,649m €12.88<br />
Group Total (Ex Reconciliation) €9,560m 100.0%<br />
Reconciliation (€74m) (0.8%)<br />
Group Total €9,487m 99.2% 10.9x €103,352m €124.98<br />
Net Debt - Q1 2013E (€7,513m) (€9.09)<br />
Avg. shares outstanding (Q1 2013A) 826.95<br />
Group EV/EBITDA (SOTP) valuation €95,839m €115.90<br />
Source: <strong>Jefferies</strong> estimates, company data<br />
page 24 of 92<br />
Jeffrey Holford, PhD, ACA, Equity Analyst, (212) 336-7409, jholford@jefferies.com<br />
Please see important disclosure information on pages 88 - 92 of this <strong>report</strong>.
Healthcare<br />
Rating | Target | Estimate Change<br />
May 28, 2013<br />
P/E Multiple valuation<br />
Our P/E multiple based valuation for Bayer yields €111.58 on a sum of the parts basis.<br />
This represents c32% upside to the current share price of €84.46.<br />
Exhibit 31: P/E SOTP valuation summary (€m or € per share where indicated)<br />
P/E (SOTP) Summary<br />
Division<br />
2014E CORE<br />
Adj. Op. Profit<br />
2014E Adj.<br />
Op. Profit<br />
Margin<br />
2014E Net<br />
Income<br />
2014E CORE<br />
EPS<br />
2014E P/E<br />
multiple<br />
2014E<br />
Valuation/<br />
Share (€)<br />
Core Pharma €3,760m 31% €2,249m €2.72 17.0x €46.22<br />
Consumer €2,064m 25% €1,357m €1.64 19.4x €31.90<br />
Consumer Care €867m 20% €570m €0.69 24.0x €16.54<br />
Medical Care €743m 28% €488m €0.59 15.0x €8.86<br />
Animal Health €454m 32% €299m €0.36 18.0x €6.50<br />
CropScience €2,342m 24% €1,537m €1.86 17.0x €31.61<br />
MaterialScience €1,321m 11% €696m €0.84 13.0x €10.94<br />
Other, Non Operating income / (expense) (€426m) (€0.52)<br />
Net Debt - Q1 2013E (€9.09)<br />
Total €9,487m 22% €5,413m €6.55 17.0x €111.58<br />
Source: <strong>Jefferies</strong> estimates, company data<br />
page 25 of 92<br />
Jeffrey Holford, PhD, ACA, Equity Analyst, (212) 336-7409, jholford@jefferies.com<br />
Please see important disclosure information on pages 88 - 92 of this <strong>report</strong>.
Healthcare<br />
Rating | Target | Estimate Change<br />
May 28, 2013<br />
Eli Lilly (Hold; PT $49)<br />
Restructuring option does not compute<br />
Eli Lilly is our least preferred Large Cap Pharmaceuticals stock based on its lofty P/E<br />
multiple, significant exposure to patent expiries and challenges over the next few years,<br />
poor R&D executions and sub-par growth profile. Whilst management has clearly set out<br />
a growth strategy to try to address these issues by increasing R&D productivity and<br />
focusing resources on its more productive Animal Health unit as well as on Japan and<br />
Emerging Markets, the key to its long term success clearly resides with its ability to<br />
generate growth from new Pharmaceutical products.<br />
It can be heavily debated as to whether the current valuation is more driven by pipeline<br />
expectations (there are many key R&D catalysts over the next 12 months) or the dividend<br />
yield, which is in line with its peers at 3.6%. Regardless, the ability to execute the pipeline<br />
will likely act as the key driver of valuation going forwards given that success is required<br />
to sustain the current level of dividend in the future in our view.<br />
It is sometimes mooted by investors and stock market commentators that management<br />
could unlock value from the company through a reorganization of the business into its<br />
Core Pharmaceuticals and Animal Health components. However, our analysis shows that<br />
this is unlikely to be the case unless the stock undergoes a significant decline in value<br />
given that the Animal Health business would be unlikely to trade at a significant premium<br />
to the current Group multiple. Derica Rice, CFO of Eli Lilly, stated at the Q4’12 earnings<br />
call:<br />
“We have no intentions of divesting of our Animal Health business. We have been quite<br />
pleased with it. As you heard earlier, in the fourth quarter, our Animal Health business grew<br />
about 18%; and for the year, it grew about 21%. And, this is a business that we actually<br />
anticipate will double over this period we call YZ; and so, we have gotten great returns from<br />
that business and great benefit to Lilly. We also have received significant synergies between<br />
our Animal Health business, as well as with our human pharma business, both in terms of<br />
innovation. Most of our human -- before testing the humans, we run our molecules through<br />
animal models, and so that's provided a lot of leverage to our Animal Health business. Then,<br />
in addition to that, we also get leverage and synergies through our manufacturing and<br />
corporate overhead base. So, for now, we are pleased with our Animal Health business, and<br />
we see this being a long mainstay, in terms of mix -- our portfolio mix”<br />
We estimate that the Core Pharma business would have a valuation of circa $44.5bn if it<br />
existed as a separate entity today, whilst the Animal Health businesses could be spun out<br />
or sold for circa $8.0bn. On this basis our mean sum of the parts valuation for Eli Lilly is<br />
$48.29 per share versus the current price of $54.14 and our Target Price of $49.<br />
We have upgraded Eli Lilly to Hold from Underperform as, even though it has been the<br />
worst performing US Large Cap Pharmaceuticals stock year to date, we do not see<br />
enough downside over the next 3-6 months to justify an Underperform rating.<br />
Furthermore we believe that the 2013E dividend yield of 3.6% will protect it to a degree<br />
for now. We also see positive headline risk from ramucirumab in breast cancer over the<br />
summer, though we believe that the detailed data expected to be presented at the San<br />
Antonio Breast Cancer Symposium in December will show that the product is unlikely to<br />
gain approval in this indication. Eli Lilly remains our least preferred stock within the entire<br />
Large Cap Pharmaceuticals group.<br />
page 26 of 92<br />
Jeffrey Holford, PhD, ACA, Equity Analyst, (212) 336-7409, jholford@jefferies.com<br />
Please see important disclosure information on pages 88 - 92 of this <strong>report</strong>.
Healthcare<br />
EBITDA margin (2014E)<br />
Rating | Target | Estimate Change<br />
May 28, 2013<br />
Exhibit 32: 2014E EBITDA margin versus growth (2014E-17E) by division<br />
30%<br />
20%<br />
Core Pharma<br />
$4,166m<br />
Animal Health<br />
$515m<br />
10%<br />
0%<br />
-5% 0% 5% 10% 15%<br />
EBITDA CAGR (2014E-2017E)<br />
Source: <strong>Jefferies</strong> estimates, company data<br />
Exhibit 33, Exhibit 34 and Exhibit 35 give a snapshot of our estimates for 2014E revenues,<br />
EBITDA and EPS split across the four main business segments, which we have used as the<br />
basis for our sum of the parts calculations.<br />
Exhibit 33: Estimated 2014E revenue<br />
contribution split ($m)<br />
Animal<br />
Health<br />
$2,304m<br />
Exhibit 34: Estimated 2014E EBITDA<br />
contribution split ($m)<br />
Animal<br />
Health<br />
$515m<br />
Exhibit 35: Estimated 2014E EPS<br />
contribution split ($ per share)<br />
Animal<br />
Health<br />
$0.29<br />
Core<br />
Pharma<br />
$16,826m<br />
Core<br />
Pharma<br />
$4,166m<br />
Core<br />
Pharma<br />
$2.32<br />
Source: <strong>Jefferies</strong> estimates<br />
Source: <strong>Jefferies</strong> estimates<br />
Source: <strong>Jefferies</strong> estimates<br />
Animal Health worth circa $8.0bn as a spin or sale<br />
We would expect that any divestment of the Animal Health business would be achieved<br />
through a trade sale to another industry player, potentially, Zoetis, Bayer, Novartis, Sanofi,<br />
Boehringer and Merck. A spin-out would also be a possibility, though we suspect that a<br />
trade sale would achieve the highest valuation. Sanofi, Bayer and Boehringer would be<br />
the most logical buyers in our view given their lower exposure to medicinal feed<br />
additives.<br />
We would expect that such a transaction would would fetch circa $8.0bn (c3.5x sales;<br />
c15.6x EBITDA; c26.0x earnings) and would be most likely to be executed in 2014 or<br />
beyond if the R&D pipeline were to materially disappoint over the next 12 months. On<br />
this basis, we estimate that a trade sale of Animal Health would be c3% accretive to Lilly if<br />
the net proceeds were used to repurchase its own shares.<br />
page 27 of 92<br />
Jeffrey Holford, PhD, ACA, Equity Analyst, (212) 336-7409, jholford@jefferies.com<br />
Please see important disclosure information on pages 88 - 92 of this <strong>report</strong>.
Valuation/ Share<br />
Healthcare<br />
Rating | Target | Estimate Change<br />
May 28, 2013<br />
SOTP Valuations yield c11% downside<br />
Assuming that Eli Lilly separated its Animal Health business from the rest of the group, we<br />
calculate a mean sum of the parts valuation of $48.29 per share, a c11% discount to the<br />
current share price. We have summarised the various SOTP valuations used for Eli Lilly in<br />
this section in Exhibit 36 alongside our more conventional P/E relative valuation for the<br />
shares (based on assuming a 30-40% 2014E P/E premium to the US market).<br />
Exhibit 36: Summary of share price evaluation by different valuation<br />
methodologies ($ per share)<br />
$60<br />
$50<br />
$40<br />
$49.00<br />
$50.70 $49.69<br />
$44.48<br />
$30<br />
$20<br />
$10<br />
$0<br />
PE REL EV/ sales EV/ EBITDA P/E multiple<br />
Source: <strong>Jefferies</strong> estimates<br />
The individual SOTP valuations based on EV/Sales, EV/EBITDA and P/E multiples are<br />
included in this <strong>report</strong> in Exhibit 38, Exhibit 39 and Exhibit 40.<br />
Exhibit 37 summarises these as well as providing a comparison of how the average of<br />
these valuations for each business unit compares to their valuation based on our estimate<br />
of earnings on the current group multiple.<br />
Exhibit 37: Summary of share price evaluation by different valuation methodologies ($ per share)<br />
EV/sales EV/EBITDA P/E SOTP Mean<br />
Valuation<br />
Value at Group<br />
Multiple<br />
Multiple<br />
Arbitrage/<br />
share<br />
Core Pharma $43.15 $41.97 $37.14 $40.75 $47.04 ($6.29)<br />
Animal Health $7.38 $7.55 $7.17 $7.37 $5.81 $1.55<br />
Non-operating income/ (expense) NA NA NA NA $1.29 NA<br />
Net cash/ (debt) - Q1 2013A $0.17 $0.17 $0.17 $0.17 NA NA<br />
Group $50.70 $49.69 $44.48 $48.29 $54.14 ($4.73)<br />
Source: <strong>Jefferies</strong> estimates<br />
page 28 of 92<br />
Jeffrey Holford, PhD, ACA, Equity Analyst, (212) 336-7409, jholford@jefferies.com<br />
Please see important disclosure information on pages 88 - 92 of this <strong>report</strong>.
Healthcare<br />
Rating | Target | Estimate Change<br />
May 28, 2013<br />
SOTP Valuation Tables<br />
EV/Sales valuation<br />
Our EV/Sales valuation for Eli Lilly yields $50.70 on a sum of the parts basis. This<br />
represents a 6% discount to the current stock price of $54.14.<br />
Exhibit 38: EV/Sales SOTP valuation summary ($m or $ per share where indicated)<br />
Sales<br />
2014E ($m)<br />
% Sales<br />
Contribution<br />
EV/Sales Multiple Implied EV ($m) Valuation per<br />
share ($)<br />
Core Pharma $16,826m 88% 2.8x $47,112m $43.15<br />
Animal Health $2,304m 12% 3.5x $8,063m $7.38<br />
Group Sales $19,129m 100% $55,175m<br />
Net cash/ (debt) - Q1 2013A $185m $0.17<br />
Avg. shares outstanding (Q1 2013A) 1,092<br />
Group EV/Sales (SOTP) valuation $55,360m $50.70<br />
Source: <strong>Jefferies</strong> estimates<br />
EV/EBITDA valuation<br />
Our EV/EBITDA valuation for Eli Lilly yields $49.69 on a sum of the parts basis. This<br />
represents a 8% discount to the current stock price of $54.14.<br />
Exhibit 39: EV/EBITDA SOTP valuation summary ($m or $ per share where indicated)<br />
EBITDA<br />
2014E($m)<br />
EBITDA<br />
Contribution<br />
2014E<br />
EV/EBITDA<br />
2014<br />
Implied EV ($m)<br />
Valuation per<br />
share ($)<br />
Core Pharma $4,166m 89% 11.0x $45,828m $41.97<br />
Animal Health $515m 11% 16.0x $8,239m $7.55<br />
Implied Share price $4,681m $54,066m $49.52<br />
Net cash/ (debt) - Q1 2013A $185m $0.17<br />
Avg. shares outstanding (Q1 2013A) 1,092<br />
Group EV/EBITDA (SOTP) valuation $54,251m $49.69<br />
Source: <strong>Jefferies</strong> estimates<br />
P/E Multiple valuation<br />
Our P/E multiple based valuation for Abbott yields $44.48 on a sum of the parts basis.<br />
This represents a 18% discount to the current stock price of $54.14.<br />
Exhibit 40: P/E SOTP valuation summary ($m or $ per share where indicated)<br />
P/E (SOTP) Summary<br />
Operating<br />
Profit 2014E<br />
Operating<br />
Margin 2014E<br />
Net Income<br />
2014E<br />
Division<br />
EPS<br />
2014E<br />
P/E multiple<br />
Valuation per<br />
share ($)<br />
Core Pharma $3,132m 19% $2,506m $2.32 16.0x $37.14<br />
Animal Health $387m 17% $310m $0.29 25.0x $7.17<br />
Non-operating income/ (expense) $89m $71m $0.07 20.6x NA<br />
Net cash/ (debt) - Q1 2013A $0.17<br />
Total $3,519m 18% $2,887m $2.67 16.6x $44.48<br />
Source: <strong>Jefferies</strong> estimates<br />
page 29 of 92<br />
Jeffrey Holford, PhD, ACA, Equity Analyst, (212) 336-7409, jholford@jefferies.com<br />
Please see important disclosure information on pages 88 - 92 of this <strong>report</strong>.
Healthcare<br />
EBITDA margin (2014E)<br />
Rating | Target | Estimate Change<br />
May 28, 2013<br />
GlaxoSmithKline (Hold; PT 1,900p)<br />
Restructuring already underway<br />
GlaxoSmithKline’s management has been active in divesting non-core businesses in the<br />
recent past (e.g. Australian brands, non-Core OTC brands), has signaled further<br />
divestments are in process (Lucozade and Ribena brands), and discussed potential future<br />
options for the newly formed Global Established Products portfolio and ViiV joint venture.<br />
We have been impressed with management's willingness to consider major restructuring<br />
of the business. Our mean sum of the parts valuation for GlaxoSmithKline is 1,817p per<br />
share versus the current price of 1,749p and our official Target Price of 1,900p.<br />
Global Established Products present potential divestment opportunities<br />
GlaxoSmithKline remains one of the more diversified companies within our coverage<br />
universe with circa 32% of revenues and 25% of its EBITDA being derived from nonpharmaceutical<br />
healthcare operations. We believe management will be under some<br />
pressure/ expectation to maximize shareholder value with Global Established Products<br />
following signaling to the market that all options will be considered for this<br />
underperforming unit. Global Established Products is likely margin dilutive and a drag on<br />
growth by our estimates and could provide significant shareholder value if packaged and<br />
divested in subunits.<br />
We see the Vaccines business as being too large and well-integrated with the Core<br />
Pharma business to be considered as a spin-off. Furthermore the business performs well in<br />
our view with EBITDA margins and growth comparable to that of the Core Pharma<br />
business.<br />
The potential to monetize ViiV is something that management has stated as an option in<br />
the long-run. This would be dependent on the sales trajectory for new product<br />
dolutegravir. With the current marketed products in decline, we would expect further JVs<br />
or in-licensing deals to diversify the business before an IPO, although this may not be<br />
necessary for a trade sale.<br />
Consumer Health has already gone through a cycle of divestments (with Lucozade and<br />
Ribena in process), and is emerging as a growth driver. We would not expect significant<br />
further actions to be taken, though this remains a possibility.<br />
Exhibit 41: 2014E EBITDA margin versus growth (2014E-17E) by division<br />
80%<br />
70%<br />
ViiV, £920m<br />
60%<br />
50%<br />
40%<br />
30%<br />
Global Established<br />
Products, £806m<br />
Vaccines, £1,395m<br />
Core Pharma ,<br />
£5,639m<br />
20%<br />
10%<br />
Consumer Health,<br />
£1,099m<br />
0%<br />
-5% -3% -1% 1% 3% 5% 7% 9% 11%<br />
Source: <strong>Jefferies</strong> estimates<br />
EBITDA CAGR (2014E-2017E)<br />
page 30 of 92<br />
Jeffrey Holford, PhD, ACA, Equity Analyst, (212) 336-7409, jholford@jefferies.com<br />
Please see important disclosure information on pages 88 - 92 of this <strong>report</strong>.
Healthcare<br />
Rating | Target | Estimate Change<br />
May 28, 2013<br />
Exhibit 42, Exhibit 43, Exhibit 44 give a snapshot of our estimates for 2014E revenues,<br />
EBITDA and EPS split across five business segments, which we have used as the basis for<br />
our sum of the parts calculations.<br />
Exhibit 42: Estimated 2014E revenue<br />
contribution split (£m)<br />
Consumer<br />
Health,<br />
£5,745m<br />
ViiV,<br />
£1,431m<br />
Global<br />
Established<br />
Products,<br />
£2,977m<br />
Exhibit 43: Estimated 2014E EBITDA<br />
contribution split (£m)<br />
Consumer<br />
Health,<br />
£1,099m<br />
ViiV,<br />
£920m<br />
Global<br />
Established<br />
Products,<br />
£806m<br />
Exhibit 44: Estimated 2014E EPS<br />
contribution split (p per share)<br />
Consumer<br />
Health,<br />
16p<br />
ViiV, 13p<br />
Global<br />
Established<br />
Products,<br />
11p<br />
Vaccines ,<br />
£3,917m<br />
Core<br />
Pharma ,<br />
£14,583m<br />
Vaccines,<br />
£1,395m<br />
Core<br />
Pharma ,<br />
£5,639m<br />
Vaccines,<br />
20p<br />
Core<br />
Pharma ,<br />
80p<br />
Source: <strong>Jefferies</strong> estimates<br />
Source: <strong>Jefferies</strong> estimates<br />
Source: <strong>Jefferies</strong> estimates<br />
Consumer Health could fetch circa £17.4bn, but seems unlikely following<br />
recent re-alignment with the group strategy<br />
GlaxoSmithKline has been active in divesting non-core OTC brands over the last two<br />
years. In February 2011, management announced its intention to divest its non-core<br />
Consumer Health OTC products to realise value for shareholders and simplify the business<br />
by enabling it to focus on priority brands and markets. Over a 13 month period, this was<br />
achieved through three trade sales split along different geographies. US and Canadian<br />
non-core OTC brands were sold to Prestige Brands Holdings (PBH, $29.09, NC) for<br />
£426m, generating net cash proceeds of approximately £242m. European brands were<br />
sold to Omega Pharma (private) for £391m, generating net cash proceeds of<br />
approximately £310m. International markets brands were sold to Aspen (APN-JSE,<br />
ZAR212, NC) for £164m, generating net cash proceeds of approximately £135m. Total<br />
sales for the OTC brands were approximately £370m in 2011. The total gross cash<br />
proceeds from the divestment of these products were £981m and the net cash proceeds<br />
were approximately £690 million. This implies a sales multiple of 2.7x.<br />
In April 2013, management completed a strategic review of nutritional drinks brands<br />
Lucozade and Ribena and concluded that the growth potential of these brands,<br />
particularly outside the ‘core’ Western markets, could be better leveraged by companies<br />
with existing category presence and infrastructure in these regions. As a result,<br />
GlaxoSmithKline has decided to pursue the divestment of these brands, subject to the<br />
realisation of appropriate value for shareholders. Management has referred to these<br />
brands as being UK or European centric, and lacking a link with the Group strategy or<br />
Pharmaceuticals business.<br />
GlaxoSmithKline has not <strong>report</strong>ed <strong>full</strong> year Lucozade and Ribena sales since 2009, at<br />
which point the brands generated combined sales of £536m. If this was put on a 2.7x<br />
sales multiple (similar to what was achieved for the non-core OTC brands), it would imply<br />
a valuation of £1.45bn. Given the nature of these brands, the 2014E EV/Sales multiple<br />
may be in the range of those for Coca-Cola (KO, $42.24, NC) or Pepsi Co (PEP, $82.58,<br />
NC), which are c4.1x and c2.1x respectively.<br />
page 31 of 92<br />
Jeffrey Holford, PhD, ACA, Equity Analyst, (212) 336-7409, jholford@jefferies.com<br />
Please see important disclosure information on pages 88 - 92 of this <strong>report</strong>.
Healthcare<br />
Rating | Target | Estimate Change<br />
May 28, 2013<br />
The opportunity for further divestments of individual underperforming or non-core<br />
Consumer Health brands may be limited after the Lucozade and Ribena disposal and 2012<br />
non-core OTC disposals (which eliminated over 100 brands).<br />
We would not expect a wholesale divestment for GlaxoSmithKline’s Consumer Health<br />
business. Following the recent and planned divestments, the remaining business appears<br />
to be in-line with management strategy for the Group. While European Pharmaceutical<br />
growth has been a drag on Group growth, we expect the European Consumer Health<br />
business to perform well following the divestments, with this segment being accretive to<br />
the Group’s growth rate moving forward (12A-17E sales CAGR of 7% versus 5% for the<br />
Group).<br />
Based on our mean valuation across the SOTP methodologies (Exhibit 46) of 354p, we<br />
would expect any trade sale of Consumer Health to generate c.£17.4bn. This would<br />
represent a 2014E sales multiple of 3.0x, EBITDA multiple of 15.8x, and P/E Multiple of<br />
22.9x.<br />
IPO route seems logical for ViiV, but not for a number of years<br />
ViiV is a joint venture between GlaxoSmithKline (76.5% shareholding), Pfizer (13.5%) and<br />
Shionogi & Co (10%, 4507 JP, ¥2,094, Buy). We expect ViiV to return to sales growth<br />
from 2014E driven by the launch of integrase inhibitor dolutegravir for HIV. We would<br />
expect GlaxoSmithKline will wait for several years for the sales growth trajectory of<br />
dolutegravir and its combination/ reformulations programs to be determined before any<br />
re-structuring or divestment action is taken. At the Q1’13 results call, Andrew Witty (CEO)<br />
commented:<br />
“ViiV, of course, is moving into potentially a very interesting growth phase with the potential<br />
approval of dolutegravir later in the year. And as a consequence, our view of that business<br />
will be very largely dictated by what we believe to be the medium-term growth prospects, not<br />
just from dolutegravir, but also from the follow-on programs, and particularly, the longacting<br />
programs, which are looking very exciting, actually……….I think the ViiV business<br />
judgments we need to let some water flow under the bridge around what the real growth<br />
profile of that will be over the next few years.”<br />
With many of the base business products in ViiV already in decline, we would expect<br />
further JVs or in-licensing deals to diversify the business before an IPO, although this may<br />
not be necessary for a trade sale. Based on our mean valuation across the SOTP<br />
methodologies (Exhibit 46) of 195p, we would expect any IPO or trade sale of ViiV to<br />
generate c.£9.6bn. This would represent a 2014E sales multiple of 6.7x, EBITDA multiple<br />
of 10.4x, and P/E Multiple of 15.1x.<br />
Global Established Products could generate c.£7bn<br />
During 2013 GlaxoSmithKline plans to create a Global Established Products portfolio of its<br />
pharmaceutical tail products, which is expected to include over 50 brands with annual<br />
sales of around £3bn. The portfolio will be co-ordinated by a distinct team focused on<br />
driving increased efficiencies and value across this portfolio, including in manufacturing,<br />
and better coordination of tendering and procurement opportunities. Sales of these<br />
products will be <strong>report</strong>ed separately from 1 January 2014.<br />
The establishment of this unit is part of a broader strategy to separate GlaxoSmithKline<br />
internally into newly launched products, mature large products, and Global Established<br />
Products. From management commentary at the Q1’13 results, the initial logic behind<br />
this strategy is for resource allocation, both between these segments and within them in<br />
order to maximize internal efficiencies and drive as much value out of each segment.<br />
However, this also creates optionality regarding a potential future divestment of Global<br />
Established Products as described by Andrew Witty below at the Q1’13 results:<br />
page 32 of 92<br />
Jeffrey Holford, PhD, ACA, Equity Analyst, (212) 336-7409, jholford@jefferies.com<br />
Please see important disclosure information on pages 88 - 92 of this <strong>report</strong>.
Healthcare<br />
Rating | Target | Estimate Change<br />
May 28, 2013<br />
“How we choose to execute that optionality remains to be defined, but I would expect that<br />
you will start to see the focus that we are making on this portfolio -- I think you should expect<br />
to start to see some things happen as a consequence of that relatively sooner than later. But,<br />
whether or not we go all the way into something like a ViiV-type structure; and then, whether<br />
we went all the way to some sort of flotation, I think, is an unanswered question. But, I am<br />
very happy to have the option opened up as a consequence of this decision.”<br />
A wholesale divestment of this unit may be difficult because of its diversity of brands and<br />
geographies. We would expect any divestments to be on a piecemeal basis, such as<br />
individual brands, therapy areas, or geographies. The type of acquirer may depend on the<br />
size, constituent and geography of the unit, but could include local Speciality<br />
Pharmaceuticals or Large-cap Pharmaceuticals players. At the Q1’13 results, Andrew Witty<br />
commented:<br />
“In terms of the established products business, there are buyers out there. Whether there are<br />
buyers out there for a single block like this is a different question, but there will be buyers and<br />
there are buyers out there for elements of it. One of the interesting questions for the people<br />
who are going to be focusing on this is, are there elements of this business which would be<br />
better on the outside of the Company than the inside?<br />
And, I think I would encourage you to think not just that this is now -- because we've called<br />
out as a block, that all actions, going forward, will only apply to the block. It may very well<br />
be that the focus we are giving to the block reveals that there are sub-segments where we<br />
want to do something different from other sub-segments, and I would just encourage you to<br />
think that way.”<br />
GlaxoSmithKline has been down this route in the recent past with the £172m divestment<br />
of Australian pharmaceutical ‘tail’ products to Aspen (a South African company with a<br />
large Southern Hemisphere presence) in August 2012 (£121m net of transaction fees and<br />
tax). These brands generated £83 million in 2011 and approximately £31 million in<br />
H1’12, suggesting sales multiples of 2.1x and 2.8x (assuming annual 2012 sales of<br />
£62m), respectively. As with the newly formed division as a whole, these Australian tail<br />
products have gradually declined over recent years due to local market price reductions<br />
and generic competition.<br />
It is also possible that Global Established Products could be used in a Joint Venture with<br />
other Large Cap Pharmaceutical companies seeking to maximise efficiencies (for example,<br />
Merck & Co., Sanofi, Pfizer, Novartis), as suggested by Andrew Witty at the Q1’13 results:<br />
“This type of business is extremely amenable to ViiV-type structures, rather than necessarily<br />
straight disposal-type structures. And, you could imagine that different companies will have<br />
broadly similar goals of trying to drive efficiencies and synergies through these sorts of tail<br />
businesses. So, it may be that those sorts of options have more legs on them than, again, a<br />
huge big-block sale.”<br />
Based on our mean valuation across the SOTP methodologies (Exhibit 46) of 145p, we<br />
would expect any trade sale of Global Established Products to generate c£7.1bn. This<br />
would represent a 2014E sales multiple of 2.4x, EBITDA multiple of 8.9x, and P/E Multiple<br />
of 12.8x.<br />
page 33 of 92<br />
Jeffrey Holford, PhD, ACA, Equity Analyst, (212) 336-7409, jholford@jefferies.com<br />
Please see important disclosure information on pages 88 - 92 of this <strong>report</strong>.
Target Share Price (GBPp)<br />
Healthcare<br />
Rating | Target | Estimate Change<br />
May 28, 2013<br />
SOTP Valuation yields c4% upside<br />
Assuming that a ‚real-world‛ sum of the parts for GlaxoSmithKline is achieved by<br />
divesting Consumer Health, ViiV and Global Established Products via IPOs or trade sales,<br />
we estimate that the group is worth circa 1,817p per share, a c4% premium to the current<br />
share price of 1,749p. We have summarised the various SOTP valuations for<br />
GlaxoSmithKline in this section in Exhibit 45 alongside our more conventional P/E relative<br />
valuation for the shares (based on 25-30% 2014E P/E premium to the UK market).<br />
Exhibit 45: Summary of share price evaluation by different valuation<br />
methodologies (p per share)<br />
2,000<br />
1,800<br />
1,600<br />
1,400<br />
1,200<br />
1,000<br />
800<br />
600<br />
400<br />
200<br />
0<br />
1,900p 1,875p 1,786p 1,791p<br />
PE (Market<br />
premium/ discount)<br />
EV/EBITDA EV/Sales (SOTP) PE (SOTP)<br />
Source: <strong>Jefferies</strong> estimates<br />
Summary of valuation methodologies<br />
The individual SOTP valuations based on EV/Sales, EV/EBITDA and P/E multiples are<br />
included in this <strong>report</strong> in Exhibit 47, Exhibit 48 and Exhibit 49.<br />
Exhibit 46 summarises these as well as providing a comparison of how the average of<br />
these valuations for each business unit compares to their valuation based on our estimate<br />
of earnings on the current group multiple.<br />
We note that the Consumer Health, Vaccines and ViiV units would all be expected by us to<br />
be value creating if separated from the group assuming minimal dis-synergies and the use<br />
of the proceeds to repurchase shares at the current price. However, we think that there<br />
would be significant dis-synergies in separating the Vaccines business from the group and<br />
it is a very unlikely path for management to go down at this time.<br />
Exhibit 46: Summary of share price evaluation by different valuation methodologies (p per share)<br />
EV/Sales EV/EBITDA P/E SOTP Mean valuation Value at<br />
Group<br />
Multiple<br />
Multiple<br />
Arbitrage/<br />
share<br />
Pharmaceuticals 1,191p 1,353p 1,252p 1,265p 1,216p 50p<br />
Global Established Products 152p 148p 137p 145p 152p (7p)<br />
Core Pharma 1,039p 1,205p 1,116p 1,120p 1,064p 57p<br />
Vaccines 319p 312p 315p 316p 263p 52p<br />
Consumer Health 386p 336p 342p 354p 207p 147p<br />
ViiV 204p 187p 195p 195p 173p 22p<br />
Other charges (Interest expense, etc.) NA NA NA NA (110p) NA<br />
Net cash/ (debt) - Q1'2013 (314p) (314p) (314p) (314p) NA NA<br />
Group 1,786p 1,875p 1,791p 1,817p 1,749p 271p<br />
Source: <strong>Jefferies</strong> estimates, company data<br />
page 34 of 92<br />
Jeffrey Holford, PhD, ACA, Equity Analyst, (212) 336-7409, jholford@jefferies.com<br />
Please see important disclosure information on pages 88 - 92 of this <strong>report</strong>.
Healthcare<br />
Rating | Target | Estimate Change<br />
May 28, 2013<br />
SOTP Valuation Tables<br />
EV/Sales<br />
Our EV/Sales valuation for GlaxoSmithKline yields 1,786p on a sum of the parts basis. This<br />
represents a 2% premium to the current stock price of 1,749p.<br />
Exhibit 47: EV/Sales SOTP valuation summary (£m or p per share where indicated)<br />
Sales 2014E (£m)<br />
% Sales<br />
Contribution<br />
EV/Sales Multiple<br />
Implied value<br />
(£m)<br />
Implied Share<br />
Price (p)<br />
Pharmaceuticals £17,561m 61% 3.3x £58,485m 1,191p<br />
Global Established Products £2,977m 10% 2.5x £7,443m 152p<br />
Core Pharma £14,583m 51% 3.5x £51,042m 1,039p<br />
Vaccines £3,917m 14% 4.0x £15,667m 319p<br />
Consumer Health £5,745m 20% 3.3x £18,959m 386p<br />
ViiV £1,431m 5% 7.0x £10,018m 204p<br />
Group Sales £28,654m 100% £103,129m<br />
Net Debt - Q1'13A -£15,406m -314p<br />
Avg. shares outstanding (2012A) 4,912<br />
Group EV/Sales (SOTP) valuation £87,723m 1,786p<br />
Source: <strong>Jefferies</strong> estimates, company data<br />
EV/EBITDA<br />
Our EV/EBITDA valuation for GlaxoSmithKline yields 1,875p on a sum of the parts basis.<br />
This represents a 7% premium to the current stock price of 1,749p.<br />
Exhibit 48: EV/EBITDA SOTP valuation summary (£m or p per share where indicated)<br />
EBIDTA<br />
EBITDA 2014E<br />
(£m)<br />
EBITDA<br />
Contribution<br />
2014E<br />
EV/EBITDA<br />
2014<br />
Implied value<br />
(£m)<br />
Implied Share<br />
Price (p)<br />
Pharmaceuticals £6,445m 65.4% 10.3x £66,467m 1,353p<br />
Global Established Products £806m 8.2% 9.0x £7,258m 148p<br />
Core Pharma £5,639m 57.2% 10.5x £59,210m 1,205p<br />
Vaccines £1,395m 14.2% 11.0x £15,346m 312p<br />
Consumer Health £1,099m 11.1% 15.0x £16,483m 336p<br />
ViiV £920m 9.3% 10.0x £9,196m 187p<br />
Total EBITA £9,859m 100% £107,493m 2,188p<br />
Net Debt - Q1'13A -£15,406m -314p<br />
Implied Market Cap 92,087<br />
Avg. shares outstanding (2012A) 4,912<br />
Group EV/EBITDA (SOTP) valuation £92,087m 1,875p<br />
Source: <strong>Jefferies</strong> estimates, company data<br />
P/E Multiple valuation<br />
Our P/E multiple based valuation for GlaxoSmithKline yields 1,791p on a sum of the parts<br />
basis. This represents a 2% premium to the current stock price of 1,749p.<br />
Exhibit 49: P/E SOTP valuation summary (£m or p per share where indicated)<br />
P/E (SOTP) Summary CORE Op. Profit<br />
2014E<br />
Operating<br />
Margin 2014E<br />
Net income<br />
2014E<br />
CORE EPS 2014E P/E multiple Valuation/<br />
Share (p)<br />
Pharmaceuticals £5,807m 33% £4,449m 91p 13.7x 1,252p<br />
Global Established Products £727m 24% £557m 11p 12.0x 137p<br />
Core Pharma £5,081m 35% £3,893m 80p 14.0x 1,116p<br />
Vaccines £1,257m 32% £963m 20p 16.0x 315p<br />
Consumer Health £990m 17% £759m 16p 22.0x 342p<br />
ViiV £829m 58% £635m 13p 15.0x 195p<br />
Others (net financial income) -£508m - -£387m -8p - NA<br />
Net cash/ (debt) - Q1'2013 - - - - - -314p<br />
Total £8,883m 31% £6,419m 131p 1,791p<br />
Source: <strong>Jefferies</strong> estimates, company data<br />
page 35 of 92<br />
Jeffrey Holford, PhD, ACA, Equity Analyst, (212) 336-7409, jholford@jefferies.com<br />
Please see important disclosure information on pages 88 - 92 of this <strong>report</strong>.
Healthcare<br />
Rating | Target | Estimate Change<br />
May 28, 2013<br />
Johnson & Johnson (Hold; PT $97)<br />
Conglomerate premium neuters restructuring<br />
options<br />
Johnson & Johnson management pride themselves in being the largest diversified<br />
healthcare company with nearly 250 operating companies. The company has enjoyed a<br />
conglomerate premium to the US market for most of the last decade, trading at a 10-20%<br />
premium. However the historical premium range is being challenged at present as it<br />
trades at a premium of only 4% at present. Whilst diversification has helped the company<br />
weather various economic cycles, we have seen some action from management to focus<br />
the Group’s activities recently, as is evident from the announcement on 20 th January that<br />
they have initiated a strategic review of the Ortho Clinical Diagnostic business. We believe<br />
the management will make a decision to either divest the business to a suitable buyer or<br />
separate it as a stand-alone unit through an IPO by the end of 2013.<br />
Other than the Ortho Clinical Diagnostics unit we see few obvious candidates for further<br />
restructuring given management’s previous communications that this is unlikely. We see<br />
the Consumer Health business as an attractive spin-out option, which could potentially<br />
occur once all the manufacturing issues have been remedied and profitability has been<br />
restored to normal. Based on our sum of the-parts analysis the Consumer Health business<br />
could deliver significant upside of c$8.22 per share if proceeds from a separation were<br />
used to repurchase shares. However, our analysis also implies that the stump<br />
Pharmaceuticals/ MD&D businesses might offset some of these gains as they potentially<br />
fall in value by c$5.68 per share on a combined basis once some of the conglomerate<br />
premium is lost.<br />
Our mean sum of the parts valuation for Johnson & Johnson is $91.38 per share versus<br />
the current price of $86.82 and our official Target Price of $97.<br />
Divesting laggards to focus on growth units<br />
The implementation of Medical Device Tax as part of the Affordable Care Act in addition<br />
to the ongoing economic pressures within developed countries leading to a steady<br />
decline in the physician office visits has put pressure on the diagnostics industry. This is<br />
easily apparent within the Ortho Clinical Diagnostics business unit, which has been<br />
declining steadily since 2009 and declined by a further 3% operationally in 2012.<br />
Furthermore, it is one of the smallest businesses within the Group context at the EBITDA<br />
level (Exhibit 50).<br />
Consumer Healthcare has been the other drag on the group since the start of<br />
manufacturing issues in 2009, though its recovery is expected to drive an above group<br />
average growth rate at the EBITDA level. With recent successes from the pipeline, the Core<br />
Pharma business is expected to grow at a decent rate over the next few years despite<br />
headwinds from several LOEs. The acquisition of Synthes is also expected to aid the<br />
growth of the Medical Devices unit that makes up circa 30% of Group EBITDA.<br />
page 36 of 92<br />
Jeffrey Holford, PhD, ACA, Equity Analyst, (212) 336-7409, jholford@jefferies.com<br />
Please see important disclosure information on pages 88 - 92 of this <strong>report</strong>.
Healthcare<br />
EBITDA margin (2014E)<br />
Rating | Target | Estimate Change<br />
May 28, 2013<br />
Exhibit 50: 2014E EBITDA margin versus growth (2014E-17E) by division<br />
50%<br />
40%<br />
30%<br />
20%<br />
10%<br />
Ortho Clinical<br />
Diagnostics<br />
$336m<br />
Core Pharma<br />
$11,509m<br />
Medical Devices<br />
$8,169m<br />
Diagnostics<br />
$1,249m<br />
Consumer Health<br />
$4,333m<br />
0%<br />
0% 1% 2% 3% 4% 5% 6% 7% 8% 9%<br />
EBITDA CAGR (2014E-2017E)<br />
Source: <strong>Jefferies</strong> estimates, company data<br />
Exhibit 51, Exhibit 52 and Exhibit 53 give a snapshot of our estimates for 2014E revenues,<br />
EBITDA and EPS split across the five business segments, which we have used as the basis<br />
for our sum of the parts calculations.<br />
Exhibit 51: Estimated 2014E revenue<br />
contribution split ($m)<br />
Consumer<br />
Health<br />
$15,438m<br />
Diagnostics<br />
$5,742m<br />
Ortho<br />
Clinical<br />
Diagnostics<br />
$1,980m<br />
Exhibit 52: Estimated 2014E EBITDA<br />
contribution split ($m)<br />
Consumer<br />
Health<br />
$2,763m<br />
Diagnostics<br />
$1,249m<br />
Ortho<br />
Clinical<br />
Diagnostics<br />
$336m<br />
Exhibit 53: Estimated 2014E EPS<br />
contribution split ($ per share)<br />
Consumer<br />
Health<br />
$0.66<br />
Diagnostics<br />
$0.30<br />
Ortho<br />
Clinical<br />
Diagnostics<br />
$0.08<br />
Medical<br />
Devices<br />
$22,140m<br />
Core<br />
Pharma<br />
$28,698m<br />
Medical<br />
Devices<br />
$8,169m<br />
Core<br />
Pharma<br />
$11,509m<br />
Medical<br />
Devices<br />
$1.96<br />
Core<br />
Pharma<br />
$2.76<br />
Source: <strong>Jefferies</strong> estimates<br />
Source: <strong>Jefferies</strong> estimates<br />
Source: <strong>Jefferies</strong> estimates<br />
Ortho Clinical Diagnostics could fetch $3.5bn<br />
Management announced initiation of a strategic review of the business unit on 20 th<br />
January. We believe the management could make a decision regarding the route of<br />
divestment potentially by the year end, if not earlier. We would expect that the<br />
divestment could be achieved through a trade sale to another industry player, potentially,<br />
Abbott, Bayer, Novartis, or Roche, though FTC issues may be an issue in many cases. We<br />
believe that such an asset could fetch circa $3.5bn (c1.8x sales; c10.5x EBITDA; 5.8x<br />
earnings).<br />
page 37 of 92<br />
Jeffrey Holford, PhD, ACA, Equity Analyst, (212) 336-7409, jholford@jefferies.com<br />
Please see important disclosure information on pages 88 - 92 of this <strong>report</strong>.
Healthcare<br />
Valuation/ Share<br />
Rating | Target | Estimate Change<br />
May 28, 2013<br />
Consumer could potentially go the IPO route for an estimated $51bn<br />
Consumer Health could potentially be divested through a public offering as a stand alone<br />
company. The business unit generated $16bn in sales in 2008 growing at high singledigit<br />
rate before the start of the OTC product manufacturing issues. Once the<br />
manufacturing issues are resolved the business could potentially get to a mid-single-digit<br />
growth rate. A trade sale could be another potential route, though we expect that antitrust<br />
and taxation issues might prevent this. We would expect that such an asset would<br />
would be worth at least $51bn (c3.3x sales; c18.5x EBITDA; c27.5x earnings) as a stand<br />
alone entity.<br />
On this basis, we estimate that such a transaction would be c9% accretive to Johnson &<br />
Johnson if the net proceeds were used to repurchase its own shares. However, our<br />
analysis also implies that the stump Pharmaceuticals/ MD&D businesses might offset<br />
some of these gains as they potentially fall in value by c$5.68 per share on a combined<br />
basis once some of the conglomerate premium is lost.<br />
SOTP Valuations yield c5% upside<br />
Assuming that a ‚real-world‛ sum of the parts for Johnson & Johnson is achieved by<br />
selling its Ortho Clinical Diagnostics business and spinning off Consumer Health via an<br />
IPO, we estimate that the group is worth circa $91.38 per share, a c5% premium to the<br />
current share price. We have summarised the various SOTP valuations for Johnson &<br />
Johnson in this section in Exhibit 54 alongside our more conventional P/E relative<br />
valuation for the shares (based on a 10-15% 2014E P/E premium to the US market).<br />
Exhibit 54: Summary of share price evaluation by different valuation<br />
methodologies ($ per share)<br />
$100<br />
$90<br />
$80<br />
$70<br />
$60<br />
$50<br />
$40<br />
$30<br />
$20<br />
$10<br />
$0<br />
$97.00<br />
Source: <strong>Jefferies</strong> estimates<br />
$90.26 $92.03 $91.86<br />
PE REL EV/sales EV/EBITDA P/E multiple<br />
The individual SOTP valuations based on EV/Sales, EV/EBITDA and P/E multiples are<br />
included in this <strong>report</strong> in Exhibit 56, Exhibit 57 and Exhibit 58. Exhibit 55 summarises<br />
these as well as providing a comparison of how the average of these valuations for each<br />
business unit compares to their valuation based on our estimate of earnings on the<br />
current group multiple. We note that the Ortho Clinical Diagnostics and Consumer Health<br />
units would be expected by us to be value creating if separated from the group assuming<br />
minimal dis-synergies and the use of the proceeds to repurchase shares at the current<br />
price.<br />
page 38 of 92<br />
Jeffrey Holford, PhD, ACA, Equity Analyst, (212) 336-7409, jholford@jefferies.com<br />
Please see important disclosure information on pages 88 - 92 of this <strong>report</strong>.
Healthcare<br />
Rating | Target | Estimate Change<br />
May 28, 2013<br />
Exhibit 55: Summary of share price evaluation by different valuation methodologies ($ per share)<br />
EV/sales EV/EBITDA P/E SOTP Mean<br />
Valuation<br />
Value at Group<br />
Multiple<br />
Multiple<br />
Arbitrage/<br />
share<br />
Core Pharma $37.14 $40.26 $38.65 $38.68 $40.08 ($1.40)<br />
Medical Devices $24.78 $25.72 $27.43 $25.98 $28.45 ($2.47)<br />
Consumer Health $18.90 $17.40 $17.23 $17.84 $9.62 $8.22<br />
Diagnostics $6.03 $5.46 $5.39 $5.63 $4.35 $1.28<br />
Ortho Clinical Diagnostics $1.39 $1.18 $1.13 $1.23 $1.17 $0.06<br />
Non-operating income/(expense) NA NA NA NA $3.14 NA<br />
Net cash/ (debt) - Q1 2013A $2.02 $2.02 $2.02 $2.02 NA NA<br />
Group $90.26 $92.03 $91.86 $91.38 $86.82 $5.68<br />
Source: <strong>Jefferies</strong> estimates<br />
SOTP Valuation Tables<br />
EV/Sales valuation<br />
Our EV/Sales valuation for Johnson & Johnson yields $90.26 on a sum of the parts basis.<br />
This represents a 4% premium to the current stock price of $86.82.<br />
Exhibit 56: EV/Sales SOTP valuation summary ($m or $ per share where indicated)<br />
Sales<br />
2014E ($m)<br />
% Sales<br />
Contribution<br />
EV/Sales Multiple Implied EV ($m) Valuation per<br />
share ($)<br />
Core Pharma $28,698m 39% 3.7x $106,181m $37.14<br />
Medical Devices $22,140m 30% 3.2x $70,848m $24.78<br />
Consumer Health $15,438m 21% 3.5x $54,031m $18.90<br />
Diagnostics $5,742m 8% 3.0x $17,226m $6.03<br />
Ortho Clinical Diagnostics $1,980m 3% 2.0x $3,961m $1.39<br />
Group Sales $73,997m 100% $252,247m $88.24<br />
Net cash/ (debt) - Q1 2013A $5,776m $2.02<br />
Avg. shares outstanding (Q1 2013A) 2,859<br />
Group EV/Sales (SOTP) valuation $258,023m $90.26<br />
Source: <strong>Jefferies</strong> estimates<br />
EV/EBITDA valuation<br />
Our EV/EBITDA valuation for Johnson & Johnson yields $92.03 on a sum of the parts basis.<br />
This represents a 6% premium to the current stock price of $86.82.<br />
Exhibit 57: EV/EBITDA SOTP valuation summary ($m or $ per share where indicated)<br />
EBITDA<br />
2014E<br />
($M)<br />
EBITDA<br />
Contribution<br />
2014E<br />
EV/EBITDA<br />
2014<br />
Implied EV ($m)<br />
Valuation per<br />
share ($)<br />
Core Pharma $11,509m 47.9% 10.0x $115,087m $40.26<br />
Medical Devices $8,169m 34.0% 9.0x $73,521m $25.72<br />
Consumer Health $2,763m 11.5% 18.0x $49,735m $17.40<br />
Diagnostics $1,249m 5.2% 12.5x $15,617m $5.46<br />
Ortho Clinical Diagnostics $336m 1.4% 10.0x $3,364m $1.18<br />
Total EBITDA $24,027m 100.0% $257,324m $90.01<br />
Net cash/ (debt) - Q1 2013A $5,776m $2.02<br />
Implied Market Cap<br />
$263,100m<br />
Avg. shares outstanding (Q1 2013A) 2,859<br />
Group EV/EBITDA (SOTP) valuation $268,876m $92.03<br />
Source: <strong>Jefferies</strong> estimates<br />
page 39 of 92<br />
Jeffrey Holford, PhD, ACA, Equity Analyst, (212) 336-7409, jholford@jefferies.com<br />
Please see important disclosure information on pages 88 - 92 of this <strong>report</strong>.
Healthcare<br />
Rating | Target | Estimate Change<br />
May 28, 2013<br />
Exhibit 58: P/E SOTP valuation summary ($m or $ per share where indicated)<br />
P/E (SOTP) Summary<br />
Operating<br />
Profit 2014E<br />
Operating<br />
Margin 2014E<br />
Net Income<br />
2014E<br />
Division<br />
P/E Multiple valuation<br />
Our P/E multiple based valuation for Johnson & Johnson yields $91.86 on a sum of the<br />
parts basis. This represents a 6% premium to the current stock price of $86.82.<br />
EPS<br />
2014E<br />
P/E multiple<br />
Valuation per<br />
share ($)<br />
Core Pharma $9,687m 34% $7,740m $2.76 14.0x $38.65<br />
Medical Devices $6,876m 31% $5,494m $1.96 14.0x $27.43<br />
Consumer Health $2,326m 15% $1,858m $0.66 26.0x $17.23<br />
Diagnostics $1,052m 18% $840m $0.30 18.0x $5.39<br />
Ortho Clinical Diagnostics $283m 14% $226m $0.08 14.0x $1.13<br />
Non-operating income/(espense) $764m - $611m $0.22 - NA<br />
Net cash/ (debt) – Q1 2013A - - - - - $2.02<br />
Total $20,224m 27% $16,769m $5.98 15.4x $91.86<br />
Source: <strong>Jefferies</strong> estimates<br />
page 40 of 92<br />
Jeffrey Holford, PhD, ACA, Equity Analyst, (212) 336-7409, jholford@jefferies.com<br />
Please see important disclosure information on pages 88 - 92 of this <strong>report</strong>.
Healthcare<br />
Rating | Target | Estimate Change<br />
May 28, 2013<br />
Merck & Co. (Buy; PT $54)<br />
Under Pressure To Act; Upgrade to Buy from Hold<br />
Merck & Co.’s management are likely to come under increasing pressure to divest some<br />
of its non-Pharmaceutical businesses as the company underperforms its main peer, Pfizer,<br />
which has followed a more aggressive pathway in this regard. We see some specific<br />
opportunities in Consumer and Animal Health that in aggregate could generate c$23.4bn<br />
of pre-tax cash through a disposal and IPO respectively. If net cash proceeds were used to<br />
repurchase shares we estimate that these transactions would be circa 6% accretive to<br />
earnings. Whilst the divestments might be slightly accretive to the group EBITDA margin,<br />
they might negatively impact the growth of the remaining group entity to a minor<br />
degree.<br />
Whilst these transactions may make sense for shareholders in the short term, we sense<br />
that management are currently unwilling to pursue this course of action. However, if the<br />
Pharmaceuticals business continues to disappoint in R&D through 2013, we suspect that<br />
insurmountable pressure to change this strategy would likely ensue on a 2014 timeframe.<br />
Our mean sum of the parts valuation for Merck & Co. is $54.30 per share versus the<br />
current price of $47.16 and our official Target Price of $54. Merck & Co. continues to<br />
have one of the most attractive yields in the US Large Cap Pharmaceuticals universe at<br />
3.7% versus the sector average of 3.3%. Based on our valuation and belief that pressure<br />
to increase returns to shareholders will lead to divestments we have raised our PT to $54<br />
from $48 and raised our rating to Buy from Hold.<br />
Consumer and Animal Health present potential divestments<br />
Merck & Co. is one of the more diversified companies within our coverage universe with<br />
circa 26% of revenues and 22% of its EBITDA being derived from non-pharmaceutical<br />
healthcare operations. With management under some pressure to replicate the asset<br />
disposals made at Pfizer recently, we see a couple of specific opportunities in Consumer<br />
Health and Animal Health. Both businesses are relatively small within the group context at<br />
the EBITDA level (Exhibit 14) and are margin dilutive on a group basis by our estimates. As<br />
recently as the Q1’13 analyst call, CEO Ken Frazier stated:<br />
“I will start with my thoughts on consumer. My thoughts about the critical mass issue really<br />
have not changed. I think that continues to be an issue that we have to look at. And as I've<br />
said before, we periodically assess our business strategy based on the fit and the business<br />
opportunity that we see. As I said in my earlier comments, we believe that this quarter our<br />
business diversity actually helped us, it was complementary, it contributed to the top- and the<br />
bottom-line growth that we need to have. But as always, we have to look at all of our<br />
portfolio and make assessments about what is the best way to create shareholder value going<br />
forward”<br />
We see the Vaccines business as being too large and well-integrated with the<br />
Pharmaceuticals business to be considered as a spin-off. Furthermore the business<br />
performs well in our view with comparable margins to the Pharmaceuticals business and<br />
decent growth prospects for the future.<br />
page 41 of 92<br />
Jeffrey Holford, PhD, ACA, Equity Analyst, (212) 336-7409, jholford@jefferies.com<br />
Please see important disclosure information on pages 88 - 92 of this <strong>report</strong>.
Healthcare<br />
EBITDA margin (2014E)<br />
Rating | Target | Estimate Change<br />
May 28, 2013<br />
Exhibit 59: 2014E EBITDA margin versus growth (2014E-17E) by division<br />
50%<br />
45%<br />
40%<br />
35%<br />
30%<br />
25%<br />
20%<br />
Core Pharma<br />
$12,857m<br />
Animal Health<br />
$993m<br />
Vaccines<br />
$2,068m<br />
Consumer Health<br />
$629m<br />
15%<br />
10%<br />
5%<br />
0%<br />
0% 1% 2% 3% 4% 5% 6% 7% 8% 9% 10%<br />
EBITDA CAGR (2014E-2017E)<br />
Source: <strong>Jefferies</strong> estimates, company data<br />
Exhibit 60, Exhibit 61 and Exhibit 62 give a snapshot of our estimates for 2014E revenues,<br />
EBITDA and EPS split across the four main business segments, which we have used as the<br />
basis for our sum of the parts calculations.<br />
Exhibit 60: Estimated 2014E revenue<br />
contribution split ($m)<br />
Consumer<br />
Health<br />
$2,162m<br />
Vaccines<br />
$5,759m<br />
Animal<br />
Health<br />
$3,771m<br />
Exhibit 61: Estimated 2014E EBITDA<br />
contribution split ($m)<br />
Vaccines<br />
$2,068m<br />
Consumer<br />
Health<br />
$629m<br />
Animal<br />
Health<br />
$993m<br />
Exhibit 62: Estimated 2014E EPS<br />
contribution split ($ per share)<br />
Vaccines<br />
$0.49<br />
Consumer<br />
Health<br />
$0.15<br />
Animal<br />
Health<br />
$0.23<br />
Source: <strong>Jefferies</strong> estimates<br />
Core<br />
Pharma<br />
$32,714m<br />
Source: <strong>Jefferies</strong> estimates<br />
Core<br />
Pharma<br />
$12,857m<br />
Source: <strong>Jefferies</strong> estimates<br />
Core<br />
Pharma<br />
$3.03<br />
Consumer could fetch circa $9.4bn in a heated auction<br />
We would expect that any divestment of the Consumer Health business would be<br />
achieved through a trade sale to another industry player, potentially, GlaxoSmithKine,<br />
Pfizer, Johnson & Johnson, Bayer, Reckitt Benckiser [RB LN, 4,850p, Hold], Novartis or<br />
Sanofi. We would expect that such an asset would be highly sought after by such<br />
companies and would fetch at least $9.4bn (c4.4x sales; c15x EBITDA; c22.1x earnings) in<br />
a heated auction.<br />
On this basis, we estimate that such a transaction would be circa 2-3% accretive to Merck<br />
& Co. if the net proceeds were used to repurchase its own shares.<br />
page 42 of 92<br />
Jeffrey Holford, PhD, ACA, Equity Analyst, (212) 336-7409, jholford@jefferies.com<br />
Please see important disclosure information on pages 88 - 92 of this <strong>report</strong>.
Healthcare<br />
Valuation/Share<br />
Rating | Target | Estimate Change<br />
May 28, 2013<br />
IPO route seems logical for Animal Health; We estimate $14.1bn valuation<br />
Animal Health could logically go down the IPO route, given the trail already blazed by<br />
Pfizer with Zoetis. A trade sale could be another potential route, though we expect that<br />
anti-trust and taxation issues might prevent this, just as likely occurred with Zoetis.<br />
Potential acquirers could include Eli Lilly, Bayer, Novartis, GlaxoSmithKline and Johnson &<br />
Johnson, in our view.<br />
We estimate that Merck Animal Health could be worth circa $14.1bn (c3.7x sales; c14.2x<br />
EBITDA; c21.0x earnings) if separatated as a spin off or sold to another company. On this<br />
basis, we estimate that such a transaction would be circa 3-4% accretive to Merck & Co. if<br />
the net proceeds were used to repurchase its own shares.<br />
SOTP Valuations yield c15% upside<br />
Assuming that a ‚real-world‛ sum of the parts for Merck & Co. is achieved by selling its<br />
Consumer Health business and spinning or selling off Animal Health, we estimate that the<br />
group is worth circa $54.30 per share, a c15% premium to the current share price. We<br />
have summarised the various SOTP valuations for Merck in this section in Exhibit 63<br />
alongside our more conventional P/E relative valuation for the shares (based on 0-5%<br />
2014E P/E premium to the US market).<br />
Exhibit 63: Summary of share price evaluation by different valuation<br />
methodologies ($ per share)<br />
$60<br />
$50<br />
$54.00 $53.74 $55.33 $53.85<br />
$40<br />
$30<br />
$20<br />
$10<br />
$0<br />
PE REL EV/Sales EV/EBITDA P/E multiple<br />
Source: <strong>Jefferies</strong> estimates<br />
The individual SOTP valuations based on EV/Sales, EV/EBITDA and P/E multiples are<br />
included in this <strong>report</strong> in Exhibit 65, Exhibit 66 and Exhibit 67.<br />
Exhibit 64 summarises these as well as providing a comparison of how the average of<br />
these valuations for each business unit compares to their valuation based on our estimate<br />
of earnings on the current group multiple.<br />
We note that the Consumer Health, Vaccines and Animal Health units would all be<br />
expected by us to be value creating if separated from the group assuming minimal dissynergies<br />
and the use of the proceeds to repurchase shares at the current price. However,<br />
as already described, we think that there would be significant dis-synergies in separating<br />
the Vaccines business from the group and it is a very unlikely path for management to go<br />
down at this time.<br />
page 43 of 92<br />
Jeffrey Holford, PhD, ACA, Equity Analyst, (212) 336-7409, jholford@jefferies.com<br />
Please see important disclosure information on pages 88 - 92 of this <strong>report</strong>.
Healthcare<br />
Rating | Target | Estimate Change<br />
May 28, 2013<br />
Exhibit 64: Summary of share price evaluation by different valuation methodologies ($ per share)<br />
EV/sales EV/EBITDA P/E SOTP Mean<br />
Valuation<br />
Value at Group<br />
Multiple<br />
Multiple<br />
Arbitrage/<br />
share<br />
Core Pharma $37.24 $39.72 $37.94 $38.30 $38.86 ($0.56)<br />
Consumer Health $3.16 $3.07 $2.97 $3.07 $1.90 $1.17<br />
Vaccines $7.49 $7.40 $7.32 $7.40 $6.25 $1.15<br />
Animal Health $4.91 $4.20 $4.69 $4.60 $3.00 $1.60<br />
Non-operating income/(expense) NA NA NA NA ($2.86) NA<br />
Net cash/ (debt) - 2012A $0.94 $0.94 $0.94 $0.94 NA NA<br />
Group $53.74 $55.33 $53.85 $54.30 $47.15 $3.36<br />
Source: <strong>Jefferies</strong> estimates<br />
SOTP Valuation Tables<br />
EV/Sales valuation<br />
Our EV/Sales valuation for Merck & Co. yields $53.74 on a sum of the parts basis. This<br />
represents a 14% premium to the current stock price of $47.16.<br />
Exhibit 65: EV/Sales SOTP valuation summary ($m or $ per share where indicated)<br />
Sales<br />
2014E ($m)<br />
% Sales<br />
Contribution<br />
EV/Sales<br />
Multiple<br />
Implied EV ($m)<br />
Valuation per<br />
share ($)<br />
Core Pharma $32,714m 74% 3.5x $114,499m $37.24<br />
Consumer Health $2,162m 5% 4.5x $9,728m $3.16<br />
Vaccines $5,759m 13% 4.0x $23,034m $7.49<br />
Animal Health $3,771m 8% 4.0x $15,084m $4.91<br />
Group Sales $44,405m 100% $162,345m $52.80<br />
Net cash/ (debt) - 2012A $2,877m $0.94<br />
Avg. shares outstanding (2012A) 3,075<br />
Group EV/Sales (SOTP) valuation $165,222m $53.74<br />
Source: <strong>Jefferies</strong> estimates<br />
EV/EBITDA valuation<br />
Our EV/EBITDA valuation for Merck & Co. yields $55.33 on a sum of the parts basis. This<br />
represents a 22% premium to the current stock price of $47.16.<br />
Exhibit 66: EV/EBITDA SOTP valuation summary ($m or $ per share where indicated)<br />
EBITDA<br />
2014E<br />
($M)<br />
EBITDA<br />
Contribution<br />
2014E<br />
EV/EBITDA<br />
2014<br />
Implied EV ($m)<br />
Valuation per<br />
share ($)<br />
Core Pharma $12,857m 77.7% 9.5x $122,143m $39.72<br />
Consumer Health $629m 3.8% 15.0x $9,432m $3.07<br />
Vaccines $2,068m 12.5% 11.0x $22,752m $7.40<br />
Animal Health $993m 6.0% 13.0x $12,907m $4.20<br />
Total EBITDA $16,547m 100.0% $167,234m $54.39<br />
Net cash/ (debt) - 2012A $2,877m $0.94<br />
Avg. shares outstanding (2012A) 3,075<br />
Group EV/EBITDA (SOTP) valuation $170,111m $55.33<br />
Source: <strong>Jefferies</strong> estimates<br />
page 44 of 92<br />
Jeffrey Holford, PhD, ACA, Equity Analyst, (212) 336-7409, jholford@jefferies.com<br />
Please see important disclosure information on pages 88 - 92 of this <strong>report</strong>.
Healthcare<br />
Rating | Target | Estimate Change<br />
May 28, 2013<br />
P/E Multiple valuation<br />
Our P/E multiple based valuation for Merck & Co. yields $53.85 on a sum of the parts<br />
basis. This represents a 19% premium to the current stock price of $47.16.<br />
Exhibit 67: P/E SOTP valuation summary ($m or $ per share where indicated)<br />
P/E (SOTP) Summary<br />
Operating Operating Margin Net Income 2014E<br />
Profit 2014E<br />
2014E<br />
Division<br />
EPS<br />
2014E<br />
P/E multiple<br />
Valuation per<br />
share ($)<br />
Core Pharma $11,225m 34% $8,732m $3.03 12.5x $37.94<br />
Consumer Health $549m 25% $427m $0.15 20.0x $2.97<br />
Vaccines $1,806m 31% $1,405m $0.49 15.0x $7.32<br />
Animal Health $867m 23% $674m $0.23 20.0x $4.69<br />
Non-operating income/ (expense) ($677m) - ($642m) ($0.22) - NA<br />
Net cash/ (debt) - 2012A - - - - - $0.94<br />
Total $14,447m 33% $10,597m $3.68 14.6x $53.85<br />
Source: <strong>Jefferies</strong> estimates<br />
page 45 of 92<br />
Jeffrey Holford, PhD, ACA, Equity Analyst, (212) 336-7409, jholford@jefferies.com<br />
Please see important disclosure information on pages 88 - 92 of this <strong>report</strong>.
Healthcare<br />
EBITDA margin (2014E)<br />
Rating | Target | Estimate Change<br />
May 28, 2013<br />
Novartis (Buy; PT CHF88)<br />
Significant Trapped Value Waiting To Be Released<br />
We have a long held view that there is significant trapped value within Novartis and that it<br />
could begin to be released through asset disposals as soon as H2’13. Novartis was one of<br />
the most proactive companies at diversifying its revenue base ahead of its patent cliff,<br />
which centers around Diovan. We see five specific assets, namely the Roche bearer share<br />
stake, Vaccines, Diagnostics, OTC Consumer Health and Animal Health that could be ripe<br />
for disposals or spin-offs over the next 2-3 years. Whilst these businesses could be worth<br />
up to $45bn (c25% of Group market capitalization) if sold or spun-out, they represent<br />
only c10% of our 2014E CORE EPS.<br />
We believe that management is already headed towards this direction and that the recent<br />
departure of Chairman Vasella does nothing but facilitate the acceleration of this<br />
inevitable process. We calculate that if the net cash proceeds from all of these potential<br />
disposals were used to repurchase shares we estimate that these transactions would be<br />
circa 14% accretive to earnings. Whilst the divestments might be slightly accretive to the<br />
group EBITDA margin, they would also likely negatively impact the growth of the<br />
remaining group entity to a minor degree.<br />
We believe that engaging in just one of these disposals, such as the Roche stake or the<br />
Vaccines business, would ‚release the flood gates‛ on investor sentiment over the<br />
potential for further disposals across the group to be made.<br />
Our mean sum of the parts valuation for Novartis is CHF84.59 per share versus the current<br />
price of CHF71.25 and our official Target Price of CHF88.<br />
Divisional satellites waiting to break orbit<br />
Exhibit 68 illustrates how Novartis’ Core Pharmaceuticals and Alcon units dwarf the<br />
smaller satellite businesses in Sandoz (split into oral solids and ‚Difficult To Make‛ (DTM)<br />
products), Consumer Health (split into OTC and Animal Health) and Vaccines &<br />
Diagnostics. However, we understand that Sandoz, the largest and most synergistic of<br />
these divisions, is very unlikely to be separated from the group and therefore we have not<br />
considered it further in this regard other than showing its SOTP valuation on a straight<br />
market comparable basis.<br />
Exhibit 68: 2014E EBITDA margin versus growth (2014E-17E) by division<br />
50%<br />
45%<br />
40%<br />
35%<br />
30%<br />
25%<br />
20%<br />
15%<br />
10%<br />
5%<br />
$9,923m<br />
Pharmaceuticals<br />
Alcon<br />
$4,282m<br />
Sandoz (Bio/DTM),<br />
$1,398m<br />
Diagnostics, $147m<br />
Animal Health, $223m<br />
Consumer Health,<br />
$334m<br />
Sandoz (oral), $466m Vaccines, $63m<br />
0%<br />
-10% 0% 10% 20% 30% 40% 50% 60% 70% 80% 90%<br />
EBITDA CAGR (2014E-2017E)<br />
Source: <strong>Jefferies</strong> estimates, company data<br />
page 46 of 92<br />
Jeffrey Holford, PhD, ACA, Equity Analyst, (212) 336-7409, jholford@jefferies.com<br />
Please see important disclosure information on pages 88 - 92 of this <strong>report</strong>.
Healthcare<br />
Rating | Target | Estimate Change<br />
May 28, 2013<br />
We believe that the Vaccines, OTC Consumer and Animal Health units are the most logical<br />
divestment opportunities for Novartis over the next few years. We also expect that<br />
Novartis could receive an attractive offer for its bearer share stake in Roche by as soon as<br />
H2’13, should Roche wish to pursue a share repurchase program. We note that Joe<br />
Jimenez also recently commented at the Q1’13 result call that:<br />
“Now, you did mention the change of Chairman and changes in the Company. And what<br />
I've said previously is that the strategy of the Company is sound, that we are a science-based<br />
company, we're focused on innovation. And we are focused in high-growth segments of<br />
healthcare. So while the strategy, I don't anticipate the strategy of the Company to move, the<br />
way that we execute that and the way that that looks could potentially change as we<br />
evaluate our portfolio, as we evaluate the market as we evaluate a lot of things over the next<br />
24 and 36 months”……………..and……………..“Just in terms of the Roche stake when you -- to<br />
define strategic value, first, to have a 33% voting stake in one of the great companies in terms<br />
of healthcare or Pharma, would mean that for that company to issue shares to do something,<br />
they would have to have the agreement of Novartis, so there's an element of strategy when<br />
you think about the let's say, freedom to operate that is valuable. I've also said that you<br />
can't re-create that stake in the market today, so to me, it has value that is beyond the<br />
market price. And so that doesn't mean we would never exit it. What it does mean is that the<br />
value created, whether it's dollars or whether it's something else would have to compensate<br />
Novartis shareholders for that value and the fact that it's not just the market price.”<br />
We understand that in terms of specifics, management need to remain tight-lipped until<br />
Chairman Reinhardt joins in August. We would expect a strategic and portfolio review<br />
during H2’13 after which we believe the Vaccines business could be targeted for sale<br />
during 2014, whilst timing of the OTC and Animal Health disposals would be more likely<br />
to be on a 2015 timeframe at the earliest given the recent manufacturing issues.<br />
Exhibit 69: Estimated 2014E revenue<br />
contribution split ($m)<br />
Vaccines,<br />
$1,731<br />
Sandoz<br />
(biosimilars &<br />
DTM), $4,773<br />
Sandoz (oral<br />
solids), $4,773<br />
Diagnostics,<br />
$488<br />
Consumer<br />
Health, $3,155<br />
Animal<br />
Health, $1,352<br />
Exhibit 70: Estimated 2014E EBITDA<br />
contribution split ($m)<br />
Vaccines, $63<br />
Sandoz<br />
(biosimilars &<br />
DTM), $1,398<br />
Sandoz (oral<br />
solids), $466<br />
Diagnostics,<br />
$147<br />
Consumer<br />
Health, $334<br />
Animal Health,<br />
$223<br />
Exhibit 71: Estimated 2014E EPS<br />
contribution split ($ per share)<br />
Diagnostics,<br />
$0.05<br />
Vaccines, $0.02<br />
Sandoz<br />
(biosimilars &<br />
DTM), $0.46<br />
Sandoz (oral<br />
solids), $0.15<br />
Consumer<br />
Health, $0.11<br />
Animal Health,<br />
$0.07<br />
Roche, $0.32<br />
Alcon, $4,282<br />
Alcon,<br />
$11,147<br />
Pharma,<br />
$32,213<br />
Pharmaceuticals,<br />
$9,923<br />
Alcon, $1.40<br />
Pharmaceuticals,<br />
$3.23<br />
Source: <strong>Jefferies</strong> estimates<br />
Source: <strong>Jefferies</strong> estimates<br />
Source: <strong>Jefferies</strong> estimates<br />
page 47 of 92<br />
Jeffrey Holford, PhD, ACA, Equity Analyst, (212) 336-7409, jholford@jefferies.com<br />
Please see important disclosure information on pages 88 - 92 of this <strong>report</strong>.
Healthcare<br />
Rating | Target | Estimate Change<br />
May 28, 2013<br />
Roche Bearer Shares could be disposed of as soon as H2’13<br />
We have previously published extensive <strong>report</strong>s on the rational and potential structure of<br />
a disposal of the Roche Bearer share stake by Novartis to Roche (see our note ‚Buy or Buy<br />
Back‛, 27 th September, 2012). We continue to believe that Roche could pay a substantial<br />
premium for the stake of circa 30%, valuing it at c$18.8bn versus the current market<br />
valuation of $14.5bn or implied valuation within Novartis of $10.8bn. On this basis, we<br />
estimate that such a transaction would be circa 4.3% accretive to Novartis if the net<br />
proceeds were used to repurchase its own shares.<br />
Vaccines could fetch circa $6.9bn in a heated auction<br />
We would expect that any divestment of the Vaccines business would be achieved<br />
through a trade sale to another industry player, with Pfizer and Merck & Co. being the<br />
most likely acquirers given their lower exposure to Flu and meningitis vaccines compared<br />
to Sanofi and GlaxoSmithKline. Johnson & Johnson could also have significant interest in<br />
this asset as they have little exposure to mainstream vaccines, other than through their<br />
acquisition of Crucell in 2011. We would expect that bidding for this business would be<br />
very competitive, given the potential use of offshore cash to acquire it.<br />
On this basis we value the Vaccines unit at $6.9bn (c4.0x EV/Sales). Given that profit<br />
expectations are currently almost non-existent it is not realistic to attempt valuing the<br />
business on either a EV/EBITDA or P/E multiples. We feel that this is the correct approach<br />
as most of the infrastrucutre would be removed if bought by an acquirer, who would in<br />
turn be much more focused on the revenues on offer. We estimate that such a transaction<br />
would be circa 3.3% accretive to Novartis if the net proceeds were used to repurchase its<br />
own shares.<br />
OTC Consumer also looks like a prime disposal target after it recovers<br />
We would expect that the most logical route for a divestment of Novartis’ OTC Consumer<br />
Health business would be through a trade sale to another industry player, potentially,<br />
GlaxoSmithKline, Pfizer, Johnson & Johnson, Bayer, Reckit Benckiser, Merck & Co. or<br />
Sanofi. Timing would likely not be before 2015 as the unit is still recovering revenues and<br />
margins following the recent manufacturing issues at its Lincoln plant.<br />
We would expect that such an asset would be highly sought after by such companies and<br />
would fetch at least $12.6bn (c4.0x sales) in a competitive auction. With profitability of<br />
the division still severely impacted by the Lincoln problems it is not practical to attempt<br />
valuing the business on either a EV/EBITDA or P/E multiples at present. On this basis, we<br />
estimate that such a transaction would be circa 4.3% accretive to Novartis if the net<br />
proceeds were used to repurchase its own shares.<br />
Animal Health disposal could likely follow the same timeline as OTC<br />
Whilst other larger players such as Sanofi, Eli Lilly and Merck & Co. might be better suited<br />
to pursue the IPO route for their Animal Health businesses, we believe that the greatest<br />
value for Novartis’ unit might be through a trade sale due to its smaller size. With a strong<br />
focus in parasiticides, we believe that the most logical acquirers could include Eli Lilly,<br />
Boehringer Ingelheim, Merck and Zoetis.<br />
We estimate that Novartis’ Animal Health could be worth c5.4bn (c4x sales) if sold to<br />
another industry player. With profitability also impacted by the problems at Lincoln, we<br />
view a sales multiple as the most logical way to currently value the business. On this<br />
basis, we estimate that such a transaction could be circa 1.6% accretive to Novartis if the<br />
net proceeds were used to repurchase its own shares.<br />
page 48 of 92<br />
Jeffrey Holford, PhD, ACA, Equity Analyst, (212) 336-7409, jholford@jefferies.com<br />
Please see important disclosure information on pages 88 - 92 of this <strong>report</strong>.
Healthcare<br />
Valuation/Share (CHF)<br />
Rating | Target | Estimate Change<br />
May 28, 2013<br />
SOTP Valuations yield circa 19% upside<br />
We have carried out sum of the parts valuations utilising EV/Sales, EV/EBITDA and P/E<br />
calculations. As summarized in Exhibit 72, utilizing ‚real-world‛ valuation multiples, these<br />
different valuation methodologies provide a valuation range of CHF83.67 to CHF85.26<br />
per share, with a mean valuation of CHF84.59 per share. This represents an upside of<br />
c19%, relative to the current share price of CHF71.25.<br />
Exhibit 72: Summary of share price evaluation by different valuation<br />
methodologies (CHF per share)<br />
CHF100<br />
CHF90<br />
CHF80<br />
CHF70<br />
CHF60<br />
CHF50<br />
CHF40<br />
CHF30<br />
CHF20<br />
CHF10<br />
CHF0<br />
CHF88.00<br />
CHF84.86 CHF83.67 CHF85.26<br />
PE (REL) EV/Sales (SOTP) EV/EBITDA P/E (SOTP)<br />
Source: <strong>Jefferies</strong> estimates<br />
Summary of valuation methodologies<br />
The individual SOTP calculations based on EV/Sales, EV/EBITDA, and P/E multiples are<br />
shown below in Exhibit 74, Exhibit 75 and Exhibit 76. Exhibit 73 provides a summary of<br />
these different methodologies, as well as a comparison of how the average of these<br />
valuations for each business unit compares to the valuation based on our estimate of<br />
earnings on the current group multiple.<br />
Based on these valuations, we note that splitting out any of the divisions already<br />
highlighted above should generate varying degrees of earnings accretion, assuming that<br />
the cash raised is reinvested in share buybacks at the current share price and no dissynergies<br />
are created. Nevertheless, the single biggest valuation increase could come from<br />
Alcon, which appears to be undervalued on the group multiple, reflecting a degree of<br />
conglomerate discount. This lower multiple is likely to be partly the result of the<br />
difficulties currently being encountered within the Vaccines and Consumer businesses.<br />
Our valuation work suggests that if Alcon’s value was <strong>full</strong>y reflected in the rating, it could<br />
be worth circa $59bn (5.3x sales, 13.8x EBITDA, 17.6x earnings), representing circa<br />
CHF4.62 per share upside to the share price. On the assumption Alcon is not going to be<br />
disposed of, this incremental value would likely only materialise if other underperforming<br />
assets are disposed of so allowing a <strong>full</strong>er multiple to be attributed to the group as a<br />
whole.<br />
page 49 of 92<br />
Jeffrey Holford, PhD, ACA, Equity Analyst, (212) 336-7409, jholford@jefferies.com<br />
Please see important disclosure information on pages 88 - 92 of this <strong>report</strong>.
Healthcare<br />
Rating | Target | Estimate Change<br />
May 28, 2013<br />
Exhibit 73: Summary of share price evaluation by different valuation methodologies (CHF per share)<br />
Division EV/Sales EV/EBITDA P/E SOTP Mean<br />
Valuation<br />
Value at<br />
Group<br />
Multiple<br />
Multiple<br />
Arbitrage /<br />
Share<br />
Pharmaceuticals CHF43.00 CHF41.63 CHF42.14 CHF42.26 CHF41.36 CHF0.90<br />
Alcon CHF21.26 CHF22.87 CHF23.48 CHF22.53 CHF17.92 CHF4.62<br />
Sandoz Oral Solids CHF2.73 CHF1.78 CHF1.72 CHF2.07 CHF1.96 CHF0.11<br />
Sandoz Biosimilars & DTM CHF6.37 CHF5.86 CHF6.36 CHF6.20 CHF5.83 CHF0.37<br />
Consumer (OTC) CHF4.81 *CHF4.81 *CHF4.81 CHF4.81 CHF1.39 CHF3.42<br />
Consumer (Animal Health) CHF2.06 *CHF2.06 *CHF2.06 CHF2.06 CHF0.93 CHF1.13<br />
Vaccines CHF2.64 *CHF2.64 *CHF2.64 CHF2.64 CHF0.28 CHF2.37<br />
Diagnostics CHF0.47 CHF0.50 CHF0.54 CHF0.50 CHF0.61 (CHF0.11)<br />
Roche Bearer shares ^CHF7.19 ^CHF7.19 ^CHF7.19 CHF7.19 CHF4.11 CHF3.09<br />
Other charges (Interest expense, etc) NA NA NA NA (CHF3.15) NA<br />
Net Debt - Q1 2013E (CHF5.69) (CHF5.69) (CHF5.69) (CHF5.69) NA NA<br />
Total CHF84.86 CHF83.67 CHF85.26 CHF84.59 CHF71.23 CHF15.90<br />
* Valuation based on EV/sales multiple as 2014E EBITDA & earnings are unsuitable for valuation purposes.<br />
^ Roche bearer shares valued at 30% premium to market value<br />
Source: <strong>Jefferies</strong> estimates, company data<br />
SOTP Valuation Tables<br />
EV/Sales SOTP<br />
Our EV/Sales valuation for Novartis produces a CHF84.86 per share valuation, on a sum of<br />
the parts basis. This represents a c19% premium to the current share price of CHF71.25.<br />
Exhibit 74: EV/Sales SOTP valuation summary ($m, $ or CHF per share where indicated)<br />
Division<br />
Sales<br />
2014E ($m)<br />
EV/Sales<br />
Multiple<br />
Implied value ($m)<br />
Valuation per<br />
share (CHF)<br />
Pharmaceuticals $32,213m 3.5x $112,746m CHF43.00<br />
Alcon $11,147m 5.0x $55,735m CHF21.26<br />
Sandoz (oral solids) $4,773m 1.5x $7,159m CHF2.73<br />
Sandoz (biosimilars & DTM) $4,773m 3.5x $16,704m CHF6.37<br />
Vaccines & Diagnostics (Vaccines) $1,731m 4.0x $6,925m CHF2.64<br />
Vaccines & Diagnostics (Diagnostics) $488m 2.5x $1,221m CHF0.47<br />
Consumer Health (OTC) $3,155m 4.0x $12,622m CHF4.81<br />
Consumer Health (Animal Health) $1,352m 4.0x $5,409m CHF2.06<br />
Group Sales $59,632m $218,519m CHF83.35<br />
Roche stake (at 30% market premium) $18,858m CHF7.19<br />
Net Debt - Q1 2013E ($14,909m) (CHF5.69)<br />
Average shares outstanding (Q1 2013A) 2,441<br />
Group EV/Sales (SOTP) valuation $222,469m CHF84.86<br />
Source: <strong>Jefferies</strong> estimates, company data<br />
page 50 of 92<br />
Jeffrey Holford, PhD, ACA, Equity Analyst, (212) 336-7409, jholford@jefferies.com<br />
Please see important disclosure information on pages 88 - 92 of this <strong>report</strong>.
Healthcare<br />
Rating | Target | Estimate Change<br />
May 28, 2013<br />
EV/EBITDA SOTP<br />
Our EV/EBITDA valuation for Novartis produces a CHF83.67 per share valuation, on a sum<br />
of the parts basis. This represents a c17% premium to the current share price of<br />
CHF71.25.<br />
Exhibit 75: EV/EBITDA SOTP valuation summary ($m, $ or CHF per share where indicated)<br />
EBITDA<br />
2014E<br />
($M)<br />
EBITDA<br />
Contribution<br />
2014E<br />
EV/EBITDA<br />
2014<br />
Implied value<br />
($m)<br />
Valuation per<br />
share (CHF)<br />
Pharmaceuticals 9,923 58.9% 11.0x $109,148m CHF41.63<br />
Alcon 4,282 25.4% 14.0x $59,948m CHF22.87<br />
Sandoz (oral solids) 466 2.8% 10.0x $4,659m CHF1.78<br />
Sandoz (biosimilars & DTM) 1,398 8.3% 11.0x $15,374m CHF5.86<br />
Vaccines & Diagnostics (Vaccines) 63 0.4% *NA *$6,925m *CHF2.64<br />
Vaccines & Diagnostics (Diagnostics) 147 0.9% 9.0x $1,319m CHF0.50<br />
Consumer Health (OTC) 334 2.0% *NA *$12,622m *CHF4.81<br />
Consumer Health (Animal Health) 223 1.3% *NA *$5,409m *CHF2.06<br />
Total (ex-Corporate) 16,835 100%<br />
Corporate<br />
Total EBITDA $16,835m 100% $215,404m CHF82.16<br />
Roche stake (at 30% market premium) $18,858m CHF7.19<br />
Net Debt - Q1 2013E ($14,909m) (CHF5.69)<br />
Average shares outstanding (Q1 2013A) 2,441<br />
Group EV/EBITDA (SOTP) valuation $219,353m CHF83.67<br />
* Valuation based on EV/sales multiple as 2014E EBITDA & earnings are unsuitable for valuation purposes.<br />
Source: <strong>Jefferies</strong> estimates, company data<br />
P/E Multiple valuation<br />
Our P/E multiple based valuation for Novartis produces a CHF85.26 per share valuation,<br />
on a sum of the parts basis. This represents a c20% premium to the current share price of<br />
CHF71.25.<br />
Exhibit 76: P/E SOTP valuation summary ($m, $ or CHF per share where indicated)<br />
P/E (SOTP) Summary<br />
Division<br />
Net Income<br />
2014E<br />
CORE EPS<br />
2014E<br />
P/E multiple<br />
CORE Adj.<br />
Op. Profit<br />
2014E<br />
Adj.<br />
Operating<br />
Margin<br />
2014E<br />
Valuation<br />
per share<br />
($)<br />
Valuation<br />
per share<br />
(CHF)<br />
Pharmaceuticals $9,111m 28% $7,745m $3.23 14.0x $45.26 CHF42.14<br />
Alcon $3,932m 35% $3,356m $1.40 18.0x $25.22 CHF23.48<br />
Sandoz Oral Solids $428m 9% $368m $0.15 12.0x $1.84 CHF1.72<br />
Sandoz Biosimilars & DTM $1,283m 27% $1,091m $0.46 15.0x $6.83 CHF6.36<br />
Consumer (OTC) $307m 10% $261m $0.11 *NA *$5.17 *CHF4.81<br />
Consumer (Animal Health) $205m 15% $174m $0.07 *NA *$2.22 *CHF2.06<br />
Vaccines $58m 3% $52m $0.02 *NA *$2.84 *CHF2.64<br />
Diagnostics $135m 28% $115m $0.05 12.0x $0.58 CHF0.54<br />
Roche stake (at 30% market premium) $0m $769m $0.32 $7.73 CHF7.19<br />
Other charges (Interest expense, etc) $0m ($476m) ($0.25) NA<br />
Net Debt - Q1 2013E<br />
(CHF5.69)<br />
Total $15,458 26% $13,454 $5.57 $97.68 CHF85.26<br />
* Valuation based on EV/sales multiple as 2014E EBITDA & earnings are unsuitable for valuation purposes.<br />
Source: <strong>Jefferies</strong> estimates, company data<br />
page 51 of 92<br />
Jeffrey Holford, PhD, ACA, Equity Analyst, (212) 336-7409, jholford@jefferies.com<br />
Please see important disclosure information on pages 88 - 92 of this <strong>report</strong>.
Healthcare<br />
Rating | Target | Estimate Change<br />
May 28, 2013<br />
Pfizer (Buy; PT $33)<br />
Breaking up is hard to do<br />
Pfizer has been one of the most proactive companies in the Large Cap Pharmaceuticals<br />
sector at delivering shareholder returns through cost saving, financial engineering and<br />
restructuring. The shares have been rewarded for this and investors have become hooked<br />
on restructuring in particular as the medicine to cure all its ills. The base business is still<br />
heavily weighed down by patent expiries over the next few years and although R&D<br />
productivity appears to have increased in recent years our revenue estimates remain flat<br />
between 2012A and 2017E.<br />
Pfizer has previously considered restructuring its Core Pharma business into two pieces –<br />
an ‚Innovative Core‛ and a ‚Value Core‛. The first iteration of considering this strategy<br />
concluded that this was not an option and instead Pfizer management proceeded to<br />
pursue two significant disposals, selling the Nutrition business to Nestle (NESN VX,<br />
CHF67.70, Buy) and partially divesting the Animal Health business (Zoetis) through an<br />
Initial Public Offering.<br />
Recently, management indicated that they were once again considering restructuring the<br />
Core Pharmaceuticals business. Management also stated that it would take about three<br />
years to conclude as to whether and how the Innovative Core (which we refer to as the<br />
Core Pharma business) and Value Core (which we refer to as Established Pharma)<br />
businesses are to be separated. Consumer Healthcare, which is the smallest of all the<br />
remaining business units, could also (or instead of Established Pharma) potentially be<br />
separated through a trade sale in our view.<br />
Whilst these transactions might make sense to investors, the practicalities of separating<br />
the Established Pharmaceuticals business from the Core Pharma business could be<br />
extremely problematic, leading to significant dis-synergies. The two businesses currently<br />
use common manufacturing facilities and sales infrastructure. Furthermore, the Core<br />
Pharma business ‚feeds‛ the Established Pharma business once its products experience<br />
LOEs in the major marketing territories, which would theoretically come to an end if the<br />
two were separated, making the future growth of the Established Pharma business<br />
questionable. Ian Read, Pfizer’s Chairman and CEO stated at the Q1’13 earnings call:<br />
Well, on separating the business, we already have separated the management in the US and<br />
in developed markets. The key question that we're looking at is in our BRIC-MT and our<br />
emerging markets that are very successful and growing aggressively, what would we need to<br />
do to separate out, and what would be the dynamics of that, of separating out, and what<br />
portfolio would we separate out so as to create an innovative core and a value core, and how<br />
would we allocate capabilities and assets within that. This is not a sort of trivial undertaking<br />
in an organization that's already performing so well. And then the second part would be,<br />
clearly on the manufacturing side we would want to try and identify plants that are purely of<br />
a value or established products co-type plants, and there have to be independencies, and you<br />
look at that, and then you also have to look at the tax issues as you do that. So this is, we<br />
believe, worth doing. I believe it's worth creating that separation internally, because I think it<br />
brings focus and management focus, and will improve the performance of those two<br />
businesses. But it's something that we're doing care<strong>full</strong>y, given that it's a sort of a<br />
reorganization, or a potential reorganization of emerging markets that is being so successful<br />
as is, but certainly that's some of the considerations as we go to look at this<br />
separation………………… So the underlying thesis of this is that we have an innovative core,<br />
which is focused on science and focused on selling and delivering education in a certain way,<br />
and would have an exciting pipeline that would drive substantial growth, and certain<br />
shareholders would have an appeal for that type of investment. And then we would have a<br />
page 52 of 92<br />
Jeffrey Holford, PhD, ACA, Equity Analyst, (212) 336-7409, jholford@jefferies.com<br />
Please see important disclosure information on pages 88 - 92 of this <strong>report</strong>.
Healthcare<br />
EBITDA margin (2014E)<br />
Rating | Target | Estimate Change<br />
May 28, 2013<br />
value company which has substantial cash flows, large dividend capacity, big brands in<br />
emerging markets, more of a traditional selling model, also with branded generics. But also<br />
we want to take time, as we go through the next couple of years, to see how do we<br />
strengthen both of those segments. We're strengthening innovative core with a pipeline. We<br />
also want to look at how do we strengthen the value business at the same time.”<br />
Frank D’Amelio, Pfizer’s CFO, also added:<br />
“I think what I'll add to what Ian said is, when we talk about the three years, it's really a<br />
path that's similar to what we did -- if we were to do it, a path that's similar to like the<br />
Animal Health path, where basically it's a path that we're doing it ourselves, and we set<br />
ourselves up in a position to be able to do whatever kind of optionality we want on a<br />
standalone basis. But that's what we think about when we talk about the three years.”<br />
Our sum of the parts valuation for Pfizer on the basis that it would be able to achieve<br />
separate identities and valuations for each of the key business segments is $31.87 per<br />
share versus the current price of $29.04 and our official Target Price of $33. Hence, given<br />
the significant issues facing making further moves in this direction it would seem to be a<br />
huge distraction without much reward.<br />
The only caveat to this would be if the Established Pharmaceuticals business were able to<br />
sustain at least flat revenues going forward, management could position valuation<br />
around a dividend yield. Based on using a sector average payout ratio of 50% on 2014E<br />
earnings and assuming a 4% yield, we believe that the Established Pharmaceuticals unit<br />
could achieve a valuation of $6.63. Unfortunately this is almost identical to the $6.12<br />
assumed in our mean sum of the part valuation based on 2.8x 2014E sales/ 8.5x 2014E<br />
EBITDA/ 12.8x 2014E EPS and does not help to support the argument for separating the<br />
businesses at present.<br />
Exhibit 77: 2014E EBITDA margin versus growth (2014E-17E) by division<br />
70%<br />
60%<br />
50%<br />
Core Pharma<br />
$15,330m<br />
40%<br />
30%<br />
20%<br />
Est. Pharma<br />
$5,238m<br />
Consumer Health<br />
$873m<br />
Animal Health<br />
$1,506m<br />
10%<br />
0%<br />
-15% -10% -5% 0% 5% 10% 15%<br />
EBITDA CAGR (2014E-2017E)<br />
Source: <strong>Jefferies</strong> estimates, company data<br />
page 53 of 92<br />
Jeffrey Holford, PhD, ACA, Equity Analyst, (212) 336-7409, jholford@jefferies.com<br />
Please see important disclosure information on pages 88 - 92 of this <strong>report</strong>.
Healthcare<br />
Rating | Target | Estimate Change<br />
May 28, 2013<br />
Exhibit 78, Exhibit 79 and Exhibit 80 give a snapshot of our estimates for 2014E revenues,<br />
EBITDA and EPS split across the four main business segments, which we have used as the<br />
basis for our sum of the parts calculations.<br />
Exhibit 78: Estimated 2014E revenue<br />
contribution split ($m)<br />
Animal<br />
Health<br />
$4,864m<br />
Consumer<br />
Health<br />
$3,911m<br />
Exhibit 79: Estimated 2014E EBITDA<br />
contribution split ($m)<br />
Animal<br />
Health<br />
$1,506m<br />
Consumer<br />
Health<br />
$873m<br />
Exhibit 80: Estimated 2014E EPS<br />
contribution split ($ per share)<br />
Animal<br />
Health<br />
$0.14<br />
Consumer<br />
Health<br />
$0.09<br />
Vaccines<br />
$1,995m<br />
Vaccines<br />
$0.20<br />
Vaccines<br />
$4,325m<br />
Est.<br />
Pharma<br />
$15,810m<br />
Core<br />
Pharma<br />
$26,810m<br />
Est.<br />
Pharma<br />
$5,238m<br />
Core<br />
Pharma<br />
$15,330m<br />
Est. Pharma<br />
$0.53<br />
Core<br />
Pharma<br />
$1.55<br />
Source: <strong>Jefferies</strong> estimates<br />
Source: <strong>Jefferies</strong> estimates<br />
Source: <strong>Jefferies</strong> estimates<br />
Animal Health spin out completion marginally improves 2014E EPS by c1.1%<br />
Management spun out circa 20% of Animal Health business as Zoetis in Q1’13. The<br />
market has responded positively to the Zoetis IPO with the stock price appreciating by<br />
c29% since the initial public offering price of $26 per share. Management recently<br />
announced that the remaining portion of Zoetis held by the company will be offered to<br />
investors through a share exchange offer at a 7% discount. The current offer is expected<br />
to close by 19 th June 2013. Assuming a 7% discount, we estimate the completion of the<br />
Animal Health spin out will be worth c$12.5bn against the market capitalisation of Pfizer,<br />
or c6% of its market capitalisation. However, once the lost earnings of Zoetis are<br />
accounted for we estimate this transaction will only be circa 1.1% accretive to EPS in<br />
2014E.<br />
Consumer could fetch circa $13.2bn<br />
We would expect that a divestment of the Consumer Health business could be achieved<br />
through a trade sale to another industry player, potentially, GlaxoSmithKine, Merck &<br />
Co., Johnson & Johnson, Bayer, Reckitt Benckiser, Novartis or Sanofi. We expect that such<br />
a transaction would fetch at least $13.0bn (c3.4x sales; c15.1x EBITDA; c22.8x earnings).<br />
On this basis, we estimate that such a transaction would be circa 2-3% accretive to Pfizer<br />
if the net proceeds were used to repurchase its own shares.<br />
SOTP Valuations yield c10% upside<br />
Assuming that a ‚real-world‛ sum of the parts for Pfizer is achieved by selling its<br />
Consumer Health business, completing the spin out of the Animal Health business and<br />
achieving separation of the Innovative and Value Cores within Pharmaceuticals, we<br />
estimate that the group is worth circa $31.87 per share, a c10% premium to the current<br />
share price. We have summarised the various SOTP valuations for Pfizer in this section in<br />
Exhibit 81 alongside our more conventional P/E relative valuation for the shares of $33,<br />
based on a 0-5% 2014E P/E premium to the US market.<br />
page 54 of 92<br />
Jeffrey Holford, PhD, ACA, Equity Analyst, (212) 336-7409, jholford@jefferies.com<br />
Please see important disclosure information on pages 88 - 92 of this <strong>report</strong>.
Valuation/ Share<br />
Healthcare<br />
Rating | Target | Estimate Change<br />
May 28, 2013<br />
Exhibit 81: Summary of share price evaluation by different valuation<br />
methodologies ($ per share)<br />
$40<br />
$30<br />
$33.00<br />
$30.19<br />
$33.05<br />
$32.35<br />
$20<br />
$10<br />
$0<br />
PE REL EV/Sales EV/EBITDA P/E multiple<br />
Source: <strong>Jefferies</strong> estimates<br />
The individual SOTP valuations based on EV/Sales, EV/EBITDA and P/E multiples are<br />
included in this <strong>report</strong> in Exhibit 83, Exhibit 84 and Exhibit 85.<br />
Exhibit 82 summarises these as well as providing a comparison of how the average of<br />
these valuations for each business unit compares to their valuation based on our estimate<br />
of earnings on the current group multiple.<br />
We note that the Consumer Health and Animal Health units would all be expected by us<br />
to be value creating if separated from the group assuming minimal dis-synergies and the<br />
use of the proceeds to repurchase shares at the current price. However, as already<br />
described, we believe that there would be significant dis-synergies in separating the<br />
Established Pharma business from the group and it is a questionable strategy for<br />
management to follow, or for investors to assume will occur at this time.<br />
Exhibit 82: Summary of share price evaluation by different valuation methodologies ($ per share)<br />
EV/sales EV/EBITDA P/E SOTP Mean<br />
Valuation<br />
Value at Group<br />
Multiple<br />
Multiple<br />
Arbitrage/<br />
share<br />
Core Pharma $18.44 $21.09 $20.17 $19.90 $19.61 $0.29<br />
Est. Pharma $5.87 $6.12 $6.36 $6.12 $6.70 -$0.58<br />
Vaccines $2.97 $3.02 $3.03 $3.01 $2.55 $0.46<br />
Animal Health *$1.71 *$1.71 *$1.71 $1.71 $1.39 $0.32<br />
Consumer Health $1.88 $1.80 $1.77 $1.82 $1.12 $0.70<br />
Non-operating income/(expense) NA NA NA NA ($2.33) NA<br />
Net cash/ (debt) - Q1 2013A ($0.69) ($0.69) ($0.69) ($0.69) NA NA<br />
Group $30.19 $33.05 $32.35 $31.87 $29.04 $1.19<br />
*Note: Animal Health valuation is assumed to be 80% of current Zoetis market cap at a discount of 7% as announced<br />
Source: <strong>Jefferies</strong> estimates<br />
page 55 of 92<br />
Jeffrey Holford, PhD, ACA, Equity Analyst, (212) 336-7409, jholford@jefferies.com<br />
Please see important disclosure information on pages 88 - 92 of this <strong>report</strong>.
Healthcare<br />
Rating | Target | Estimate Change<br />
May 28, 2013<br />
SOTP Valuation Tables<br />
EV/Sales valuation<br />
Our EV/Sales valuation for Pfizer yields $30.19 on a sum of the parts basis. This represents<br />
a 4% premium to the current stock price of $29.04.<br />
Exhibit 83: EV/Sales SOTP valuation summary ($m or $ per share where indicated)<br />
Sales<br />
2014E ($m)<br />
% Sales<br />
Contribution<br />
EV/Sales Multiple Implied EV ($m) Valuation per<br />
share ($)<br />
Core Pharma $26,810m 48% 5.0x $134,051m $18.44<br />
Est. Pharma $15,810m 28% 2.7x $42,686m $5.87<br />
Vaccines $4,325m 8% 5.0x $21,625m $2.97<br />
Animal Health $4,864m 9% *NA $12,447m *$1.71<br />
Consumer Health $3,911m 7% 3.5x $13,688m $1.88<br />
Group Sales $55,719m 100% $224,496m $30.88<br />
Net cash/ (debt) - Q1 2013A -$5,031m -$0.69<br />
Avg. shares outstanding (Q1 2013A) 7,269<br />
Group EV/Sales (SOTP) valuation $219,465m $30.19<br />
*Note: Animal Health valuation is assumed to be 80% of current Zoetis market cap at a 7% discount<br />
Source: <strong>Jefferies</strong> estimates<br />
EV/EBITDA valuation<br />
Our EV/EBITDA valuation for Pfizer yields $33.05 on a sum of the parts basis. This<br />
represents a 14% premium to the current stock price of $29.04.<br />
Exhibit 84: EV/EBITDA SOTP valuation summary ($m or $ per share where indicated)<br />
EBITDA<br />
2014E<br />
($M)<br />
EBITDA<br />
Contribution<br />
2014E<br />
EV/EBITDA<br />
2014<br />
Implied EV ($m)<br />
Valuation per<br />
share ($)<br />
Core Pharma $15,330m 61% 10.0x $153,296m $21.09<br />
Est. Pharma $5,238m 21% 8.5x $44,521m $6.12<br />
Vaccines $1,995m 8% 11.0x $21,949m $3.02<br />
Animal Health $1,506m 6% *NA $12,447m *$1.71<br />
Consumer Health $873m 4% 15.0x $13,094m $1.80<br />
Total EBITDA $24,942m 100% $245,306m $33.75<br />
Net cash/ (debt) - Q1 2013A -$5,031m -$0.69<br />
Avg. shares outstanding (Q1 2013A) 7,269<br />
Group EV/EBITDA (SOTP) valuation $240,275m $33.05<br />
*Note: Animal Health valuation is assumed to be 80% of current Zoetis market cap at a 7% discount<br />
Source: <strong>Jefferies</strong> estimates<br />
P/E Multiple valuation<br />
Our P/E multiple based valuation for Pfizer yields $32.35 on a sum of the parts basis. This<br />
represents a 11% premium to the current stock price of $29.04.<br />
Exhibit 85: P/E SOTP valuation summary ($m or $ per share where indicated)<br />
P/E (SOTP) Summary<br />
Operating<br />
Profit 2014E<br />
Operating<br />
Margin 2014E<br />
Net Income<br />
2014E<br />
Division<br />
EPS<br />
2014E<br />
P/E multiple<br />
Valuation per<br />
share ($)<br />
Core Pharma $14,212m 53% $10,161m $1.55 13.0x $20.17<br />
Est. Pharma $4,856m 31% $3,472m $0.53 12.0x $6.36<br />
Vaccines $1,850m 43% $1,323m $0.20 15.0x $3.03<br />
Animal Health $1,396m 29% $998m $0.14 *NA *$1.71<br />
Consumer Health $809m 21% $579m $0.09 20.0x $1.77<br />
Non-operating income/(expense) ($1,594m) - ($1,310m) ($0.20) - NA<br />
Net cash/ (debt) - Q1 2013A - - - - - -$0.69<br />
Total $23,123m 41% $15,222m $2.31 14.0x $32.35<br />
*Note: Animal Health valuation is assumed to be 80% of current Zoetis market cap at a 7% discount<br />
Source: <strong>Jefferies</strong> estimates<br />
page 56 of 92<br />
Jeffrey Holford, PhD, ACA, Equity Analyst, (212) 336-7409, jholford@jefferies.com<br />
Please see important disclosure information on pages 88 - 92 of this <strong>report</strong>.
Healthcare<br />
Rating | Target | Estimate Change<br />
May 28, 2013<br />
Roche (Buy; PT CHF285)<br />
Conglomerate premium makes restructuring<br />
unlikely<br />
Roche consists of two main divisions, Pharmaceuticals and Diagnostics, between which<br />
the actual level of synergy is frequently debated in financial markets. The majority of the<br />
value in the company has been derived from the success of the relatively focused Pharma<br />
operations in developing predominantly biologic products for the treatment of oncology,<br />
auto-immune or other difficult to treat conditions.<br />
The diagnostics division could theoretically exist as a stand-alone entity. However, the<br />
drive towards personalized medicine and the continuing growth in the use of companion<br />
diagnostics to correctly target novel treatments, which in turn helps raise their success<br />
rate, firmly links the Diagnostics division with the Core Pharma business in the eyes of<br />
management.<br />
Diagnostics itself has historically been split into five business units: Professional<br />
Diagnostics, Diabetes Care, Molecular Diagnostics, Applied Science and Tissue<br />
Diagnostics. In recent times, increasing competition and reimbursement pressures have<br />
taken their toll on both the Applied Science and Diabetes Care units. This resulted in the<br />
recent announcement that the Applied Science unit will be dissolved from the end of<br />
2013 and its functions split between the Molecular and Professional diagnostics divisions.<br />
Recent press speculation that Roche might also look to sell off the Diabetes Care unit<br />
seems unlikely for a number of reasons. Roche is already the leading global player in<br />
Diabetes care, accounting for almost a third of the market. Whilst a potential buyer might<br />
want to merge this business into its own operations and strip cost out, it would only be<br />
feasible for other major players, which would likely run into anti-trust issues. Furthermore,<br />
Bayer appears to have already tried to sell its business, unsuccess<strong>full</strong>y, at the end of 2012.<br />
Bayer has about a 14% share of the Diabetes market and newswires suggested no buyers<br />
could be found at an agreeable valuation.<br />
Specific commentary on the matter from Roche highlights the fundamental attractiveness<br />
of the diabetes market and the cashflow generated by the division. At the Q4’12 results<br />
Roland Diggelmann (Diagnostics COO) said, “….on diabetes care, which continues to be a<br />
very attractive market…..that has 370 million patients worldwide, patient population<br />
growing in both the developed and the emerging markets, and also a business with a strong<br />
cash flow. We have a good, strong portfolio in this area. We want to continue to provide<br />
differentiated solutions ……..some integrated solutions.……We have already restructured<br />
parts of the business……and we continue to look at our cost base as we go forward to adjust<br />
to the new realities in the marketplace.”<br />
Other major players in the Diabetes Care market include Lifescan (Johnson & Johnson),<br />
c26% market share; Bayer, c14% and Abbott c14%.<br />
page 57 of 92<br />
Jeffrey Holford, PhD, ACA, Equity Analyst, (212) 336-7409, jholford@jefferies.com<br />
Please see important disclosure information on pages 88 - 92 of this <strong>report</strong>.
Healthcare<br />
EBITDA margin (2014E)<br />
Rating | Target | Estimate Change<br />
May 28, 2013<br />
Exhibit 86: 2012A EBITDA margin versus growth (2014E-17E) by division<br />
70%<br />
60%<br />
50%<br />
40%<br />
30%<br />
Pharmaceuticals,<br />
CHF18,028m<br />
20%<br />
10%<br />
Diagnostics, CHF2,416m<br />
0%<br />
-2% 0% 2% 4% 6% 8% 10%<br />
EBITDA CAGR (2014E-2017E)<br />
Source: <strong>Jefferies</strong> estimates, company data<br />
Exhibit 87 to Exhibit 89 highlight the dominance of the Pharmaceuticals division, both in<br />
terms of profit contribution and in being the main engine of growth. However,<br />
management continues to believe that the Diagnostics business has strategic value in the<br />
future of Roche’s ability to compete in companion diagnostics beyond its relatively<br />
modest earnings contribution to the group.<br />
Exhibit 87: Estimated 2014E revenue<br />
contribution split (CHFm)<br />
Exhibit 88: Estimated 2014E EBITDA<br />
contribution split (CHFm)<br />
Exhibit 89: Estimated 2014E EPS<br />
contribution split (CHF per share)<br />
Diagnostics<br />
CHF10,774m<br />
Diagnostics<br />
CHF2,416m<br />
Diagnostics<br />
CHF2.00<br />
Pharmaceuticals<br />
CHF36,985m<br />
Pharmaceuticals<br />
CHF18,028m<br />
Pharmaceuticals<br />
CHF14.95<br />
Source: <strong>Jefferies</strong> estimates<br />
Source: <strong>Jefferies</strong> estimates<br />
Source: <strong>Jefferies</strong> estimates<br />
SOTP Valuations yield c11% upside<br />
We have carried out sum of the parts valuations utilising EV/Sales, EV/EBITDA and P/E<br />
calculations. As summarized in Exhibit 90 the different methodologies yield a range of<br />
share price valuations from CHF276.14 per share based on EV/Sales and up to CHF284.67<br />
based on P/E multiples, with a mean valuation of CHF280.08. This represents potential<br />
upside of between 9% and 12%, versus the current share price of CHF253.10. Our current<br />
target priced based on valuing the 2014E earnings at a 25% to 30% P/E relative premium<br />
to the Swiss market is CHF285.<br />
page 58 of 92<br />
Jeffrey Holford, PhD, ACA, Equity Analyst, (212) 336-7409, jholford@jefferies.com<br />
Please see important disclosure information on pages 88 - 92 of this <strong>report</strong>.
Valuation/Share (CHF)<br />
Healthcare<br />
Rating | Target | Estimate Change<br />
May 28, 2013<br />
Exhibit 90: Summary of share price evaluation by different valuation<br />
methodologies (CHF per share)<br />
300<br />
250<br />
CHF285.00<br />
CHF276.14 CHF279.44 CHF284.67<br />
200<br />
150<br />
100<br />
50<br />
0<br />
PE (REL) EV/Sales (SOTP) EV/EBITDA P/E Multiple<br />
Source: <strong>Jefferies</strong> estimates<br />
Summary of valuation methodologies<br />
The individual SOTP calculations based on EV/Sales, EV/EBITDA, and P/E multiples are<br />
shown below in Exhibit 92, Exhibit 93 and Exhibit 94. As can be seen in Exhibit 91, which<br />
provides a summary of the different methodologies used, we believe that separating the<br />
Diagnostics division from the rest of the business would actually be dilutive to<br />
shareholders as it would be unlikely to achieve the group multiple as a standalone entity.<br />
For this reason, as well as management’s general aversion to any kind of restructuring we<br />
believe that separation of the Diagnostics division is highly unlikely. Instead we believe<br />
that Roche is more likely to add further businesses to both its Pharmaceuticals and<br />
Diagnostics divisions. We see AbbVie as a logical ‚bolt-on‛ to the Pharmaceuticals division<br />
to create another major business outside of oncology, whilst management also appear to<br />
be actively pursuing various strategies to add additional sequencing platforms to the<br />
Diagnostics division.<br />
Exhibit 91: Summary of share price evaluation by different valuation methodologies (CHF per share)<br />
Division EV/Sales EV/EBITDA P/E SOTP Mean<br />
Valuation<br />
Value at Group<br />
Multiple<br />
Arbitrage /<br />
Share<br />
Pharmaceuticals CHF259.55 CHF263.58 CHF269.03 CHF264.05 CHF243.68 CHF20.37<br />
Diagnostics CHF28.98 CHF28.26 CHF28.04 CHF28.43 CHF32.66 (CHF4.23)<br />
Other charges (Interest expense, etc) NA NA NA NA (CHF23.24) NA<br />
Net Debt - 2012A (CHF12.40) (CHF12.40) (CHF12.40) (CHF12.40) NA NA<br />
Total CHF276.14 CHF279.44 CHF284.67 CHF280.08 CHF253.10 CHF16.14<br />
Source: <strong>Jefferies</strong> estimates, company data<br />
page 59 of 92<br />
Jeffrey Holford, PhD, ACA, Equity Analyst, (212) 336-7409, jholford@jefferies.com<br />
Please see important disclosure information on pages 88 - 92 of this <strong>report</strong>.
Healthcare<br />
Rating | Target | Estimate Change<br />
May 28, 2013<br />
SOTP Valuation Tables<br />
EV/Sales valuation<br />
Our EV/Sales valuation for Roche yields CHF276.14 on a sum of the parts basis. This<br />
represents c9% upside to the current share price of CHF253.10.<br />
Exhibit 92: EV/Sales SOTP valuation summary (CHFm or CHF per share where indicated)<br />
Division<br />
Exhibit Sales<br />
2014E (CHFm)<br />
% Sales<br />
Contribution<br />
EV/Sales Multiple<br />
Implied EV<br />
(CHFm)<br />
Valuation per<br />
share (CHF)<br />
Pharmaceuticals CHF36,985m 77% 6.0x CHF221,908m CHF259.55<br />
Diagnostics CHF10,774m 23% 2.3x CHF24,781m CHF28.98<br />
Group Sales CHF47,759m 100% CHF246,689m CHF288.53<br />
Net Debt - 2012A (CHF10,599m) (CHF12.40)<br />
Average shares outstanding (2012A) 855.0<br />
Group EV/Sales (SOTP) valuation CHF236,090m CHF276.14<br />
Source: <strong>Jefferies</strong> estimates, company data<br />
EV/EBITDA valuation<br />
Our EV/EBITDA valuation for Roche yields CHF279.44 on a sum of the parts basis. This<br />
represents c10% upside to the current share price of CHF253.10.<br />
Exhibit 93: EV/EBITDA SOTP valuation summary (CHFm or CHF per share where indicated)<br />
EBITDA<br />
2014E<br />
(CHFm)<br />
EBITDA<br />
Contribution<br />
2014E<br />
EV/EBITDA<br />
2014<br />
Implied value<br />
(CHFm)<br />
Valuation per<br />
share (CHF)<br />
Pharmaceuticals CHF 18,028 88.2% 12.5x CHF225,351 CHF263.58<br />
Diagnostics CHF 2,416 11.8% 10.0x CHF24,160 CHF28.26<br />
Total CHF 20,444 100% CHF 249,512<br />
Net Debt - 2012A (CHF10,599) (CHF12.40)<br />
Average shares outstanding (2012A) 855<br />
Group EV/EBITDA (SOTP) valuation CHF 238,913 CHF279.44<br />
Source: <strong>Jefferies</strong> estimates, company data<br />
P/E Multiple valuation<br />
Our P/E multiple based valuation for Roche yields CHF284.67 on a sum of the parts basis.<br />
This represents c12% upside to the current share price of CHF253.10.<br />
Exhibit 94: P/E SOTP valuation summary (CHFm or CHF per share where indicated)<br />
P/E (SOTP) Summary<br />
Division<br />
2014E CORE<br />
Adj. Op. Profit<br />
2014E Adj. Op.<br />
Profit Margin<br />
2014E Net<br />
Income<br />
2014E CORE<br />
EPS<br />
2014E P/E<br />
multiple<br />
2014E<br />
Valuation/<br />
Share (CHF)<br />
Pharmaceuticals CHF16,512m 45% CHF12,786m CHF14.95 18.0x CHF269.03<br />
Diagnostics CHF2,213m 21% CHF1,714m CHF2.00 14.0x CHF28.04<br />
Other charges (Interest expense, etc) (CHF1,219m) (CHF1.43) NA<br />
Net Debt - 2012A<br />
(CHF12.40)<br />
Total CHF18,725m 39% CHF13,280m CHF15.52 CHF284.67<br />
Source: <strong>Jefferies</strong> estimates, company data<br />
page 60 of 92<br />
Jeffrey Holford, PhD, ACA, Equity Analyst, (212) 336-7409, jholford@jefferies.com<br />
Please see important disclosure information on pages 88 - 92 of this <strong>report</strong>.
Healthcare<br />
EBITDA margin (2014E)<br />
Rating | Target | Estimate Change<br />
May 28, 2013<br />
Sanofi (Buy; PT €100)<br />
Hidden Value, But Little Pressure To Act<br />
With Sanofi set to return to sustained double-digit earnings growth from Q4’13, we see<br />
little pressure for management to embark on re-structuring or disposals beyond perhaps<br />
Western European Established Products. Each of the non-pharmaceutical divisions are key<br />
parts of management’s growth strategy, being identified growth drivers which form part<br />
of the company’s long-term guidance. In addition, none of the non-pharmaceuticals<br />
divisions are sub-scale in our view and all contribute towards earnings growth in a<br />
meaningful way.<br />
There remains the possibility for specific disposals of sub-segments of these divisions<br />
(either by product type, therapy area, or geography). A sub-segment of the<br />
Pharmaceuticals division we have termed ‚Western European Established Products‛ is a<br />
possible divestment or Joint Venture opportunity and consists of Western European tail<br />
products which were recently mentioned by management as an area they are considering<br />
strategic options for.<br />
Restructuring options exist, but no need to exploit them<br />
We see Animal Health and the Vaccines businesses as being assets which are set to<br />
perform well, with comparable margins to Core Pharmaceuticals and double digit EBITDA<br />
CAGR (2014E-2014E). In addition the Vaccines business is too large and well-integrated<br />
with the Pharmaceuticals business to be considered as a spin-off. With below Group<br />
estimated EBITDA margins and growth, Generics and Consumer Health business units<br />
may be seen as viable divestment options. However both divisions remain integral to<br />
management’s strategy for diversified growth drivers, benefit from switching of products<br />
from the Core Pharma sub-segment post-LOE (e.g. Allegra to Consumer; Lovenox to<br />
generics) and the Generics business may be slightly dilutive if sold (0.3% by our<br />
estimates).<br />
Exhibit 95: 2014E EBITDA margin versus growth (2014E-17E) by division<br />
60%<br />
50%<br />
40%<br />
30%<br />
20%<br />
Western European<br />
Established<br />
Products, € 967m<br />
Consumer Health,<br />
€ 1,036m<br />
Animal health,<br />
€ 891m<br />
Generics, € 594m<br />
Core pharma,<br />
€ 8,693m<br />
Vaccines, € 1,630m<br />
10%<br />
0%<br />
-10% -5% 0% 5% 10% 15%<br />
EBITDA CAGR (2014E-2017E)<br />
Source: <strong>Jefferies</strong> estimates<br />
page 61 of 92<br />
Jeffrey Holford, PhD, ACA, Equity Analyst, (212) 336-7409, jholford@jefferies.com<br />
Please see important disclosure information on pages 88 - 92 of this <strong>report</strong>.
Healthcare<br />
Rating | Target | Estimate Change<br />
May 28, 2013<br />
Exhibit 96, Exhibit 97 and Exhibit 98 give a snapshot of our estimates for 2014E revenues,<br />
EBITDA and EPS split across six business segments, which we have used as the basis for<br />
our sum of the parts calculations.<br />
Exhibit 96: Estimated 2014E revenue<br />
contribution split (€m)<br />
Animal<br />
health ,<br />
€ 2,385m<br />
Vaccines,<br />
€ 4,728m<br />
Generics,<br />
€ 1,988m<br />
Consumer<br />
Health,<br />
€ 3,361m<br />
Western<br />
European<br />
Established<br />
Products,<br />
€ 3,481m<br />
Exhibit 97: Estimated 2014E EBITDA<br />
contribution split (€m)<br />
Animal<br />
health,<br />
€ 891m<br />
Vaccines,<br />
€ 1,630m<br />
Generics,<br />
€ 594m<br />
Consumer<br />
Health,<br />
€ 1,036m<br />
Western<br />
European<br />
Established<br />
Products,<br />
€ 967m<br />
Exhibit 98: Estimated 2014E EPS<br />
contribution split (€ per share)<br />
Animal<br />
health,<br />
€ 0.45<br />
Vaccines,<br />
€ 0.83<br />
Generics,<br />
€ 0.30<br />
Consumer<br />
health,<br />
€ 0.52 Western<br />
European<br />
Established<br />
Products,<br />
€ 0.49<br />
Core<br />
Pharma,<br />
€ 20,852m<br />
Core<br />
Pharma,<br />
€ 8,693m<br />
Core<br />
Pharma,<br />
€ 4.40<br />
Source: <strong>Jefferies</strong> estimates<br />
Source: <strong>Jefferies</strong> estimates<br />
Source: <strong>Jefferies</strong> estimates<br />
Consumer Health is more likely an acquirer than divestment option<br />
Although we estimate the Consumer Health EBITDA margin to be below the group<br />
average (31% vs. 37.5% in 2014E), EBITDA growth is expected to be strong 2014E-2017E<br />
(7.7% CAGR). Sanofi completed the takeover of Chattem in March 2010, significantly<br />
increasing its Consumer Health presence in the US. The acquisition cost was c.$1.9bn,<br />
with Chattem recording sales in 2009 of $463m (sales multiple of 4.1x). More recently,<br />
Sanofi has bolstered the division with bolt-on acquisitions. For example, in January 2013,<br />
Sanofi Consumer Health division completed the acquisition of the global rights to the<br />
Rolaids brand from McNeil (part of Johnson & Johnson).<br />
We would not expect any significant divestments from the Consumer Health division.<br />
However, based on our mean valuation across the SOTP methodologies (Exhibit 100) of<br />
€10.82, we would expect any trade sale of Consumer Health to generate c.€14.3bn. This<br />
would represent a 2014E sales multiple of 4.2x, EBITDA multiple of 13.8x, and P/E<br />
Multiple of 20.8x.<br />
Western European Established Products could be divested or form a JV<br />
Sanofi management has recently commented about exploring options with Western<br />
European tail products. This follows Pfizer’s and GlaxoSmithKline’s moves to separately<br />
<strong>report</strong> tail products in Established Products business units and talk openly about potential<br />
divestment options in the future.<br />
Sanofi view Emerging Market ‚Other Rx Drugs‛ as growth drivers, but see possible<br />
options for Western European Other Rx Drugs which are essentially tail products declining<br />
rapidly due to austerity measures and increased generic utilization. Although we would<br />
not expect any action in the short-term, Sanofi is exploring options with Western<br />
European tail products to enhance shareholder value. On the Q1’13 results call,<br />
Christopher Viehbacher (CEO) stated:<br />
“it [European tail products] is clearly dilutive to growth, and so we are looking at options<br />
about what we might do… I think there are a number of moves that one could potentially<br />
make, and if we could find a way that enhances shareholder value on that then we'll do so.<br />
So, yes, we are open to it but haven't found really quite yet exactly how to do this in a<br />
shareholder enhancing way.”<br />
page 62 of 92<br />
Jeffrey Holford, PhD, ACA, Equity Analyst, (212) 336-7409, jholford@jefferies.com<br />
Please see important disclosure information on pages 88 - 92 of this <strong>report</strong>.
Healthcare<br />
Valuation Per Share (Euros)<br />
Rating | Target | Estimate Change<br />
May 28, 2013<br />
Western European ‚Other Rx Drugs‛ generated sales of €4.5bn in 2012A, but have been<br />
declining rapidly. We expect a sales CAGR of -10% 2012A-2017E. If this was formed into a<br />
separate Western European Established Products business unit, several options would be<br />
available for Sanofi management.<br />
As described by GlaxoSmithKline management recently, Established Products businesses<br />
would be amenable to a Joint Venture structure where efficiencies could be maximised.<br />
We could see such a deal in Western Europe being established between a number of<br />
Large-Cap Pharmaceuticals players, including Sanofi and GlaxoSmithKline. Alternatively,<br />
trade sales of Individual brands, therapy areas or geographies within the Western<br />
European Established Products business is also a possibility. Such brands could be<br />
attractive for local European Speciality Pharmaceuticals companies. A wholesale<br />
divestment through a trade sale or IPO of a Western European Established Products<br />
business seems unlikely to us.<br />
Based on our mean valuation across the SOTP methodologies (Exhibit 100) of €5.94, we<br />
would expect any trade sale of Western European Established Products to generate<br />
c.€7.8bn. This would represent a 2014E sales multiple of 2.2x, EBITDA multiple of 8.1x,<br />
and P/E Multiple of 12.2x. We note that based on our estimates such a transaction might<br />
be slightly dilutive if achieved (-0.3%).<br />
SOTP Valuations yield c.21% upside<br />
Assuming that a ‚real-world‛ sum of the parts for Sanofi is achieved by divesting its<br />
Consumer Health, Animal Health, Vaccines and Western European Established Products<br />
businesses we estimate that the group is worth circa €102 per share, a c21% premium to<br />
the current share price. We have summarised the various SOTP valuations for Sanofi in<br />
this section in Exhibit 99 alongside our more conventional P/E relative valuation for the<br />
shares (based on 30-35% 2014E P/E premium to the French market).<br />
Exhibit 99: Summary of share price evaluation by different valuation<br />
methodologies (€ per share)<br />
120<br />
100<br />
€ 100.00 € 102.24 € 103.59 € 101.19<br />
80<br />
60<br />
40<br />
20<br />
0<br />
PE (Market<br />
premium/ discount)<br />
EV/Sales (SOTP) EV/EBITDA PE (SOTP)<br />
Source: <strong>Jefferies</strong> estimates<br />
Summary of valuation methodologies<br />
The individual SOTP valuations based on EV/Sales, EV/EBITDA and P/E multiples are<br />
included in this <strong>report</strong> in Exhibit 101, Exhibit 102, and Exhibit 103.<br />
Exhibit 100 summarises these as well as providing a comparison of how the average of<br />
these valuations for each business unit compares to their valuation based on our estimate<br />
of earnings on the current Group multiple.<br />
page 63 of 92<br />
Jeffrey Holford, PhD, ACA, Equity Analyst, (212) 336-7409, jholford@jefferies.com<br />
Please see important disclosure information on pages 88 - 92 of this <strong>report</strong>.
Healthcare<br />
Rating | Target | Estimate Change<br />
May 28, 2013<br />
We note that the Consumer Health, Animal Health and Vaccines units would all be<br />
expected by us to be value creating if separated from the group assuming minimal dissynergies<br />
and the use of the proceeds to repurchase shares at the current price. However,<br />
we think that there would be significant dis-synergies in separating the Vaccines business<br />
from the Group and it is a very unlikely path for management to go down at this time. In<br />
addition, Consumer Health and Animal Health are core growth drivers for management.<br />
Exhibit 100: Summary of share price evaluation by different valuation methodologies (€ per share)<br />
EV/Sales EV/EBITDA P/E SOTP Mean<br />
Valuation<br />
Value at<br />
Group<br />
Multiple<br />
Multiple<br />
Arbitrage/<br />
share<br />
Pharmaceuticals €85.95 €87.12 €86.03 €86.37 €70.78 €15.59<br />
Generics €3.32 €3.60 €3.61 €3.51 €3.72 (€0.21)<br />
Consumer health €10.19 €11.77 €10.49 €10.82 €6.49 €4.32<br />
Western European Established Products €6.07 €5.86 €5.88 €5.94 €6.06 (€0.13)<br />
Core Pharma €66.38 €65.88 €66.05 €66.10 €54.50 €11.60<br />
Animal health €8.13 €8.44 €8.12 €8.23 €5.59 €2.65<br />
Vaccines €14.33 €14.20 €13.21 €13.92 €10.22 €3.70<br />
Others (net financial income, etc.) NA NA NA NA (€2.07) NA<br />
Net Debt - 2012A (€6.18) (€6.18) (€6.18) (€6.18) NA NA<br />
Group €102.24 €103.59 €101.19 €102.34 €84.51 €21.93<br />
Source: <strong>Jefferies</strong> estimates, company data<br />
SOTP Valuation Tables<br />
EV/Sales<br />
Our EV/Sales valuation for Sanofi yields €102.24 on a sum of the parts basis. This<br />
represents a 21% premium to the current stock price of €84.51.<br />
Exhibit 101: EV/Sales SOTP valuation summary (€m or € per share where indicated)<br />
Sales<br />
2014E (€m)<br />
% Sales<br />
Contribution<br />
EV/Sales<br />
Multiple<br />
Implied value<br />
(€m)<br />
Implied Share<br />
Price (€)<br />
Pharmaceuticals division € 29,683m 81% 3.8x € 113,405m € 85.95<br />
Generics € 1,988m 5% 2.2x € 4,375m € 3.32<br />
Consumer Health € 3,361m 9% 4.0x € 13,443m € 10.19<br />
Western European Established Products € 3,481m 9% 2.3x € 8,007m € 6.07<br />
Core Pharma € 20,852m 57% 4.2x € 87,580m € 66.38<br />
Animal health € 2,385m 6% 4.5x € 10,734m € 8.13<br />
Vaccines € 4,728m 13% 4.0x € 18,911m € 14.33<br />
Group Sales € 36,796m 100% € 143,049m<br />
Net Debt - 2012A -€ 8,150m -€ 6.18<br />
Average shares outstanding (2012A) € 1,319<br />
Group EV/Sales (SOTP) valuation € 134,899m € 102.24<br />
Source: <strong>Jefferies</strong> estimates, company data<br />
page 64 of 92<br />
Jeffrey Holford, PhD, ACA, Equity Analyst, (212) 336-7409, jholford@jefferies.com<br />
Please see important disclosure information on pages 88 - 92 of this <strong>report</strong>.
Healthcare<br />
Rating | Target | Estimate Change<br />
May 28, 2013<br />
EV/EBITDA<br />
Our EV/EBITDA valuation for Sanofi yields €103.59 on a sum of the parts basis. This<br />
represents a 23% premium to the current stock price of €84.51.<br />
Exhibit 102: EV/EBITDA SOTP valuation summary (€m or € per share where indicated)<br />
EBITDA 2014E<br />
(€m)<br />
EBITDA<br />
Contribution<br />
2014E<br />
EV/EBITDA<br />
2014<br />
Implied EV (€m)<br />
Valuation per<br />
share ($)<br />
Pharmaceuticals € 11,290m 81.7% 10.2x € 114,953m € 87.12<br />
Generics € 594m 4.3% 8.0x € 4,751m € 3.60<br />
Consumer Health € 1,036m 7.5% 15.0x € 15,537m € 11.77<br />
Western European Established Products € 967m 7.0% 8.0x € 7,734m € 5.86<br />
Core Pharma € 8,693m 62.9% 10.0x € 86,932m € 65.88<br />
Animal health € 891m 6.5% 12.5x € 11,137m € 8.44<br />
Vaccines € 1,630m 11.8% 11.5x € 18,743m € 14.20<br />
Total EBITDA € 13,810m 100% € 144,832m € 110<br />
Net Debt - 2012A -€ 8,150m -€ 6.18<br />
Implied Market Cap 136,682<br />
Average shares outstanding (2012A) 1,319<br />
Group EV/EBITDA (SOTP) valuation € 103.59<br />
Source: <strong>Jefferies</strong> estimates, company data<br />
P/E Multiple valuation<br />
Our P/E multiple based valuation for Sanofi yields €101.19 on a sum of the parts basis.<br />
This represents a 20% premium to the current stock price of €84.51.<br />
Exhibit 103: P/E SOTP valuation summary (€m or € per share where indicated)<br />
P/E (SOTP) Summary<br />
Business Op.<br />
Profit<br />
Operating<br />
Margin 2014E<br />
Business net<br />
income<br />
Business EPS<br />
(€)<br />
P/E multiple<br />
Valuation/<br />
Share (€)<br />
Pharmaceuticals € 10,292m 34.7% € 7,490m € 5.72 15.0x € 86.03<br />
Generics € 541m 27.2% € 394m € 0.30 12.0x € 3.61<br />
Consumer health € 944m 28.1% € 687m € 0.52 20.0x € 10.49<br />
Western European Established Products € 881m 25.3% € 641m € 0.49 12.0x € 5.88<br />
Core Pharma € 7,925m 38.0% € 5,767m € 4.40 15.0x € 66.05<br />
Animal health € 812m 34.1% € 591m € 0.45 18.0x € 8.12<br />
Vaccines € 1,486m 31.4% € 1,081m € 0.83 16.0x € 13.21<br />
Others (net financial income) -€ 301m - -€ 219m -€ 0.17 - NA<br />
Net cash/ (debt) - 2012A - - - - - -€ 6.18<br />
Group € 12,590m 34.2% € 8,943m € 6.83 € 101.19<br />
Source: <strong>Jefferies</strong> estimates, company data<br />
page 65 of 92<br />
Jeffrey Holford, PhD, ACA, Equity Analyst, (212) 336-7409, jholford@jefferies.com<br />
Please see important disclosure information on pages 88 - 92 of this <strong>report</strong>.
PE Relative to Local Market (%)<br />
Healthcare<br />
Rating | Target | Estimate Change<br />
May 28, 2013<br />
Appendix I: Valuation Tables and Charts<br />
Exhibit 104: Summary valuation tables for European Pharmaceuticals coverage<br />
Company P/E P/E P/E P/E P/E P/E Dividend Dividend Dividend Dividend Dividend Dividend<br />
2012A 2013E 2014E 2015E 2016E 2017E Yield Yield Yield Yield Yield Yield<br />
(x) (x) (x) (x) (x) (x) 2012A 2013E 2014E 2015E 2016E 2017E<br />
AstraZeneca 7.6 10.3 11.4 11.1 10.7 10.8 5.4% 5.4% 5.4% 5.4% 5.4% 5.4%<br />
Bayer 15.8 14.8 12.9 11.4 10.0 8.9 2.1% 2.3% 2.5% 2.7% 2.8% 3.0%<br />
GlaxoSmithKline 15.7 14.8 13.3 12.7 11.1 9.6 4.2% 4.5% 4.7% 4.9% 5.3% 5.7%<br />
Novartis 14.2 14.6 13.3 11.9 11.1 10.0 3.2% 3.3% 3.6% 4.0% 4.4% 4.9%<br />
Novo Nordisk 24.9 20.6 18.6 16.5 14.6 13.1 1.9% 2.3% 2.5% 2.8% 3.2% 3.5%<br />
Roche 18.8 17.4 16.3 15.0 13.5 12.1 2.9% 3.1% 3.3% 3.6% 4.0% 4.5%<br />
Sanofi 13.8 15.1 12.4 10.7 9.2 8.1 3.3% 3.3% 4.0% 4.7% 5.4% 6.2%<br />
Pan Euro Sector (wtd) 16.2 15.7 14.2 12.9 11.6 10.4 3.2% 3.4% 3.7% 4.0% 4.4% 4.8%<br />
Pan Euro Sector (u/wtd) 15.8 15.4 14.0 12.7 11.5 10.4 3.3% 3.5% 3.7% 4.0% 4.4% 4.7%<br />
Company PE rel to PE rel to PE rel to PE rel to PE rel to PE rel to PE rel to PE rel to PE rel to PE rel to PE rel to PE rel to<br />
Local Mkt Local Mkt Local Mkt Local Mkt Local Mkt Local Mkt Sector Sector Sector Sector Sector Sector<br />
2012A (%) 2013E (%) 2014E (%) 2015E (%) 2016E (%) 2017E (%) 2012A (%) 2013E (%) 2014E (%) 2015E (%) 2016E (%) 2017E (%)<br />
AstraZeneca 59 83 101 106 108 115 47 65 80 86 92 104<br />
Bayer 141 120 119 116 108 100 98 94 91 88 87 85<br />
GlaxoSmithKline 122 120 118 122 112 102 97 95 94 98 96 92<br />
Novartis 83 92 93 93 90 85 88 93 93 93 95 96<br />
Novo Nordisk 127 122 130 131 128 125 154 131 131 127 126 126<br />
Roche 110 110 114 116 110 103 116 111 114 116 117 116<br />
Sanofi 107 118 110 105 95 88 85 96 87 83 79 78<br />
Pan Euro Sector (wtd) 107 110 111 112 106 100 - - - - - -<br />
Pan Euro Sector (u/wtd) 107 109 112 113 108 103 - - - - - -<br />
Company EV/EBITDA EV/EBITDA EV/EBITDA EV/EBITDA EV/EBITDA EV/EBITDA EV/Sales EV/Sales EV/Sales EV/Sales EV/Sales EV/Sales<br />
2012A 2013E 2014E 2015E 2016E 2017E 2012A 2013E 2014E 2015E 2016E 2017E<br />
(X) (X) (X) (X) (X) (X) (X) (X) (X) (X) (X) (X)<br />
AstraZeneca 6.6 8.1 9.0 8.6 8.2 8.0 2.5 2.7 2.8 2.8 2.8 2.7<br />
Bayer 9.3 8.6 7.5 6.5 5.5 4.6 1.9 1.8 1.6 1.4 1.2 1.1<br />
GlaxoSmithKline 11.3 11.2 10.5 10.2 9.2 8.1 3.9 3.8 3.6 3.5 3.2 2.9<br />
Novartis 11.6 11.7 10.8 9.8 9.2 8.3 3.4 3.2 3.0 2.9 2.7 2.5<br />
Novo Nordisk 16.2 14.7 13.3 12.2 11.3 10.7 6.7 6.2 5.7 5.3 5.0 4.8<br />
Roche 12.1 11.3 10.6 9.6 8.6 7.5 5.0 4.8 4.5 4.2 3.8 3.4<br />
Sanofi 9.3 10.1 8.5 7.5 6.6 5.9 3.5 3.5 3.2 3.0 2.8 2.5<br />
Pan Euro Sector (wtd) 11.2 11.0 10.1 9.3 8.4 7.5 4.0 3.8 3.6 3.4 3.1 2.9<br />
Pan Euro Sector 10.9 10.8 10.0 9.2 8.4 7.6 3.8 3.7 3.5 3.3 3.1 2.9<br />
Source: Thomson One DataStream, <strong>Jefferies</strong> estimates<br />
Exhibit 105: P/E relative against local domestic stock market in 2014E and 2017E for Large Cap European<br />
Pharmaceuticals<br />
35<br />
30<br />
25<br />
20<br />
15<br />
10<br />
5<br />
0<br />
-5<br />
-10<br />
-15<br />
-20<br />
NOVO<br />
2014<br />
BAYN<br />
2014<br />
GSK<br />
2014<br />
ROG<br />
2014<br />
SAN<br />
2014<br />
AZN<br />
2014<br />
NOVN<br />
2014<br />
NOVO<br />
2017<br />
AZN<br />
2017<br />
ROG<br />
2017<br />
GSK<br />
2017<br />
BAYN<br />
2017<br />
SAN<br />
2017<br />
NOVN<br />
2017<br />
Source: Thomson One DataStream, <strong>Jefferies</strong> estimates<br />
page 66 of 92<br />
Jeffrey Holford, PhD, ACA, Equity Analyst, (212) 336-7409, jholford@jefferies.com<br />
Please see important disclosure information on pages 88 - 92 of this <strong>report</strong>.
PE Relative to Local Market (%)<br />
Healthcare<br />
Rating | Target | Estimate Change<br />
May 28, 2013<br />
Exhibit 106: Summary valuation tables for US Pharmaceuticals coverage<br />
Company P/E P/E P/E P/E P/E P/E Dividend Dividend Dividend Dividend Dividend Dividend<br />
2012A 2013E 2014E 2015E 2016E 2017E Yield Yield Yield Yield Yield Yield<br />
(x) (x) (x) (x) (x) (x) 2012A 2013E 2014E 2015E 2016E 2017E<br />
Abbott 21.7 18.2 14.8 12.2 10.5 9.1 na 1.5% 1.8% 2.1% 2.4% 2.7%<br />
AbbVie* na 14.6 14.2 11.9 10.0 8.5 na 3.5% 3.6% 4.2% 5.0% 5.9%<br />
Bristol-Myers 23.8 25.9 23.0 21.2 18.4 14.9 2.9% 3.0% 3.0% 3.1% 3.2% 3.2%<br />
Johnson & Johnson 17.0 15.8 14.3 13.3 13.1 12.2 2.8% 3.0% 3.3% 3.6% 3.8% 4.0%<br />
Eli Lilly 16.0 14.0 20.0 18.9 15.6 19.2 3.6% 3.6% 3.6% 3.6% 3.6% 3.6%<br />
Merck & Co. 12.3 13.7 12.8 12.1 11.0 10.4 3.6% 3.7% 3.9% 4.2% 4.6% 5.0%<br />
Pfizer 13.3 13.0 12.5 12.1 11.9 11.0 3.0% 3.3% 3.7% 4.0% 4.4% 5.0%<br />
Zoetis 31.0 23.4 19.7 18.1 15.7 13.7 0.0% 0.8% 0.9% 1.0% 1.1% 1.3%<br />
US Sector (wtd) 15.1 15.7 14.9 13.8 12.7 11.9 2.6% 3.1% 3.4% 3.7% 4.0% 4.3%<br />
US Sector (u/wtd) 19.3 17.3 16.4 15.0 13.3 12.4 2.6% 2.8% 3.0% 3.2% 3.5% 3.9%<br />
Company PE rel to PE rel to PE rel to PE rel to PE rel to PE rel to PE rel to PE rel to PE rel to PE rel to PE rel to PE rel to<br />
Local Mkt Local Mkt Local Mkt Local Mkt Local Mkt Local Mkt Sector Sector Sector Sector Sector Sector<br />
2012A (%) 2013E (%) 2014E (%) 2015E (%) 2016E (%) 2017E (%) 2012A (%) 2013E (%) 2014E (%) 2015E (%) 2016E (%) 2017E (%)<br />
Abbott 133 119 108 98 89 81 na 116 99 89 82 77<br />
AbbVie* na 95 103 96 85 76 na 93 95 86 79 71<br />
Bristol-Myers 145 169 167 170 156 133 148 164 154 153 144 125<br />
Johnson & Johnson 104 103 104 107 111 109 106 101 96 96 103 103<br />
Eli Lilly 97 91 146 151 133 171 99 89 134 137 123 162<br />
Merck & Co. 75 89 93 97 93 93 77 87 86 87 86 87<br />
Pfizer 81 85 91 97 101 98 83 82 84 87 94 93<br />
Zoetis 189 153 143 146 134 123 193 149 132 131 123 116<br />
US Sector (wtd) 92 103 109 111 108 106 - - - - - -<br />
US Sector (u/wtd) 118 113 119 120 113 111 - - - - - -<br />
Company EV/EBITDA EV/EBITDA EV/EBITDA EV/EBITDA EV/EBITDA EV/EBITDA EV/Sales EV/Sales EV/Sales EV/Sales EV/Sales EV/Sales<br />
2012A 2013E 2014E 2015E 2016E 2017E 2012A 2013E 2014E 2015E 2016E 2017E<br />
(X) (X) (X) (X) (X) (X) (X) (X) (X) (X) (X) (X)<br />
Abbott 10.2 9.7 7.9 6.4 5.1 4.1 2.5 2.3 2.0 1.7 1.4 1.2<br />
AbbVie* na 10.8 10.5 9.0 7.5 6.3 3.9 4.3 4.1 3.7 3.3 2.9<br />
Bristol-Myers 16.0 21.7 19.2 18.2 16.3 13.5 4.6 5.0 4.7 4.8 4.4 3.9<br />
Johnson & Johnson 11.3 10.0 9.2 8.5 8.2 7.6 3.5 3.2 3.0 2.7 2.6 2.4<br />
Eli Lilly 9.7 9.7 12.8 12.3 10.8 13.1 2.8 2.7 3.1 3.0 2.7 2.7<br />
Merck & Co. 8.1 9.1 8.5 8.3 7.8 7.6 3.0 3.2 3.2 3.1 3.0 3.0<br />
Pfizer 8.4 9.1 9.0 8.7 8.7 8.2 3.8 4.0 4.0 3.9 3.8 3.6<br />
Zoetis 15.4 15.2 12.8 11.6 10.0 8.5 3.9 4.3 4.0 3.6 3.2 2.9<br />
US Sector (wtd) 9.5 10.8 10.3 9.6 8.9 8.3 3.5 3.6 3.5 3.3 3.1 2.9<br />
US Sector (u/wtd) 11.3 11.9 11.3 10.4 9.3 8.6 3.5 3.6 3.5 3.3 3.1 2.8<br />
Note: ABBV pro forma EPS/ DPS have not been disclosed for 2010-12 so we do not provide comparable multiples or yields Source:<br />
Thomson One DataStream, <strong>Jefferies</strong> estimates<br />
Exhibit 107: P/E relative against local domestic stock market in 2014E and 2017E for US Pharmaceuticals<br />
80<br />
60<br />
40<br />
20<br />
0<br />
-20<br />
-40<br />
BMY<br />
2014<br />
LLY<br />
2014<br />
ZTS<br />
2014<br />
ABT<br />
2014<br />
JNJ<br />
2014<br />
ABBV<br />
2014<br />
MRK<br />
2014<br />
PFE<br />
2014<br />
LLY<br />
2017<br />
BMY<br />
2017<br />
ZTS<br />
2017<br />
JNJ<br />
2017<br />
PFE<br />
2017<br />
MRK<br />
2017<br />
ABT<br />
2017<br />
ABBV<br />
2017<br />
Source: Thomson One DataStream, <strong>Jefferies</strong> estimates<br />
page 67 of 92<br />
Jeffrey Holford, PhD, ACA, Equity Analyst, (212) 336-7409, jholford@jefferies.com<br />
Please see important disclosure information on pages 88 - 92 of this <strong>report</strong>.
Local market PE Relative (2014E EPS)<br />
Healthcare<br />
Rating | Target | Estimate Change<br />
May 28, 2013<br />
Exhibit 108: Key industry groupings based on strategy, valuation, growth and size of business<br />
1.8<br />
1.6<br />
BMY<br />
1.4<br />
1.2<br />
1.0<br />
0.8<br />
AZN<br />
LLY<br />
MRK<br />
PFE<br />
JNJ<br />
ROG<br />
NOVN<br />
GSK<br />
SAN<br />
NOVO<br />
ABBV<br />
ZTS<br />
ABT<br />
0.6<br />
-8% -6% -4% -2% +0% +2% +4% +6% +8% +10% +12% +14% +16% +18% +20%<br />
2012E-2017E EPS CAGR<br />
Pharma-focused Diversified Mega-merger<br />
Specialized<br />
Note: Bubble size is relative to 2012E revenues in US$ based on average 2011 exchange rates<br />
Source: DataStream, <strong>Jefferies</strong> estimates<br />
page 68 of 92<br />
Jeffrey Holford, PhD, ACA, Equity Analyst, (212) 336-7409, jholford@jefferies.com<br />
Please see important disclosure information on pages 88 - 92 of this <strong>report</strong>.
Healthcare<br />
Rating | Target | Estimate Change<br />
May 28, 2013<br />
Appendix II: Updated Company Models<br />
We have included updated income statements for all companies on which we have<br />
changed our earnings estimates as part of this update.<br />
Abbott<br />
Exhibit 109: Annual income statement for Abbott, 2012A-2017E (US$ millions)<br />
(US$) millions 2012A 2013E 2014E 2015E 2016E 2017E Incr. abs.<br />
'12A-'17E<br />
CAGR<br />
'12A-'17E<br />
Nutrition 6,466 6,991 7,874 8,939 9,993 11,171 4,705 12%<br />
Diagnostics 4,291 4,641 5,038 5,449 5,848 6,276 1,985 8%<br />
Medical Devices 5,496 5,637 6,027 6,430 6,896 7,337 1,842 6%<br />
Established Pharmaceuticals 5,121 5,330 5,802 6,258 6,759 7,310 2,189 7%<br />
Other sales 120 122 126 130 134 138 18 3%<br />
Net sales 21,494 22,722 24,867 27,206 29,629 32,232 10,738 8%<br />
Cost of products sold 9,580 10,152 10,945 11,795 12,765 13,855<br />
Gross profit 11,914 12,570 13,922 15,411 16,864 18,377 6,463<br />
R&D 1,459 1,423 1,503 1,578 1,657 1,740<br />
SG&A 6,730 6,867 7,331 7,771 8,237 8,731<br />
Operating income 3,725 4,280 5,088 6,062 6,970 7,906 4,181 16%<br />
EBITDA 5,358 5,356 6,236 7,269 8,226 9,204 3,845<br />
Net interest expense 107 110 108 100 91 80<br />
Net forex (gain) loss (24) 50 - - - -<br />
Other (income) expense, net (36) (18) (18) (18) (18) (18)<br />
Earnings before taxes 3,678 4,137 4,999 5,979 6,897 7,844 4,166 16%<br />
Taxes 912 869 1,045 1,244 1,427 1,616<br />
Tax rate 24.8% 21.0% 20.9% 20.8% 20.7% 20.6%<br />
Net income 2,766 3,269 3,954 4,736 5,469 6,229 3,462 18%<br />
Diluted EPS 1.74 2.07 2.54 3.08 3.60 4.14 19%<br />
Shares outstanding 1,592 1,578 1,557 1,538 1,521 1,505<br />
Dividend per share na 0.56 0.67 0.79 0.91 1.03<br />
Margin Analysis<br />
Cost of products sold 2012A 2013E 2014E 2015E 2016E 2017E<br />
Gross margin 44.6% 44.7% 44.0% 43.4% 43.1% 43.0% -159bps<br />
R&D 55.4% 55.3% 56.0% 56.6% 56.9% 57.0% 159bps<br />
SG&A 6.8% 6.3% 6.0% 5.8% 5.6% 5.4% -139bps<br />
Operating margin 31.3% 30.2% 29.5% 28.6% 27.8% 27.1% -422bps<br />
EBITDA margin 17.3% 18.8% 20.5% 22.3% 23.5% 24.5% 720bps<br />
Pretax margin 24.9% 23.6% 25.1% 26.7% 27.8% 28.6% 362bps<br />
Net margin 17.1% 18.2% 20.1% 22.0% 23.3% 24.3% 722bps<br />
Payout ratio 12.9% 14.4% 15.9% 17.4% 18.5% 19.3% 645bps<br />
na 27.0% 26.2% 25.7% 25.3% 25.0% na<br />
% YoY Change<br />
Net sales 2012A 2013E 2014E 2015E 2016E 2017E<br />
Cost of products sold 6% 9% 9% 9% 9%<br />
Gross profit 6% 8% 8% 8% 9%<br />
R&D 6% 11% 11% 9% 9%<br />
SG&A -2% 6% 5% 5% 5%<br />
Operating income 2% 7% 6% 6% 6%<br />
EBITDA 15% 19% 19% 15% 13%<br />
Earnings before taxes 0% 16% 17% 13% 12%<br />
Net income 12% 21% 20% 15% 14%<br />
Diluted EPS 18% 21% 20% 15% 14%<br />
Shares outstanding 19% 23% 21% 17% 15%<br />
Dividend per share -1% -1% -1% -1% -1%<br />
Source: <strong>Jefferies</strong> estimates, company data<br />
page 69 of 92<br />
Jeffrey Holford, PhD, ACA, Equity Analyst, (212) 336-7409, jholford@jefferies.com<br />
Please see important disclosure information on pages 88 - 92 of this <strong>report</strong>.
Healthcare<br />
Rating | Target | Estimate Change<br />
May 28, 2013<br />
Bayer<br />
Exhibit 110: Group income statement for Bayer, 2012A-2017E (€m)<br />
(€ millions) 2012A 2013E 2014E 2015E 2016E 2017E Increment<br />
absolute<br />
'12A-'17E<br />
Group Revenues 39,759 40,962 43,488 45,788 48,149 50,465 10,706 5%<br />
YoY growth (%) +9% +3% +6% +5% +5% +5%<br />
Cost of Goods Sold (19,059) (18,679) (19,701) (20,649) (21,583) (22,486) (3,427)<br />
as % of Revenues 48% 46% 45% 45% 45% 45%<br />
CAGR<br />
'12A-<br />
'17E<br />
Gross Profit 20,700 22,283 23,787 25,139 26,566 27,979 7,279 6%<br />
as % of Revenues 52% 54% 55% 55% 55% 55%<br />
Selling expenses (9,987) (10,092) (10,644) (11,156) (11,661) (12,149) (2,162)<br />
as % of Revenues 25% 25% 24% 24% 24% 24%<br />
R&D (3,013) (2,994) (3,158) (3,310) (3,460) (3,604) (591)<br />
as % of Revenues 8% 7% 7% 7% 7% 7%<br />
General Administration expenses (1,866) (1,926) (2,031) (2,129) (2,225) (2,318) (452)<br />
as % of Revenues 5% 5% 5% 5% 5% 5%<br />
Non-Operating Result (712) (665) (366) 50 550 1139 1851<br />
Core EBIT 6,999 7,220 7,800 8,315 8,917 9,532 2,533 6%<br />
YoY growth (%) 9% 3% 8% 7% 7% 7%<br />
Operating Margin 17.6% 17.6% 17.9% 18.2% 18.5% 18.9% +128bps<br />
EBITDA before special items<br />
(Underlying)<br />
8,284 8,662 9,487 10,151 10,904 11,668 3,384 7%<br />
YoY growth (%) 9% 5% 10% 7% 7% 7%<br />
Margin (%) 21% 21% 22% 22% 23% 23% +229bps<br />
CORE PBT 6,214 6,555 7,434 8,366 9,467 10,671 4,457 11%<br />
YoY growth (%) 11% 5% 13% 13% 13% 13%<br />
Income taxes (<strong>report</strong>ed) (752) (1,268) (1,444) (1,668) (1,932) (2,221) (1,469)<br />
Tax Rate (%) 23.2% 24.8% 24.0% 24.0% 24.0% 24.0%<br />
CORE Tax adjustment (Special Items) (1,024) (433) (425) (425) (425) (425) 599<br />
Income tax (for CORE earnings) (1,776) (1,701) (1,869) (2,093) (2,357) (2,646) (870)<br />
Tax Rate (%) (CORE PBT) 28.6% 25.9% 25.1% 25.0% 24.9% 24.8%<br />
CORE Adjusted Net Income 4,420 4,739 5,413 6,121 6,958 7,873 3,453 12%<br />
YoY growth (%) 11% 7% 14% 13% 14% 13%<br />
WA Basic No. Shares (m) 826.9 826.9 826.9 826.9 826.9 826.9 0<br />
Potential convertible shares 0.0 0.0 0.0 0.0 0.0 0.0 0<br />
Adj. WA No. Shares (m) 826.9 826.9 826.9 826.9 826.9 826.9 0<br />
EPS Reported (Continuing operations) 2.95 4.52 5.35 6.20 7.21 8.32 5.37<br />
YoY growth (%) (1%) 53% 18% 16% 16% 15%<br />
CORE EPS 5.34 5.73 6.55 7.40 8.41 9.52 4.18 12%<br />
YoY growth (%) 11% 7% 14% 13% 14% 13%<br />
Dividend per Ordinary (Authorised) 1.80 1.95 2.10 2.25 2.40 2.55 0.75<br />
YoY growth (%) 9% 8% 8% 7% 7% 6%<br />
Source: <strong>Jefferies</strong> estimates, company data<br />
page 70 of 92<br />
Jeffrey Holford, PhD, ACA, Equity Analyst, (212) 336-7409, jholford@jefferies.com<br />
Please see important disclosure information on pages 88 - 92 of this <strong>report</strong>.
Healthcare<br />
Rating | Target | Estimate Change<br />
May 28, 2013<br />
Exhibit 111: Group cash flow statement for Bayer, 2012A-2017E (€m)<br />
(€ millions) 2012A 2013E 2014E 2015E 2016E 2017E<br />
Income after taxes 2,493 3,850 4,573 5,281 6,118 7,033<br />
Income taxes 752 1,268 1,444 1668 1932 2221<br />
Non-operating result 712 665 366 (50) (550) (1,139)<br />
Income taxes paid or accrued (1,560) (1,125) (909) (1,018) (1,147) (1,288)<br />
Depreciation & amortization 2,967 2,726 2,938 3,087 3,239 3,387<br />
Changes in pension provisions (542) (124) 0 0 0 0<br />
Gains/Losses on retirement of noncurrent assets (219) (12) 0 0 0 0<br />
Non-cash effects of inventory work-down 0 0 0 0 0 0<br />
Gross cash flow 4,603 7,248 8,413 8,967 9,592 10,215<br />
Changes in inventories (674) 95 (413) (331) (336) (327)<br />
Changes in trade accounts receivable (452) (1,027) (459) (456) (463) (456)<br />
Changes in trade accounts payable 539 (376) 185 180 187 182<br />
Changes in other working capital, other non-cash items 520 921 0 0 0 0<br />
Net cash provided by operating activities 4,536 6,860 7,725 8,360 8,980 9,613<br />
Purchase of PP&E and intangible assets (1,929) (2,054) (1,739) (1,740) (1,829) (1,917)<br />
Cash inflows from sales of property, plant, equipment and other assets 227 27 0 0 0 0<br />
Cash inflows from divestitures 178 17 0 0 0 0<br />
Cash inflows from noncurrent financial assets (261) 56 0 0 0 0<br />
Cash outflows for acquisitions less acquired cash (466) (122) 0 0 0 0<br />
Interest and Dividends received 104 275 637 1017 1495 2060<br />
Cash inflows from current financial assets 1329 (2) 0 0 0 0<br />
Net Cash from Investing Activities (818) (1,803) (1,102) (723) (334) 143<br />
Capital contributions 0 0 0 0 0 0<br />
Dividends payments and withholding tax on dividend (1,366) (1,490) (1,613) (1,737) (1,861) (1,985)<br />
Issuances of debt 1,309 267 - - - -<br />
Retirements of debt (3,254) (376) 0 0 0 0<br />
Interest paid including interest-rate swaps (793) (847) (1,036) (1,035) (1,035) (1,035)<br />
Interest received from interest-rate swaps 325 0 0 0 0 0<br />
Cash outflows for the purchase of additional interests in subsidiaries (3) 0 0 0 0 0<br />
Net cash Flow from Financing (3,782) (2,428) (2,649) (2,772) (2,896) (3,020)<br />
Change in cash and cash equivalents (64) 2,629 3,974 4,865 5,750 6,737<br />
Cash and cash equivalents at the beginning of the period 1,770 1,699 4,325 8,298 13,164 18,913<br />
Changes due to scope of Consolidation 0 0 0 0 0 0<br />
Other Adjustments and Exchange Differences (7) (4) 0 0 0 0<br />
Cash and cash equivalents at end of period 1,699 4,325 8,298 13,164 18,913 25,650<br />
Net financial Debt (7,025) (4,669) (695) 4,170 9,920 16,656<br />
Source: <strong>Jefferies</strong> estimates, company data<br />
page 71 of 92<br />
Jeffrey Holford, PhD, ACA, Equity Analyst, (212) 336-7409, jholford@jefferies.com<br />
Please see important disclosure information on pages 88 - 92 of this <strong>report</strong>.
Healthcare<br />
Rating | Target | Estimate Change<br />
May 28, 2013<br />
Exhibit 112: Group balance sheet for Bayer, 2012A-2017E (€m)<br />
(€ millions) 2012A 2013E 2014E 2015E 2016E 2017E<br />
Goodwill 9,293 9,411 9,411 9,411 9,411 9,411<br />
Other intangible assets 9,464 8,599 7,525 6,452 5,396 4,358<br />
Property, plant and equipment 9,863 10,412 10,287 10,013 9,659 9,227<br />
Investments accounted for using the equity method 284 224 224 224 224 224<br />
Other financial assets 1,324 1,282 1,282 1,282 1,282 1,282<br />
Other receivables 541 472 472 472 472 472<br />
Deferred taxes 1,581 1,562 1,562 1,562 1,562 1,562<br />
Total Noncurrent Assets 32,350 31,962 30,763 29,416 28,006 26,536<br />
Inventories 6,980 6,950 7,363 7,694 8,030 8,357<br />
Trade Accounts Receivable 7,431 8,539 8,999 9,455 9,918 10,374<br />
Other financial assets 856 629 629 629 629 629<br />
Other receivables 1,648 1,470 1,470 1,470 1,470 1,470<br />
Claims for income tax refunds 376 404 404 404 404 404<br />
Cash and cash equivalents 1,695 4,323 8,297 13,162 18,912 25,648<br />
Assets held for sale/ disc. ops. 0 0 0 0 0 0<br />
Total Current Assets 18,986 22,315 27,162 32,814 39,363 46,883<br />
Total Assets 51,336 54,277 57,925 62,230 67,369 73,419<br />
Capital stock of Bayer AG 2,117 2,117 2,117 2,117 2,117 2,117<br />
Capital reserves of Bayer AG 6,167 6,167 6,167 6,167 6,167 6,167<br />
Other reserves 10,185 12,590 15,550 19,094 23,351 28,399<br />
Equity attributable to Bayer AG stockholders 18,469 20,874 23,834 27,378 31,635 36,683<br />
Equity attributable to non-controlling interest 100 105 105 105 105 105<br />
Net Equity 18,569 20,979 23,939 27,483 31,740 36,788<br />
Provisions for pensions and other post-employment benefits (9,373) (9,388) (9,388) (9,388) (9,388) (9,388)<br />
Other provisions (1,986) (1,890) (1,890) (1,890) (1,890) (1,890)<br />
Financial liabilities (6,962) (5,066) (4,251) (3,751) (3,251) (2,751)<br />
Other liabilities (409) (374) (374) (374) (374) (374)<br />
Deferred taxes (938) (829) (829) (829) (829) (829)<br />
Total Noncurrent Liabilities (19,668) (17,547) (16,732) (16,232) (15,732) (15,232)<br />
Other provisions (4,844) (5,821) (6,323) (6,905) (7,600) (8,420)<br />
Financial liabilities (2,570) (4,486) (5,301) (5,801) (6,301) (6,801)<br />
Trade accounts payable (4,295) (3,909) (4,094) (4,274) (4,461) (4,642)<br />
Income tax liabilities (72) (85) (85) (85) (85) (85)<br />
Other liabilities (1,318) (1,450) (1,450) (1,450) (1,450) (1,450)<br />
Liabilities on assets held for sale/ Disc. Ops. 0 0 0 0 0 0<br />
Total Current Liabilities (13,099) (15,751) (17,254) (18,514) (19,897) (21,398)<br />
Total Equity and Liabilities 51,336 54,277 57,925 62,230 67,369 73,419<br />
Source: <strong>Jefferies</strong> estimates, company data<br />
page 72 of 92<br />
Jeffrey Holford, PhD, ACA, Equity Analyst, (212) 336-7409, jholford@jefferies.com<br />
Please see important disclosure information on pages 88 - 92 of this <strong>report</strong>.
Healthcare<br />
Rating | Target | Estimate Change<br />
May 28, 2013<br />
Eli Lilly<br />
Exhibit 113: Eli Lilly annual income statement, 2012A-2017E (US$)<br />
(US$) millions 2012A 2013E 2014E 2015E 2016E 2017E Incr. abs.<br />
'12A-'17E<br />
CAGR<br />
'12A-'17E<br />
Pharmaceuticals 19,934 19,732 16,011 16,548 18,027 17,813 (2,121) -2%<br />
Animal health 2,036 2,133 2,304 2,465 2,637 2,822 786 7%<br />
Collaboration revenue 633 677 814 992 1,181 1,362 729 17%<br />
Net sales 22,603 22,542 19,129 20,006 21,845 21,997 (606) -1%<br />
COGS 4,797 4,890 4,745 5,071 5,782 6,523 1,726 6%<br />
Gross profit 17,807 17,653 14,384 14,934 16,063 15,474 (2,332) -3%<br />
SG&A 7,514 7,038 6,005 6,305 6,621 6,886 (628) -2%<br />
R&D 5,278 5,507 4,860 4,860 4,957 5,056 (222) -1%<br />
Operating income 5,015 5,107 3,519 3,769 4,485 3,532 (1,483) -7%<br />
EBITDA 6,477 6,317 4,681 4,887 5,569 4,595 (1,882) -7%<br />
Other income/(deductions) (114) 81 89 89 87 89 203<br />
Pretax income 4,901 5,188 3,608 3,858 4,572 3,621 (1,280) -6%<br />
Taxes 1,117 972 722 849 1,006 779 (339) -7%<br />
Tax Rate 22.8% 18.7% 20.0% 22.0% 22.0% 21.5% -129bps<br />
Net income 3,784 4,216 2,887 3,009 3,566 2,843 (941) -6%<br />
DILUTED EPS $3.39 $3.86 $2.67 $2.84 $3.44 $2.80 ($0.59) -4%<br />
Diluted shares outstanding 1,117 1,092 1,080 1,059 1,038 1,015<br />
Dividend per share $1.96 $1.96 $1.96 $1.96 $1.96 $1.96 0%<br />
Margin Analysis 2012A 2013E 2014E 2015E 2016E 2017E<br />
COGS 21.2% 21.7% 24.8% 25.3% 26.5% 29.7% +843 bps<br />
Gross margin 78.8% 78.3% 75.2% 74.7% 73.5% 70.3% -843 bps<br />
SG&A 33.2% 31.2% 31.4% 31.5% 30.3% 31.3% -194 bps<br />
R&D 23.4% 24.4% 25.4% 24.3% 22.7% 23.0% -36 bps<br />
Operating margin 22.2% 22.7% 18.4% 18.8% 20.5% 16.1% -613 bps<br />
EBITDA margin 28.7% 28.0% 24.5% 24.4% 25.5% 20.9% -777 bps<br />
Pretax margin 21.7% 23.0% 18.9% 19.3% 20.9% 16.5% -522 bps<br />
Net margin 16.7% 18.7% 15.1% 15.0% 16.3% 12.9% -382 bps<br />
Dividend payout ratio 57.8% 50.8% 73.3% 69.0% 57.0% 70.0% +1,218 bps<br />
YOY % Change 2012A 2013E 2014E 2015E 2016E 2017E<br />
Net sales -7% 0% -15% 5% 9% 1%<br />
Gross profit -7% -1% -19% 4% 8% -4%<br />
Operating income -21% 2% -31% 7% 19% -21%<br />
EBITDA -16% -2% -26% 4% 14% -17%<br />
Pretax income -20% 6% -30% 7% 19% -21%<br />
Net income -23% 11% -32% 4% 19% -20%<br />
DILUTED EPS -23% 14% -31% 6% 21% -19%<br />
Diluted shares outstanding 0% -2% -1% -2% -2% -2%<br />
Source: <strong>Jefferies</strong> estimates, company data<br />
page 73 of 92<br />
Jeffrey Holford, PhD, ACA, Equity Analyst, (212) 336-7409, jholford@jefferies.com<br />
Please see important disclosure information on pages 88 - 92 of this <strong>report</strong>.
Healthcare<br />
Rating | Target | Estimate Change<br />
May 28, 2013<br />
Exhibit 114: Eli Lilly cash flow statement, 2012A-2017E (US$)<br />
(US$) millions 2012A 2013E 2014E 2015E 2016E 2017E<br />
Net income (GAAP) 4,089 4,216 2,887 3,009 3,566 2,843<br />
Depreciation & amortization 1,462 1,210 1,162 1,118 1,084 1,063<br />
Net change in deferred taxes 126 - - - - -<br />
Change in oper. assets and liabilities (51) 181 564 (372) (546) (39)<br />
Other (321) - - - - -<br />
Net cash from operating 5,305 5,607 4,613 3,755 4,104 3,867<br />
Net capital expenditures (883) (900) (873) (862) (925) (978)<br />
Net change in short-term investments 375 - - - - -<br />
Net changes in long-term investments (3,263) - - - - -<br />
Other 938 - - - - -<br />
Net cash from investing (2,833) (900) (873) (862) (925) (978)<br />
Cash dividends paid (2,187) (2,140) (2,116) (2,076) (2,034) (1,990)<br />
Net change in common shares (721) (1,100) (1,000) (1,000) (1,000) (1,000)<br />
Net change in short-term debt (11) - - - - -<br />
Net change in long-term debt (1,501) - - - - -<br />
Net cash from financing (4,420) (3,240) (3,116) (3,076) (3,034) (2,990)<br />
Effect of exchange rates 44 - - - - -<br />
Net increase in cash (1,904) 1,467 624 (183) 145 (101)<br />
Cash at beginning of period 5,923 4,019 5,486 6,109 5,926 6,071<br />
Cash at end of period 4,019 5,486 6,109 5,926 6,071 5,970<br />
Breakdown of Net cash/(debt)<br />
Cash and Cash equivalents 4,019 5,486 6,109 5,926 6,071 5,970<br />
Short term investments 1,666 1,666 1,666 1,666 1,666 1,666<br />
Short term debt (12) (12) (12) (12) (12) (12)<br />
Net short term cash/(debt) 5,673 7,139 7,763 7,580 7,725 7,623<br />
Long term debt (5,519) (5,519) (5,519) (5,519) (5,519) (5,519)<br />
Net cash/(debt) at end of period 153 1,620 2,243 2,060 2,206 2,104<br />
Source: <strong>Jefferies</strong> estimates, company data<br />
page 74 of 92<br />
Jeffrey Holford, PhD, ACA, Equity Analyst, (212) 336-7409, jholford@jefferies.com<br />
Please see important disclosure information on pages 88 - 92 of this <strong>report</strong>.
Healthcare<br />
Rating | Target | Estimate Change<br />
May 28, 2013<br />
Exhibit 115: Eli Lilly summary balance sheet, 2012A-2017E (US$)<br />
(US$) millions 2012A 2013E 2014E 2015E 2016E 2017E<br />
Cash and short-term investments 5,684 7,151 7,775 7,592 7,737 7,635<br />
Net receivables 3,888 3,644 3,162 3,417 3,748 3,643<br />
Inventories 2,644 2,760 2,609 2,821 3,212 3,475<br />
Inventory days 193 193 193 193 193 193<br />
Other current assets 822 822 822 822 822 822<br />
Current assets 13,039 14,377 14,368 14,653 15,519 15,575<br />
Net property, plant and equipment 7,760 7,451 7,162 6,906 6,748 6,663<br />
Other assets 13,600 13,600 13,600 13,600 13,600 13,600<br />
Total Assets 34,399 35,427 35,130 35,159 35,867 35,838<br />
Short-term debt 12 12 12 12 12 12<br />
Payables 5,639 5,691 5,623 5,718 5,894 6,012<br />
Other current liabilities 2,739 2,739 2,739 2,739 2,739 2,739<br />
Current liabilities 8,390 8,442 8,374 8,469 8,645 8,763<br />
Long-term debt 5,519 5,519 5,519 5,519 5,519 5,519<br />
Other liabilities 5,716 5,716 5,716 5,716 5,716 5,716<br />
Total Liabilities 19,625 19,677 19,609 19,705 19,881 19,998<br />
Shareholders' Equity 14,774 15,750 15,521 15,454 15,986 15,839<br />
Total Liabilities and SE 34,399 35,427 35,130 35,159 35,867 35,838<br />
Source: <strong>Jefferies</strong> estimates, company data<br />
page 75 of 92<br />
Jeffrey Holford, PhD, ACA, Equity Analyst, (212) 336-7409, jholford@jefferies.com<br />
Please see important disclosure information on pages 88 - 92 of this <strong>report</strong>.
Healthcare<br />
Rating | Target | Estimate Change<br />
May 28, 2013<br />
GlaxoSmithKline<br />
Exhibit 116: : GlaxoSmithKline: Summary Income Statement (GBP in millions) 2012A-2017E<br />
(£) millions 2012A 2013E 2014E 2015E 2016E 2017E Incr. abs.<br />
12A-17E<br />
CAGR<br />
12A-17E<br />
Core Pharma 16,622 17,093 17,561 17,678 18,795 20,324 3,702 4%<br />
Vaccines 3,325 3,561 3,917 4,255 4,602 4,914 1,589 8%<br />
ViiV 1,374 1,336 1,431 1,593 1,782 1,928 554 7%<br />
Consumer Health 5,110 5,425 5,745 6,074 6,388 6,719 1,609 6%<br />
Turnover 26,431 27,415 28,654 29,601 31,567 33,885 7,454 5%<br />
Cost of sales (7,109) (7,739) (8,028) (8,357) (8,934) (9,579) (2,470) 6%<br />
Gross profit 19,322 19,676 20,625 21,244 22,633 24,305 4,983 5%<br />
SG&A (7,905) (8,145) (8,488) (8,828) (9,181) (9,548) (1,643) 4%<br />
R&D (3,485) (3,542) (3,617) (3,726) (3,837) (3,952) (467) 3%<br />
Royalty income 306 356 363 370 378 385 79 5%<br />
CORE Operating profit 8,238 8,344 8,883 9,061 9,993 11,190 2,952 6%<br />
CORE Net finance expense (724) (563) (508) (488) (467) (437) 287 -10%<br />
Share of after-tax profits from assoc. & JVs 29 60 62 64 66 68 39 18%<br />
CORE EBITDA 9,109 9,319 9,859 10,039 10,975 12,180 3,071 6%<br />
CORE Profit before Taxation 7,543 7,840 8,437 8,637 9,591 10,821 3,277 7%<br />
Taxation (1,838) (1,914) (2,018) (2,022) (2,198) (2,425) (587) 6%<br />
Tax rate 24.4% 24.4% 23.9% 23.4% 22.9% 22.4% (0) -2%<br />
CORE Profit after Taxation 5,705 5,926 6,419 6,615 7,393 8,395 2,690 8%<br />
Profit attributable to non-controlling interests 235 293 319 332 374 424 189 13%<br />
CORE Profit attributable to shareholders 5,470 5,633 6,101 6,283 7,020 7,971 2,501 8%<br />
CORE EPS 111.4p 117.9p 131.1p 138.0p 157.4p 182.1p 70.6p 10%<br />
Weighted average shares - basic 4,912 4,783 4,656 4,555 4,463 4,380 (532) -2%<br />
DPS 74p 78p 82p 86p 92p 100p 26p 6%<br />
Margin Analysis 2012A 2013E 2014E 2015E 2016E 2017E<br />
Cost of sales 26.9% 28.2% 28.0% 28.2% 28.3% 28.3%<br />
Gross margin 73.1% 71.8% 72.0% 71.8% 71.7% 71.7%<br />
R&D 13.2% 12.9% 12.6% 12.6% 12.2% 11.7%<br />
SG&A 29.9% 29.7% 29.6% 29.8% 29.1% 28.2%<br />
Core Operating profit margin 31.2% 30.4% 31.0% 30.6% 31.7% 33.0%<br />
EBITDA margin 34.5% 34.0% 34.4% 33.9% 34.8% 35.9%<br />
Core pretax margin 28.5% 28.6% 29.4% 29.2% 30.4% 31.9%<br />
CORE Profit attributable to shareholders margin 21.6% 21.6% 22.4% 22.3% 23.4% 24.8%<br />
Dividend Payout Ratio 66.5% 66.2% 62.6% 62.3% 58.5% 54.9%<br />
% YOY Change 2012A 2013E 2014E 2015E 2016E 2017E<br />
Turnover -3% 4% 5% 3% 7% 7%<br />
Cost of sales -2% 9% 4% 4% 7% 7%<br />
Gross profit -4% 2% 5% 3% 7% 7%<br />
R&D -6% 2% 2% 3% 3% 3%<br />
SG&A -1% 3% 4% 4% 4% 4%<br />
CORE Operating profit -6% 1% 6% 2% 10% 12%<br />
CORE EBITDA -5% 2% 6% 2% 9% 11%<br />
CORE Profit before Taxation -6% 4% 8% 2% 11% 13%<br />
CORE Profit attributable to shareholders -5% 3% 8% 3% 12% 14%<br />
CORE EPS -3% 6% 11% 5% 14% 16%<br />
Dividend per Share -1% 5% 5% 5% 7% 9%<br />
Weighted average shares - basic -2% -3% -3% -2% -2% -2%<br />
Source: <strong>Jefferies</strong> estimates, company data<br />
page 76 of 92<br />
Jeffrey Holford, PhD, ACA, Equity Analyst, (212) 336-7409, jholford@jefferies.com<br />
Please see important disclosure information on pages 88 - 92 of this <strong>report</strong>.
Healthcare<br />
Rating | Target | Estimate Change<br />
May 28, 2013<br />
Johnson & Johnson<br />
Exhibit 117: Annual income statement for Johnson & Johnson, 2012A-2017E (US$ millions)<br />
(US$) millions 2012A 2013E 2014E 2015E 2016E 2017E Incr. abs.<br />
'12A-'17E<br />
CAGR<br />
'12A-'17E<br />
Consumer 14,447 14,821 15,438 16,093 16,765 17,439 2,992 3.8%<br />
Pharmaceutical 25,351 27,061 28,008 28,588 28,032 28,095 2,744 2.1%<br />
Med Devices & Diagnostics 27,426 29,010 29,862 30,974 32,161 33,458 6,032 4.1%<br />
Pharma Pipeline - 239 690 1,180 1,418 2,500 2,500 n/a<br />
Net sales 67,224 71,107 73,997 76,835 78,375 81,492 14,268 3.9%<br />
Cost of products sold 21,658 22,630 23,331 24,206 24,970 26,051 4,393<br />
Gross profit 45,566 48,477 50,667 52,629 53,405 55,441 9,875<br />
R&D 7,665 8,052 8,208 8,373 8,540 8,711 1,046<br />
SM&A 20,869 21,616 22,235 22,902 23,589 24,296 3,427<br />
Operating income 17,032 18,809 20,224 21,355 21,276 22,434 5,402 5.7%<br />
EBITDA 20,698 22,690 24,027 25,163 25,089 26,251 5,553 4.9%<br />
Interest (income) expense, net 468 452 436 408 372 330 -138<br />
Other (income) expense, net (1,650) (830) (1,200) (1,200) (1,200) (1,200) 450<br />
Earnings (loss) before taxes 18,214 19,187 20,988 22,147 22,104 23,305 5,091 5.1%<br />
Taxes 3,869 3,857 4,219 4,452 4,444 4,685 816<br />
Tax rate 21.2% 20.1% 20.1% 20.1% 20.1% 20.1%<br />
Net income 14,345 15,330 16,769 17,694 17,660 18,619 4,274 5.4%<br />
Diluted EPS - - - - - -<br />
Avg. diluted shares 5.10 5.39 5.98 6.41 6.50 6.95 6.4%<br />
Dividend per share 2,813 2,844 2,804 2,759 2,717 2,677<br />
2.40 2.62 2.89 3.15 3.29 3.46 7.6%<br />
Margin Analysis<br />
Cost of products sold 2012A 2013E 2014E 2015E 2016E 2017E<br />
Gross margin 32.2% 31.8% 31.5% 31.5% 31.9% 32.0% -25bps<br />
R&D 67.8% 68.2% 68.5% 68.5% 68.1% 68.0% 25bps<br />
SM&A 11.4% 11.3% 11.1% 10.9% 10.9% 10.7% -71bps<br />
Operating margin 31.0% 30.4% 30.0% 29.8% 30.1% 29.8% -123bps<br />
EBITDA margin 25.3% 26.5% 27.3% 27.8% 27.1% 27.5% 219bps<br />
Pretax margin 30.8% 31.9% 32.5% 32.7% 32.0% 32.2% 142bps<br />
Net margin 27.1% 27.0% 28.4% 28.8% 28.2% 28.6% 150bps<br />
Payout ratio 21.3% 21.6% 22.7% 23.0% 22.5% 22.8% 151bps<br />
47.1% 48.7% 48.3% 49.2% 50.6% 49.8%<br />
% YoY Change 2012A 2013E 2014E 2015E 2016E 2017E<br />
Net sales 3% 6% 4% 4% 2% 4%<br />
Cost of products sold 7% 4% 3% 4% 3% 4%<br />
Gross profit 2% 6% 5% 4% 1% 4%<br />
R&D 2% 5% 2% 2% 2% 2%<br />
SM&A 0% 4% 3% 3% 3% 3%<br />
Operating income 5% 10% 8% 6% 0% 5%<br />
EBITDA 7% 10% 6% 5% 0% 5%<br />
Earnings (loss) before taxes 5% 5% 9% 6% 0% 5%<br />
Net income 3% 7% 9% 6% 0% 5%<br />
Diluted EPS 2% 6% 11% 7% 1% 7%<br />
Avg. diluted shares 1% 1% -1% -2% -2% -1%<br />
Source: Company data, <strong>Jefferies</strong> estimates<br />
page 77 of 92<br />
Jeffrey Holford, PhD, ACA, Equity Analyst, (212) 336-7409, jholford@jefferies.com<br />
Please see important disclosure information on pages 88 - 92 of this <strong>report</strong>.
Healthcare<br />
Rating | Target | Estimate Change<br />
May 28, 2013<br />
Merck & Co.<br />
Exhibit 118: Merck & Co. annual income statement, 2012A-2017E (US$ millions)<br />
($) millions 2012A 2013E 2014E 2015E 2016E 2017E Incr. abs.<br />
'12A-'17E<br />
CAGR<br />
'12A-'17E<br />
Net sales 47,268 44,287 44,405 45,150 46,326 47,162 (106) 0%<br />
COGS 11,386 11,084 10,857 11,002 11,226 11,962 576<br />
Gross profit 35,882 33,203 33,548 34,148 35,100 35,200 (682) 0%<br />
SG&A 12,414 11,717 11,100 11,100 10,879 10,439 (1,975)<br />
R&D 7,912 7,999 8,001 8,081 8,161 8,243 331<br />
Operating income 15,556 13,487 14,447 14,967 16,061 16,519 962 1%<br />
EBITDA 17,474 15,587 16,547 17,067 18,161 18,619<br />
Equity (income) from affiliates (641) (489) (119) (40) (28) (25) 616<br />
Other (income)/expense, net 621 633 796 734 731 733 112<br />
Pretax income 15,576 13,343 13,770 14,273 15,357 15,811 234 0%<br />
Taxes 3,701 2,963 3,058 3,170 3,411 3,511<br />
Tax rate 24% 22% 22% 22% 22% 22% (155)bps<br />
Net income 11,743 10,270 10,597 10,988 11,831 12,184 441 1%<br />
Non controlling interest 132 109 115 115 115 115<br />
Diluted EPS 3.82 3.45 3.68 3.91 4.31 4.53 3%<br />
wt. avg dil. shares outstanding 3,075 2,976 2,877 2,812 2,749 2,688<br />
Dividend per share 1.68 1.76 1.86 2.00 2.16 2.36 7%<br />
Margin Analysis 2012A 2013E 2014E 2015E 2016E 2017E<br />
COGS 24.0% 25.0% 24.5% 24.4% 24.2% 25.4% 135bps<br />
Gross margin 75.9% 75.0% 75.5% 75.6% 75.8% 74.6% (128)bps<br />
SG&A 26.3% 26.5% 25.0% 24.6% 23.5% 22.1% (413)bps<br />
R&D 16.7% 18.1% 18.0% 17.9% 17.6% 17.5% 74bps<br />
Operating margin 32.9% 30.5% 32.5% 33.1% 34.7% 35.0% 211bps<br />
EBITDA margin 37.0% 35.2% 37.3% 37.8% 39.2% 39.5% 251bps<br />
Pretax margin 33.0% 30.1% 31.0% 31.6% 33.1% 33.5% 57bps<br />
Net margin 24.8% 23.2% 23.9% 24.3% 25.5% 25.8% 99bps<br />
Dividend payout ratio 44.6% 50.6% 50.5% 51.2% 50.2% 52.1%<br />
% YOY Change 2012A 2013E 2014E 2015E 2016E 2017E<br />
Net sales -2% -6% 0% 2% 3% 2%<br />
Gross profit -2% -7% 1% 2% 3% 0%<br />
Operating income 0% -13% 7% 4% 7% 3%<br />
EBITDA -2% -11% 6% 3% 6% 3%<br />
Pretax income 1% -14% 3% 4% 8% 3%<br />
Net income 0% -13% 3% 4% 8% 3%<br />
Diluted EPS 1% -10% 7% 6% 10% 5%<br />
wt. avg dil. shares outstanding -1% -3% -3% -2% -2% -2%<br />
Source: <strong>Jefferies</strong> estimates, company data<br />
page 78 of 92<br />
Jeffrey Holford, PhD, ACA, Equity Analyst, (212) 336-7409, jholford@jefferies.com<br />
Please see important disclosure information on pages 88 - 92 of this <strong>report</strong>.
Healthcare<br />
Rating | Target | Estimate Change<br />
May 28, 2013<br />
Exhibit 119: Merck & Co. cash flow statement, 2012A-2017E (US$ millions)<br />
($) millions 2012A 2013E 2014E 2015E 2016E 2017E<br />
Net income (Non-GAAP) 11,743 10,270 10,597 10,988 11,831 12,184<br />
GAAP Adjustment (5,444) (4,269) (4,000) (4,000) (4,000) (4,000)<br />
Net income (GAAP) 6,299 6,001 6,597 6,988 7,831 8,184<br />
Depreciation and amortization 6,978 5,954 4,881 4,129 3,539 3,064<br />
Equity income from affliates (642) (489) (119) (40) (28) (25)<br />
Dividends and distr. from equity affliates 291 5 - - - -<br />
Deferred income taxes 669 (71) - - - -<br />
Share based compensation 335 310 307 307 301 289<br />
In-process research & development 200 30 - - - -<br />
Other reconciliation charges 28 326 - - - -<br />
Accounts receivable 349 64 (105) (209) (203) (134)<br />
Inventories (482) 203 (30) (131) (128) (452)<br />
Trade accounts payable (302) (215) 12 36 36 129<br />
Accrued and other current liabilities (717) - - - - -<br />
Income taxes payable (34) 127 0 79 116 11<br />
Noncurrent liabilities (1,747) 755 146 464 453 299<br />
Other changes in assets & liabilities (1,203) 69 80 112 128 160<br />
Net cash from operating activities 10,022 13,068 11,769 11,735 12,045 11,524<br />
Capital expenditures (1,954) (1,924) (1,894) (1,921) (1,960) (2,088)<br />
Purchase of securities and other investments (12,841) (4,010) - - - -<br />
Proceeds from sales of securities & investments 7,783 3,161 - - - -<br />
Other 207 47 - - - -<br />
Net cash from investing activities (6,805) (2,726) (1,894) (1,921) (1,960) (2,088)<br />
Net change in short-term debt 624 880 - - - -<br />
Proceeds from issuance of debt 2,562 - - - - -<br />
Payments on debt (22) (1,931) - - - -<br />
Purchase of treasury stock (2,591) (7,180) (4,000) (4,000) (4,000) (4,000)<br />
Proceeds from exercise of options 1,310 92 - - - -<br />
Cash dividends paid (5,236) (5,201) (5,352) (5,624) (5,938) (6,343)<br />
Other 86 (1) - - - -<br />
Net cash from financing activities (3,267) (6,841) (9,352) (9,624) (9,938) (10,343)<br />
Effect of exchange rates (30) (194) - - - -<br />
Net change in cash (80) 3,307 523 190 147 (907)<br />
Cash at beginning of period 13,531 13,451 16,759 17,282 17,471 17,618<br />
Cash at end of period 13,451 16,759 17,282 17,471 17,618 16,711<br />
Total investments 9,995 10,946 10,946 10,946 10,946 10,946<br />
Total debt (20,569) (25,900) (25,900) (25,900) (25,900) (25,900)<br />
Net Cash/ (Debt) 2,877 1,805 2,328 2,517 2,664 1,757<br />
Source: <strong>Jefferies</strong> estimates, company data<br />
page 79 of 92<br />
Jeffrey Holford, PhD, ACA, Equity Analyst, (212) 336-7409, jholford@jefferies.com<br />
Please see important disclosure information on pages 88 - 92 of this <strong>report</strong>.
Healthcare<br />
Rating | Target | Estimate Change<br />
May 28, 2013<br />
Exhibit 120: Merck & Co. balance sheet, 2012A-2017E (US$ millions)<br />
($) millions 2012A 2013E 2014E 2015E 2016E 2017E<br />
Cash and equivalents 13,451 16,759 17,282 17,471 17,618 16,711<br />
Short-term investments 2,690 2,998 2,998 2,998 2,998 2,998<br />
Accounts receivable 7,672 7,901 8,006 8,215 8,418 8,552<br />
Inventories 6,535 6,570 6,600 6,731 6,860 7,312<br />
Prepaid expenses, taxes, and<br />
other current assets<br />
4,509 4,484 4,484 4,484 4,484 4,484<br />
Current assets 34,857 38,712 39,370 39,900 40,378 40,057<br />
Investments 7,305 7,948 7,948 7,948 7,948 7,948<br />
Net property, plant and<br />
equipment<br />
Goodwill and intangible<br />
assets<br />
16,030 15,846 15,710 15,618 15,574 15,659<br />
41,217 37,564 34,713 32,597 31,062 30,001<br />
Other 6,723 7,004 6,816 6,549 6,276 6,012<br />
Total Assets 106,132 107,074 104,557 102,612 101,238 99,678<br />
Short-term debt 4,315 4,736 4,736 4,736 4,736 4,736<br />
Accounts payable 1,753 1,869 1,881 1,917 1,954 2,082<br />
Income taxes payable 1,200 1,202 1,202 1,281 1,397 1,408<br />
Dividends payable 1,343 1,407 1,487 1,599 1,727 1,887<br />
Accrued and other current<br />
liabilities<br />
9,737 9,569 9,569 9,569 9,569 9,569<br />
Current liabilities 18,348 18,783 18,875 19,102 19,382 19,682<br />
Long-term debt 16,254 21,164 21,164 21,164 21,164 21,164<br />
Deferred taxes and<br />
16,067 17,631 17,777 18,241 18,694 18,992<br />
noncurrent liabilities<br />
Minority interest 2,443 2,577 2,577 2,577 2,577 2,577<br />
Total Liabilities 53,112 60,155 60,393 61,084 61,817 62,415<br />
Common stock 1,788 1,788 1,788 1,788 1,788 1,788<br />
Other paid-in capital 40,646 40,727 40,727 40,727 40,727 40,727<br />
Retained earnings 39,985 40,762 42,007 43,371 45,265 47,106<br />
Other comprehensive income (4,682) (4,629) (4,629) (4,629) (4,629) (4,629)<br />
Treasury stock (24,717) (31,729) (35,729) (39,729) (43,729) (47,729)<br />
Shareholder's Equity 53,020 46,919 44,164 41,528 39,422 37,263<br />
Total Liabilities and SE 106,132 107,074 104,557 102,612 101,238 99,678<br />
Source: <strong>Jefferies</strong> estimates, company data<br />
page 80 of 92<br />
Jeffrey Holford, PhD, ACA, Equity Analyst, (212) 336-7409, jholford@jefferies.com<br />
Please see important disclosure information on pages 88 - 92 of this <strong>report</strong>.
Healthcare<br />
Rating | Target | Estimate Change<br />
May 28, 2013<br />
Pfizer<br />
Exhibit 121: Pfizer annual income statement, 2012A-2017E (US$m)<br />
($) millions 2012A 2013E 2014E 2015E 2016E 2017E Incr. abs.<br />
'12A-'17E<br />
CAGR<br />
'12A-'17E<br />
Pharmaceuticals 51,214 48,270 46,945 47,271 47,045 49,008 -2,206 -0.9%<br />
Other Non-Pharma 7,772 8,259 8,774 9,311 9,838 10,371 2,599 5.9%<br />
Net sales 58,986 56,529 55,719 56,582 56,882 59,379 393 0.1%<br />
COGS 10,994 10,849 10,485 10,902 11,475 12,209 1,215<br />
Gross profit 47,992 45,680 45,234 45,680 45,408 47,170 -822<br />
SI&A 16,281 15,931 15,612 16,081 16,242 16,729 448<br />
R&D 7,346 6,841 6,499 6,369 6,241 6,366 -980<br />
Operating income 24,365 22,908 23,123 23,230 22,925 24,075 -290 -0.2%<br />
EBITDA 26,471 25,143 24,942 25,152 24,847 25,997 -473 -0.4%<br />
Adj. non op. (inc.)/exp. 1,036 1,063 1,594 1,435 1,393 1,364 328<br />
Pretax income 23,330 21,845 21,529 21,795 21,532 22,711 -618 -0.5%<br />
Taxes 6,824 6,123 6,136 6,211 6,137 6,473 -351<br />
Tax rate 29.3% 28.0% 28.5% 28.5% 28.5% 28.5% -75bps<br />
Minority interest and d/c ops 29 126 171 185 212 244 216<br />
Net income 16,477 15,596 15,222 15,398 15,183 15,995 -482 -0.6%<br />
DILUTED EPS $2.19 $2.23 $2.30 $2.38 $2.39 $2.57 3.3%<br />
Diluted shares outstanding 7,395 6,702 6,548 6,408 6,281 6,167<br />
Dividends per share $0.88 $0.97 $1.08 $1.17 $1.29 $1.44 10.4%<br />
Margin Analysis 2012A 2013E 2014E 2015E 2016E 2017E<br />
COGS 18.6% 19.2% 18.8% 19.3% 20.2% 20.6%<br />
Gross margin 81.4% 80.8% 81.2% 80.7% 79.8% 79.4% -192bps<br />
SI&A 27.6% 28.2% 28.0% 28.4% 28.6% 28.2% +57bps<br />
R&D 12.5% 12.1% 11.7% 11.3% 11.0% 10.7% -173bps<br />
Operating margin 41.3% 40.5% 41.5% 41.1% 40.3% 40.5% -76bps<br />
EBITDA margin 44.9% 44.5% 44.8% 44.5% 43.7% 43.8% -109bps<br />
Pretax margin 39.6% 38.6% 38.6% 38.5% 37.9% 38.2% -130bps<br />
Net margin 27.9% 27.6% 27.3% 27.2% 26.7% 26.9% -100bps<br />
Dividend Payout ratio 39.7% 42.9% 47.0% 49.1% 53.6% 56.0%<br />
YOY % Change 2012A 2013E 2014E 2015E 2016E 2017E<br />
Net sales -12% -4% -1% 2% 1% 4%<br />
COGS -16% -1% -3% 4% 5% 6%<br />
Gross profit -12% -5% -1% 1% -1% 4%<br />
SI&A -16% -2% -2% 3% 1% 3%<br />
R&D -13% -7% -5% -2% -2% 2%<br />
Operating income -8% -6% 1% 0% -1% 5%<br />
EBITDA -5% -5% -1% 1% -1% 5%<br />
Pretax income -10% -6% -1% 1% -1% 5%<br />
Net income -9% -5% -2% 1% -1% 5%<br />
Diluted EPS -5% 2% 3% 3% 1% 7%<br />
Diluted shares outstanding -6% -9% -2% -2% -2% -2%<br />
Source: <strong>Jefferies</strong> estimates, company data<br />
page 81 of 92<br />
Jeffrey Holford, PhD, ACA, Equity Analyst, (212) 336-7409, jholford@jefferies.com<br />
Please see important disclosure information on pages 88 - 92 of this <strong>report</strong>.
Healthcare<br />
Rating | Target | Estimate Change<br />
GlaxoSmithKline<br />
May 28, 2013<br />
Hold: 1900p Price Target<br />
Scenarios<br />
Target Investment Thesis<br />
• Limited top-line growth in 2013E (JEFe<br />
1% CER, guidance 1% CER).<br />
• Buyback of JEFe £2bn (guidance £1bn-<br />
£2bn) helps support EPS growth.<br />
• Uncertainties regarding respiratory<br />
franchise will remain an overhang.<br />
• Our 2013E CORE EPS forecast (+2.7% at<br />
CER) is below management guidance<br />
(CER CORE EPS growth of 3%-4%).<br />
• 2014 CORE EPS: 131.1p; Target<br />
Multiple: 14.5 x; Target Price 1900p.<br />
Upside Scenario<br />
• Stronger top-line growth possibly due<br />
to an improvement in European<br />
pricing trends and slower than<br />
expected generic/ pricing erosion of<br />
the tail.<br />
• Operating Margin increases further<br />
helped by higher than expected cost<br />
savings.<br />
• Positive progress in the pipeline.<br />
• 2013 Target Multiple: 16.0x; Target<br />
Price: 2100p.<br />
Downside Scenario<br />
• Weaker top-line growth as European<br />
Advair generics appear earlier than<br />
expected and tail erodes faster.<br />
• Operating Margin squeezed due to<br />
genericisation of high margin sales<br />
and only limited availability of cost<br />
savings.<br />
• Late-stage pipeline failures (e.g.<br />
MAGE-A3 and/ or darapladib.<br />
• 2013 Target Multiple: 13.0x Target<br />
Price: 1700p.<br />
THE LONG VIEW<br />
Long Term Analysis<br />
1 Year Forward P/E<br />
Long Term Financial Model Drivers<br />
Other Considerations<br />
Source: DataStream, <strong>Jefferies</strong> estimates<br />
(2012A-17E)<br />
LT Earnings CAGR +10%<br />
Organic Revenue Growth +5%<br />
Acquisition Contribution 0%<br />
Core Operating Margin Expansion<br />
/ (Contraction)<br />
+190bps<br />
GlaxoSmithKline is already through its<br />
patent cliff as well as the Avandia<br />
withdrawal and a drop in H1N1 related<br />
sales. However pricing pressure in Europe<br />
has delayed any significant return to sales<br />
growth to date. Uncertainties regarding<br />
pipeline clinical and regulatory risk, as<br />
well as pricing/ generic competition for its<br />
largest product (Advair) in Europe are set<br />
to remain a feature through 2013.<br />
Peer Group<br />
Group P/Es (2014E)<br />
EPS Growth (12-17E) vs. P/E (‘14E)<br />
Recommendation / Price Target<br />
Ticker Rec. PT<br />
GSK Hold 1900p<br />
AZN Hold 3700p<br />
NOVN Buy CHF88<br />
ROG Buy CHF285<br />
SASY Buy €100<br />
Source: Thomson Reuters, <strong>Jefferies</strong> estimates<br />
Source: Thomson Reuters, <strong>Jefferies</strong> estimates<br />
Catalysts<br />
• Q2’13 – Dabrafenib (BRAF) US regulatory<br />
decision in metastatic melanoma (likely<br />
May/ June).<br />
• Q3’13 – Trametinib (MEK) US regulatory<br />
decision in metastatic melanoma (PDUFA<br />
3 rd of September).<br />
• Q3’13 – Dolutegravir US regulatory<br />
decision in HIV (Priority review; PDUFA<br />
17th Aug).<br />
• H2’13 – MAGE-A3 and darapladib Phase III<br />
page 82 of 92<br />
data.<br />
Company Description<br />
GlaxoSmithKline was formed in 2001 through the merger of Glaxo Wellcome and<br />
SmithKline Beecham to form one of the World's largest Pharmaceuticals companies with<br />
approximately 7% market share globally. The company primarily operates in the fields of<br />
Pharmaceuticals, Vaccines and Consumer Health.<br />
Jeffrey Holford, PhD, ACA, Equity Analyst, (212) 336-7409, jholford@jefferies.com<br />
Please see important disclosure information on pages 88 - 92 of this <strong>report</strong>.
Healthcare<br />
Rating | Target | Estimate Change<br />
May 28, 2013<br />
AstraZeneca<br />
Hold: 3700p Price Target<br />
Scenarios<br />
Target Investment Thesis<br />
• Our assumptions are in line with<br />
management’s FY13 revenue guidance of<br />
• Revenues benefit from slower generic erosion<br />
to key products including Pulmicort respules<br />
mid to high single digit (CER) decline (JEFe - and therapeutic substitution of Crestor<br />
7.5%)<br />
• Operating Margin benefits from higher sales<br />
• CORE EPS to decline significantly more than with maintained operational costs.<br />
revenues (JEFe-27%).<br />
• Share buyback halted to maximize cash<br />
• Operating cost expenditure reflects<br />
continued spend in R&D and promotional<br />
effort behind key products.<br />
• Target PE Multiple: 12.3x; Target Price<br />
3700p, yielding c5%<br />
Upside Scenario<br />
• Brilinta launch accelerates reflecting increased<br />
promotional effort.<br />
• Surplus cash deployed into accretive<br />
acquisitions and positive R&D updates help<br />
expand multiple.<br />
• 2014 Target PE Multiple: 13.3x; Target Price:<br />
4000p<br />
Downside Scenario<br />
• Revenues hit by rapid generic erosion<br />
of the top line and increasing<br />
therapeutic substitution for Crestor.<br />
• Margins squeezed by genericisation of<br />
high margin sales and limited cost<br />
savings as focus remains on long term.<br />
• Yield support and confidence in<br />
dividend likely to become more<br />
important for share price than multiple.<br />
• 2013 Target PE Multiple: 11.3x Target<br />
Price: 3400p<br />
THE LONG VIEW<br />
Long Term Analysis<br />
1 Year Forward P/E<br />
Source: DataStream, <strong>Jefferies</strong> estimates<br />
Long Term Financial Model Drivers<br />
(2012E-17E)<br />
LT Earnings CAGR -7%<br />
Organic Revenue Growth -4%<br />
Acquisition Contribution 0%<br />
Operating Margin Expansion -505bp<br />
Other Considerations<br />
With Seroquel IR genericising and Nexium<br />
and Crestor generics on the horizon, the<br />
loss of high-margin sales will compress<br />
operating margins. At least maintaining<br />
operational spending will compound this<br />
as new management look to the long<br />
term. With cash only likely spent on boltons,<br />
recovery is some time away, but<br />
could be rewarding for those with a 2-3<br />
year horizon. Meanwhile shares should be<br />
supported by a 5% yield.<br />
Peer Group<br />
Group P/Es (2013E)<br />
EPS Growth (11A-16E) vs. P/E (‘13E)<br />
Recommendation / Price Target<br />
Ticker Rec. PT<br />
AZN Hold 3700p<br />
GSK Hold 1900p<br />
NOVN Buy CHF88<br />
ROG Buy CHF285<br />
SASY Buy €100<br />
Source: Thomson Reuters, <strong>Jefferies</strong> estimates<br />
Source: Thomson Reuters, <strong>Jefferies</strong> estimates<br />
Catalysts<br />
• Q2 2013 Olaparib and selumetinib<br />
data at ASCO<br />
• Q2 2013 More Fostamatinib Phase III<br />
(OSKIRA 2 & 3) studies readout in RA<br />
• Mid 2013 Onglyza (SAVOR) outcome<br />
study data expected.<br />
• Q4 2013 Lesinurad Phase III data in<br />
gout read out.<br />
• Q4 2013 Potential Forxiga US reg dec<br />
following ‘mid-year’ re-filing<br />
page 83 of 92<br />
Company Description<br />
AstraZeneca was formed in April 1999 when the UK-based Zeneca merged with Sweden's<br />
Astra AB, creating a company with 2011 revenues of $33.6bn. AstraZeneca is an almost<br />
pure play Pharma/Biologics/Vaccines company, with only minor interests in other<br />
healthcare areas such as patient care (Aptium), which accounts for less than 1% of group<br />
sales. AstraZeneca also has a significant joint venture with Merck & Co. from which the<br />
latter receives substantial royalties on a number of significant products including Prilosec<br />
and Nexium.<br />
Jeffrey Holford, PhD, ACA, Equity Analyst, (212) 336-7409, jholford@jefferies.com<br />
Please see important disclosure information on pages 88 - 92 of this <strong>report</strong>.
Healthcare<br />
Rating | Target | Estimate Change<br />
Bayer<br />
May 28, 2013<br />
Buy: €98 Price Target<br />
Scenarios<br />
Target Investment Thesis<br />
• Our 2013E Group sales and CORE EPS<br />
forecasts are broadly in-line with<br />
management guidance.<br />
• We are confident of growth in the<br />
Pharmaceuticals division and CropScience<br />
continues to benefit from strong<br />
commodity prices. MaterialScience cost<br />
and price pressures should now be<br />
stabilizing.<br />
• 2014 CORE EPS: €6.55; Target Multiple:<br />
15.0x; Target Price €98.<br />
Upside Scenario<br />
• Weaker-than-expected commercial<br />
performance for competitors (Pradaxa and<br />
Eliquis) raises Xarelto expectations.<br />
• Economic recovery delivers upside to<br />
current MaterialScience expectations.<br />
• Company moves forward with<br />
restructuring, separating MaterialScience.<br />
• New launches surprise on the upside<br />
(Eylea, Stivarga, Xofigo, Riociguat)<br />
• 2014 Target Multiple: 16.5x; Target Price:<br />
€108.<br />
Downside Scenario<br />
• Weaker-than-expected Xarelto growth<br />
• Economic weakness continues to hold<br />
MaterialScience back, below current<br />
assumptions.<br />
• CropsScience weakens below current<br />
expectations after commodity prices peak<br />
out.<br />
• 2014 Target Multiple: 13.4x; Target Price:<br />
€88.<br />
THE LONG VIEW<br />
Long Term Analysis<br />
1 Year Forward P/E<br />
Long Term Financial Model Drivers<br />
Other Considerations<br />
2012A-17E Revenue CAGR 5.0%<br />
2012A-17E CORE EPS CAGR 12.2%<br />
Acquisition Contribution 0%<br />
2012A-17E Operating Margin<br />
Expansion / (Contraction)<br />
+229bps<br />
MaterialScience still faces a degree of<br />
uncertainty from the current economic<br />
environment, but as this improves it<br />
should become an important positive<br />
driver. CropScience expects further<br />
growth in 2013. Pharmaceuticals is<br />
pressured by Betaseron competition and<br />
Yaz generics, but new and recently<br />
launched products should offset this.<br />
Source: DataStream, <strong>Jefferies</strong> estimates<br />
Peer Group<br />
Group P/Es (2014E)<br />
5Yr EPS CAGR (11A-16E) vs. P/E (‘14E)<br />
Recommendation / Price Target<br />
Ticker Rec. PT<br />
BAYN Buy €98<br />
AZN Hold 3,700p<br />
GSK Hold 1,900p<br />
NOVN Buy CHF88<br />
ROG Buy CHF285<br />
SAN Buy €100<br />
Source: Thomson Reuters, <strong>Jefferies</strong> estimates<br />
Source: Thomson Reuters, <strong>Jefferies</strong> estimates<br />
Catalysts<br />
• Q2’13: Regorafenib EU reg dec in mCRC.<br />
• H2’13 : Lemtrada regulatory decisions in<br />
US and Europe for MS (co-promotion with<br />
Sanofi).<br />
• Q4’13: Alpharadin regulatory decision in<br />
Europe for HRPC bone metastases.<br />
• Q4’13: Riociguat US reg dec in CTEPH /<br />
PAH (priority review)<br />
Company Description<br />
The Bayer Group is a global enterprise with core competencies in the fields of healthcare<br />
(pharmaceuticals and consumer), crop science and high-tech materials. Bayer HealthCare,<br />
a subsidiary of Bayer AG, is one of the world's leading, innovative companies in the<br />
healthcare and medical products industry and is based in Leverkusen, Germany.<br />
page 84 of 92<br />
Jeffrey Holford, PhD, ACA, Equity Analyst, (212) 336-7409, jholford@jefferies.com<br />
Please see important disclosure information on pages 88 - 92 of this <strong>report</strong>.
Healthcare<br />
Rating | Target | Estimate Change<br />
May 28, 2013<br />
Roche<br />
Buy: CHF285 Price Target<br />
Scenarios<br />
Target Investment Thesis<br />
• Forecasts for 2013 are in line with<br />
guidance which looks for Revenue growth<br />
in line with 2012 (JEFe +4%) and CORE EPS<br />
to grow ahead of sales (JEFe +10%) at<br />
constant exchange rates.<br />
• Main product growth helps offset<br />
accelerating declines in Pegasys and<br />
Lucentis.<br />
• 2014 Target Multiple: 18.4x; Target Price<br />
CHF.<br />
Upside Scenario<br />
• Stronger growth in 2013 due to strong<br />
Kadcyla launch and Perjeta uptake. Pegasys<br />
sees slower erosion from lower than<br />
anticipate warehousing ahead of all oral<br />
regimes launching.<br />
• Operating Margin expands further due to<br />
cost savings and operational gearing.<br />
• Positive data for PD-L1 and GA101 vs<br />
Rituxan.<br />
• 2014 Target Multiple: 19.3x; Target Price:<br />
CHF300<br />
Downside Scenario<br />
• Aggressive warehousing of Hep C patients<br />
leads to rapid erosion of Pegasys sales.<br />
Lucentis erosion accelerates due to Eylea<br />
competition. Kadcyla launch disappoints.<br />
• Operating Margin squeezed due to loss of<br />
high-margin sales with lower-thanexpected<br />
cost savings.<br />
• Emerging threats to Avastin and Herceptin<br />
(ramucirumab, PD1, biosimilars).<br />
• 2014 Target Multiple: 17.4x Target Price:<br />
CHF270<br />
THE LONG VIEW<br />
Long-Term Analysis<br />
1 Year Forward P/E<br />
Source: DataStream, <strong>Jefferies</strong> estimates<br />
Long-Term Financial Model Drivers<br />
(2012A-17E)<br />
LT Earnings CAGR<br />
(underlying)<br />
+9%<br />
Organic Revenue Growth +4%<br />
Operating Margin Expansion /<br />
(Contraction)<br />
+470bps<br />
Other Considerations<br />
Over the next five years we expect Roche to<br />
produce solid top-line growth. However, the<br />
EPS growth rate will temporarily slow,<br />
predominantly in 2014E, as Pegasys and<br />
Lucentis are both pressured by increasing<br />
competition, whilst Xeloda and Valcyte<br />
genericise. Nevertheless, we expect the<br />
company will use its strengthening balance<br />
sheet to bridge the gap before strong<br />
underlying fundamentals once again take<br />
over as the driver of growth<br />
Peer Group<br />
Group P/Es (2014E)<br />
Earnings Growth (12-17E) vs. P/E (‘14E)<br />
Recommendation / Price Target<br />
Ticker Rec. PT<br />
ROG Buy CHF285<br />
AZN Hold 3700p<br />
GSK Hold 1900p<br />
NOVN Buy CHF88<br />
SAN Buy €100<br />
Source: Thomson Reuters, <strong>Jefferies</strong> estimates<br />
Source: Thomson Reuters, <strong>Jefferies</strong> estimates<br />
Catalysts<br />
• Q2’13 ASCO further detail on GA101 and<br />
PD-L1<br />
• Q2’13 EU decision for Erivedge in<br />
advanced BCC<br />
• H2’13 EU regulatory decision for Kadcyla<br />
• H2’13 US & EU regulatory decision for<br />
GA101 (obinutuzumab) in CLL<br />
• Q4’13 Phase II PCSK9 LDL lowering data<br />
Company Description<br />
Roche is a global healthcare company. The Group operates through two divisions:<br />
Pharmaceuticals and Diagnostics. The Pharmaceuticals division develops prescription drugs<br />
through its discovery operations at Roche, Genentech and Chugai. Its Diagnostic segment<br />
provides products and services in all fields of medical testing, and is the global leader.<br />
Roche has a controlling interest and <strong>full</strong>y consolidates sales from Chugai in which it has a<br />
61.5% stake.<br />
page 85 of 92<br />
Jeffrey Holford, PhD, ACA, Equity Analyst, (212) 336-7409, jholford@jefferies.com<br />
Please see important disclosure information on pages 88 - 92 of this <strong>report</strong>.
Healthcare<br />
Rating | Target | Estimate Change<br />
Merck & Co.<br />
May 28, 2013<br />
Buy: $54.00 Price Target<br />
Scenarios<br />
Target Investment Thesis<br />
• We expect flat top-line growth<br />
(2012A-17E CAGR) combined with<br />
cost savings and financial engineering<br />
to deliver earnings growth of +3.5%<br />
(2012A-17E CAGR).<br />
• We expect shares to trade on a circa<br />
0% -5% premium to the 2014 US<br />
market PE multiple with a<br />
corresponding value of $54.00.<br />
Upside Scenario<br />
• Better-than-expected growth of key<br />
drivers such as Januvia and Isentress<br />
• Better-than-expected R&D execution<br />
and product launches for suvorexant,<br />
odanacatib, anti-PD-1 and Hep C<br />
• Potential restructuring of Consumer<br />
and Animal Health<br />
• Based on this scenario, we expect the<br />
shares to trade at 15% premium to the<br />
2013 US market PE multiple with a<br />
corresponding value of $58.00.<br />
Downside Scenario<br />
• Worse-than-expected growth of key<br />
drivers such as Januvia franchise and<br />
Isentress<br />
• R&D portfolio failures and poorly<br />
executed launches, e.g. suvorexant,<br />
odanacatib, anti-PD-1 and Hep C<br />
• If this scenario is achieved we expect<br />
the shares to trade at a 10% discount<br />
to the 2013 US market PE multiple<br />
with a corresponding value of<br />
$46.00.<br />
THE LONG VIEW<br />
Long Term Analysis<br />
1 Year Forward P/E<br />
Long Term Financial Model Drivers<br />
Other Considerations<br />
Source: DataStream, <strong>Jefferies</strong> estimates<br />
2012A-17E Revenues CAGR +0.0%<br />
2012A-17E Earnings CAGR +3.5%<br />
Management is under pressure to deliver<br />
shareholder value and improve top line<br />
growth. With the initiation of share<br />
repurchases the angst of the investors is<br />
quelled at least in the short-term. If<br />
pipeline does not deliver and top line does<br />
not grow the management could be<br />
forced to divest certain businesses such as<br />
Consumer and Animal Health which can<br />
unlock some of the shareholder value.<br />
Peer Group<br />
Group P/Es<br />
Earnings Growth vs P/E<br />
Recommendation / Price Target<br />
Ticker Rec. PT<br />
MRK Buy $54.00<br />
ABT Buy $45.00<br />
ABBV Buy $54.00<br />
BMY Buy $53.50<br />
JNJ Hold $97.00<br />
LLY Hold $49.00<br />
Source: DataStream, <strong>Jefferies</strong> estimates<br />
Source: DataStream, <strong>Jefferies</strong> estimates<br />
PFE Buy $33.00<br />
Catalysts<br />
• Incretin safety workshop 12 th -13 th<br />
June.<br />
• Suvorexant FDA regulatory decision<br />
Q3 ‘13.<br />
• FDA AdCom panel to review<br />
sugammadex application 18 th July.<br />
• HepC portfolio data Q4’13.<br />
Company Description<br />
Merck & Co. can trace its roots back to 1891 when the US subsidiary of the German<br />
Pharmaceuticals company E. Merck first began trading. From the company’s early exploits<br />
in the field of antibiotics, anti-inflammatory medicines and vaccines, amongst others,<br />
combined with a series of significant mergers and acquisitions, it is now one of the largest<br />
Pharmaceutical companies in the world with brand names including Zocor, Zetia, Vytorin<br />
and Januvia. Merck became one of the largest US pharmaceutical companies with the<br />
acquisition of Schering-Plough in 2009 and recorded $47bn in sales in 2012.<br />
page 86 of 92<br />
Jeffrey Holford, PhD, ACA, Equity Analyst, (212) 336-7409, jholford@jefferies.com<br />
Please see important disclosure information on pages 88 - 92 of this <strong>report</strong>.
Healthcare<br />
Rating | Target | Estimate Change<br />
Eli Lilly<br />
May 28, 2013<br />
Hold: $49.00 Price Target<br />
Scenarios<br />
Target Investment Thesis<br />
• We assume loss of Cymbalta in late<br />
2013 and Alimta in early 2017 to<br />
generics will drive flat revenues<br />
2012A-17E<br />
• We expect income funds to become<br />
increasingly cautious on the quality of<br />
the yield, given the high payout ratio.<br />
• Company fails to meet longer term<br />
margin targets<br />
Upside Scenario<br />
• Strong, positive Phase III breast cancer<br />
data for ramucirumab in Q4 2013.<br />
• Company prevails in the Alimta patent<br />
challenge (in court August 2013)<br />
• Company can meet longer term<br />
margin targets<br />
• Shares could trade on a yield support<br />
of 3.5% with a valuation of $56.00.<br />
Downside Scenario<br />
• Inability to maintain a well-covered<br />
dividend payment in the mid-term.<br />
• Key late stage pipeline<br />
disappointment.<br />
• In this scenario, we expect shares to<br />
trade at a dividend yield support of<br />
circa 4.5% equivalent to around<br />
$44.00.<br />
THE LONG VIEW<br />
• Target price of $49 per share is based<br />
on yield support around 4.0%<br />
Long Term Analysis<br />
1 Year Forward P/E<br />
Long Term Financial Model Drivers<br />
Other Considerations<br />
Source: DataStream, <strong>Jefferies</strong> estimates<br />
2012A-17E Revenues CAGR -0.5%<br />
2012A-17E Earnings CAGR -3.7%<br />
Management‘s current strategy includes<br />
organic growth through pipeline delivery<br />
and growth from Animal Health, Japan<br />
and Emerging markets. Stock price<br />
currently reflects pipeline catalysts and<br />
yield support. As yield approaches the<br />
sector average, reliance on pipeline<br />
delivery would increase. However pipeline<br />
efficacy has lately been less than robust<br />
with no sign of near-term inflection.<br />
Peer Group<br />
Group P/Es<br />
Earnings Growth vs P/E<br />
Recommendation / Price Target<br />
Ticker Rec. PT<br />
LLY Hold $49.00<br />
ABBV Buy $54.00<br />
BMY Buy $53.50<br />
JNJ Hold $97.00<br />
MRK Buy $54.00<br />
PFE Buy $33.00<br />
Source: DataStream, <strong>Jefferies</strong> estimates<br />
Source: DataStream, <strong>Jefferies</strong> estimates<br />
Catalysts<br />
• Further Phase III data/details from<br />
dulaglutide AWARD program.at ADA<br />
Q2’13<br />
• Empagliflozin Phase III headline data<br />
and presentation at ADA Q2’13<br />
• Ramucirumab Phase III data/details in<br />
breast cancer at SABCS Q4’13<br />
• Analyst Day (3 rd Oct)<br />
Company Description<br />
Eli Lilly and Company was founded in 1876 in Indiana. Lilly discovers, develops,<br />
manufactures and sells pharmaceutical products and also has an Animal Health business<br />
segment. In 2012, Eli Lilly generated group net sales of $22.6bn.<br />
page 87 of 92<br />
Jeffrey Holford, PhD, ACA, Equity Analyst, (212) 336-7409, jholford@jefferies.com<br />
Please see important disclosure information on pages 88 - 92 of this <strong>report</strong>.
Healthcare<br />
Rating | Target | Estimate Change<br />
May 28, 2013<br />
Company Description<br />
Abbott Laboratories (Abbott) is engaged in discovery, development, manufacture, and sale of diversified lines of healthcare products. The<br />
Company operates in four segments: Pharmaceutical Products, Diagnostic Products, Nutritional Products and Vascular Products.<br />
AbbVie is a research-based specialty biopharmaceuticals company with a broad portfolio of medicines, including leadership in immunology<br />
and virology, and a pipeline of breakthrough therapies.<br />
AstraZeneca was formed in April 1999 when the UK-based Zeneca merged with Sweden's Astra AB, creating a company with 2011 revenues<br />
of $33.6bn. AstraZeneca is an almost pure play Pharma/Biologics/Vaccines company, with only minor interests in other healthcare areas such<br />
as patient care (Aptium), which accounts for less than 1% of group sales. AstraZeneca also has a significant joint venture with Merck & Co.<br />
from which the latter receives substantial royalties on a number of significant products including Prilosec and Nexium.<br />
The Bayer Group is a global enterprise with core competencies in the fields of healthcare (pharmaceuticals and consumer), crop science and<br />
high-tech materials. Bayer HealthCare, a subsidiary of Bayer AG, is one of the world's leading, innovative companies in the healthcare and<br />
medical products industry and is based in Leverkusen, Germany.<br />
Bristol-Myers Squibb Company was incorporated under the laws of the state of Delaware in August 1933 under the name of Bristol-Myers<br />
Company. In 1989, Bristol-Myers Company changed its name as a result of a merger. The company is engaged in the discovery, development,<br />
licensing, manufacturing, marketing, distribution and sale of pharmaceutical products.<br />
Eli Lilly and Company was founded in 1876 in Indiana. Lilly discovers, develops, manufactures, and sells pharmaceutical products and also<br />
has an animal health business segment.<br />
GlaxoSmithKline was formed in 2001 through the merger of Glaxo Wellcome and SmithKline Beecham to form one of the World's largest<br />
Pharmaceuticals companies. The company primarily operates in the fields of Pharmaceuticals, Vaccines and Consumer Health.<br />
Johnson & Johnson is engaged in the research and development, manufacture and sale of a range of products in the healthcare field. The<br />
Company operates in three business segments: Consumer, Pharmaceutical, and Medical Devices and Diagnostics.<br />
Merck is a global research-driven company that discovers, manufactures, and markets a broad range of innovative products to improve human<br />
and animal health. The company merged with Schering-Plough & Co. in 2009.<br />
Novartis was formed in 1996 from the merger of Sandoz and Ciba-Geigy. Since then, a variety of acquisitions and non-healthcare related<br />
disposals have created a global diversified healthcare company. Its business areas now spread outside the core branded pharmaceuticals into<br />
ophthalmics, generics, consumer healthcare and vaccines & diagnostics.<br />
Novo Nordisk is a pharmaceuticals company focusing on diabetes care and biopharmaceuticals. It is a market leader in insulin therapy in both<br />
the human insulins and insulin analogues segment. The Biopharmaceutical division focuses on haemostasis management, growth hormone<br />
therapy and hormone replacement therapy.<br />
Pfizer Inc. is a research-based, global pharmaceutical company that was incorporated in Delaware in 1942 and discovers, develops,<br />
manufactures and markets leading prescription medicines for humans and animals. In 2009 the company acquired Wyeth.<br />
Roche is a global healthcare company. The Group operates through two divisions: Pharmaceuticals and Diagnostics. The Pharmaceuticals<br />
division develops prescription drugs through its discovery operations at Roche, Genentech in the US and Chugai in Japan. Its diagnostic<br />
segment provides products and services in all fields of medical testing, and is the global leader. Roche has a controlling interest and <strong>full</strong>y<br />
consolidated sales from Chugai in which it has a 61.5% stake.<br />
Sanofi was created through the acquisition of Aventis by Sanofi-Synthelabo in 2004. Since then, a variety of acquisitions have created a global<br />
diversified healthcare company. Sanofi's business is comprised of three main segments namely Pharmaceuticals, Vaccines, and Animal Health.<br />
Zoetis, Inc. is a global leader in the discovery, development, manufacture and commercialization of animal health medicines and vaccines,<br />
with a focus on both livestock and companion animals. Zoetis represents the largest animal health business in the world, with over $4.2bn<br />
in revenue in 2011.<br />
Analyst Certification<br />
page 88 of 92<br />
Jeffrey Holford, PhD, ACA, Equity Analyst, (212) 336-7409, jholford@jefferies.com<br />
Please see important disclosure information on pages 88 - 92 of this <strong>report</strong>.
Healthcare<br />
Rating | Target | Estimate Change<br />
May 28, 2013<br />
I, Jeffrey Holford, PhD, ACA, certify that all of the views expressed in this research <strong>report</strong> accurately reflect my personal views about the subject<br />
security(ies) and subject company(ies). I also certify that no part of my compensation was, is, or will be, directly or indirectly, related to the specific<br />
recommendations or views expressed in this research <strong>report</strong>.<br />
I, Ian Hilliker, certify that all of the views expressed in this research <strong>report</strong> accurately reflect my personal views about the subject security(ies) and<br />
subject company(ies). I also certify that no part of my compensation was, is, or will be, directly or indirectly, related to the specific recommendations<br />
or views expressed in this research <strong>report</strong>.<br />
I, Terence McManus, PhD, certify that all of the views expressed in this research <strong>report</strong> accurately reflect my personal views about the subject<br />
security(ies) and subject company(ies). I also certify that no part of my compensation was, is, or will be, directly or indirectly, related to the specific<br />
recommendations or views expressed in this research <strong>report</strong>.<br />
I, Swayampakula Ramakanth, PhD, MBA, certify that all of the views expressed in this research <strong>report</strong> accurately reflect my personal views about the<br />
subject security(ies) and subject company(ies). I also certify that no part of my compensation was, is, or will be, directly or indirectly, related to the<br />
specific recommendations or views expressed in this research <strong>report</strong>.<br />
Registration of non-US analysts: Ian Hilliker is employed by <strong>Jefferies</strong> International Limited, a non-US affiliate of <strong>Jefferies</strong> LLC and is not registered/<br />
qualified as a research analyst with FINRA. This analyst(s) may not be an associated person of <strong>Jefferies</strong> LLC, a FINRA member firm, and therefore may<br />
not be subject to the NASD Rule 2711 and Incorporated NYSE Rule 472 restrictions on communications with a subject company, public appearances<br />
and trading securities held by a research analyst.<br />
Registration of non-US analysts: Terence McManus, PhD is employed by <strong>Jefferies</strong> International Limited, a non-US affiliate of <strong>Jefferies</strong> LLC and is<br />
not registered/qualified as a research analyst with FINRA. This analyst(s) may not be an associated person of <strong>Jefferies</strong> LLC, a FINRA member firm, and<br />
therefore may not be subject to the NASD Rule 2711 and Incorporated NYSE Rule 472 restrictions on communications with a subject company, public<br />
appearances and trading securities held by a research analyst.<br />
As is the case with all <strong>Jefferies</strong> employees, the analyst(s) responsible for the coverage of the financial instruments discussed in this <strong>report</strong> receives<br />
compensation based in part on the overall performance of the firm, including investment banking income. We seek to update our research as<br />
appropriate, but various regulations may prevent us from doing so. Aside from certain industry <strong>report</strong>s published on a periodic basis, the large majority<br />
of <strong>report</strong>s are published at irregular intervals as appropriate in the analyst's judgement.<br />
<strong>Jefferies</strong> Group LLC is advising Bristol Myers Squibb on its business combination with Reckitt Benckiser Group Plc regarding Latin American licenses<br />
Company Specific Disclosures<br />
For Important Disclosure information on companies recommended in this <strong>report</strong>, please visit our website at https://javatar.bluematrix.com/sellside/<br />
Disclosures.action or call 212.284.2300.<br />
Meanings of <strong>Jefferies</strong> Ratings<br />
Buy - Describes stocks that we expect to provide a total return (price appreciation plus yield) of 15% or more within a 12-month period.<br />
Hold - Describes stocks that we expect to provide a total return (price appreciation plus yield) of plus 15% or minus 10% within a 12-month period.<br />
Underperform - Describes stocks that we expect to provide a total negative return (price appreciation plus yield) of 10% or more within a 12-month<br />
period.<br />
The expected total return (price appreciation plus yield) for Buy rated stocks with an average stock price consistently below $10 is 20% or more within<br />
a 12-month period as these companies are typically more volatile than the overall stock market. For Hold rated stocks with an average stock price<br />
consistently below $10, the expected total return (price appreciation plus yield) is plus or minus 20% within a 12-month period. For Underperform<br />
rated stocks with an average stock price consistently below $10, the expected total return (price appreciation plus yield) is minus 20% within a 12-<br />
month period.<br />
NR - The investment rating and price target have been temporarily suspended. Such suspensions are in compliance with applicable regulations and/<br />
or <strong>Jefferies</strong> policies.<br />
CS - Coverage Suspended. <strong>Jefferies</strong> has suspended coverage of this company.<br />
NC - Not covered. <strong>Jefferies</strong> does not cover this company.<br />
Restricted - Describes issuers where, in conjunction with <strong>Jefferies</strong> engagement in certain transactions, company policy or applicable securities<br />
regulations prohibit certain types of communications, including investment recommendations.<br />
Monitor - Describes stocks whose company fundamentals and financials are being monitored, and for which no financial projections or opinions on<br />
the investment merits of the company are provided.<br />
Valuation Methodology<br />
<strong>Jefferies</strong>' methodology for assigning ratings may include the following: market capitalization, maturity, growth/value, volatility and expected total<br />
return over the next 12 months. The price targets are based on several methodologies, which may include, but are not restricted to, analyses of market<br />
risk, growth rate, revenue stream, discounted cash flow (DCF), EBITDA, EPS, cash flow (CF), free cash flow (FCF), EV/EBITDA, P/E, PE/growth, P/CF,<br />
P/FCF, premium (discount)/average group EV/EBITDA, premium (discount)/average group P/E, sum of the parts, net asset value, dividend returns,<br />
and return on equity (ROE) over the next 12 months.<br />
Conviction List Methodology<br />
1. The aim of the conviction list is to publicise the best individual stock ideas from <strong>Jefferies</strong> Global Research<br />
2. Only stocks with a Buy or Underperform rating are allowed to be included in the recommended list.<br />
page 89 of 92<br />
Jeffrey Holford, PhD, ACA, Equity Analyst, (212) 336-7409, jholford@jefferies.com<br />
Please see important disclosure information on pages 88 - 92 of this <strong>report</strong>.
Healthcare<br />
Rating | Target | Estimate Change<br />
May 28, 2013<br />
3. Stocks are screened for minimum market capitalisation and adequate daily turnover. Furthermore, a valuation, correlation and style screen<br />
is used to ensure a well-diversified portfolio.<br />
4. Stocks are sorted to a maximum of 30 stocks with the maximum country exposure at around 50%. Limits are also imposed on a sector basis.<br />
5. Once a month, analysts are invited to recommend their best ideas. Analysts’ stock selection can be based on one or more of the following:<br />
non-Consensus investment view, difference in earnings relative to Consensus, valuation methodology, target upside/downside % relative<br />
to the current stock price. These are then assessed against existing holdings to ensure consistency. Stocks that have either reached their<br />
target price, been downgraded over the course of the month or where a more suitable candidate has been found are removed.<br />
6. All stocks are inserted at the last closing price and removed at the last closing price. There are no changes to the conviction list during<br />
the month.<br />
7. Performance is calculated in US dollars on an equally weighted basis and is compared to MSCI World AC US$.<br />
8. The conviction list is published once a month whilst global equity markets are closed.<br />
9. Transaction fees are not included.<br />
10. All corporate actions are taken into account.<br />
Risk which may impede the achievement of our Price Target<br />
This <strong>report</strong> was prepared for general circulation and does not provide investment recommendations specific to individual investors. As such, the<br />
financial instruments discussed in this <strong>report</strong> may not be suitable for all investors and investors must make their own investment decisions based<br />
upon their specific investment objectives and financial situation utilizing their own financial advisors as they deem necessary. Past performance of<br />
the financial instruments recommended in this <strong>report</strong> should not be taken as an indication or guarantee of future results. The price, value of, and<br />
income from, any of the financial instruments mentioned in this <strong>report</strong> can rise as well as fall and may be affected by changes in economic, financial<br />
and political factors. If a financial instrument is denominated in a currency other than the investor's home currency, a change in exchange rates may<br />
adversely affect the price of, value of, or income derived from the financial instrument described in this <strong>report</strong>. In addition, investors in securities such<br />
as ADRs, whose values are affected by the currency of the underlying security, effectively assume currency risk.<br />
Other Companies Mentioned in This Report<br />
• Abbott Laboratories (ABT: $37.76, BUY)<br />
• AbbVie (ABBV: $45.44, BUY)<br />
• AstraZeneca PLC (AZN LN: p3,428.00, HOLD)<br />
• Bayer AG (BAYN GR: €84.46, BUY)<br />
• Bristol-Myers Squibb (BMY: $47.40, BUY)<br />
• Eli Lilly & Co. (LLY: $54.14, HOLD)<br />
• GlaxoSmithKline Plc (GSK LN: p1,749.50, HOLD)<br />
• Johnson & Johnson (JNJ: $86.82, HOLD)<br />
• Merck & Co. (MRK: $47.16, BUY)<br />
• Novartis AG (NOVN VX: CHF71.25, BUY)<br />
• Novo Nordisk (NOVOB DC: DKK967.50, HOLD)<br />
• Pfizer, Inc. (PFE: $29.04, BUY)<br />
• Roche (ROG VX: CHF253.10, BUY)<br />
• Sanofi (SAN FP: €84.51, BUY)<br />
• Zoetis, Inc. (ZTS: $33.46, BUY)<br />
Distribution of Ratings<br />
IB Serv./Past 12 Mos.<br />
Rating Count Percent Count Percent<br />
BUY 771 46.95% 146 18.94%<br />
HOLD 742 45.19% 92 12.40%<br />
UNDERPERFORM 129 7.86% 2 1.55%<br />
Other Important Disclosures<br />
<strong>Jefferies</strong> Equity Research refers to research <strong>report</strong>s produced by analysts employed by one of the following <strong>Jefferies</strong> Group LLC (“<strong>Jefferies</strong>”) group<br />
companies:<br />
United States: <strong>Jefferies</strong> LLC which is an SEC registered firm and a member of FINRA.<br />
United Kingdom: <strong>Jefferies</strong> International Limited, which is authorized and regulated by the Financial Conduct Authority; registered in England and<br />
Wales No. 1978621; registered office: Vintners Place, 68 Upper Thames Street, London EC4V 3BJ; telephone +44 (0)20 7029 8000; facsimile +44 (0)20<br />
7029 8010.<br />
Hong Kong: <strong>Jefferies</strong> Hong Kong Limited, which is licensed by the Securities and Futures Commission of Hong Kong with CE number ATS546; located<br />
at Suite 2201, 22nd Floor, Cheung Kong Center, 2 Queen’s Road Central, Hong Kong.<br />
page 90 of 92<br />
Jeffrey Holford, PhD, ACA, Equity Analyst, (212) 336-7409, jholford@jefferies.com<br />
Please see important disclosure information on pages 88 - 92 of this <strong>report</strong>.
Healthcare<br />
Rating | Target | Estimate Change<br />
May 28, 2013<br />
Singapore: <strong>Jefferies</strong> Singapore Limited, which is licensed by the Monetary Authority of Singapore; located at 80 Raffles Place #15-20, UOB Plaza 2,<br />
Singapore 048624, telephone: +65 6551 3950.<br />
Japan: <strong>Jefferies</strong> (Japan) Limited, Tokyo Branch, which is a securities company registered by the Financial Services Agency of Japan and is a member<br />
of the Japan Securities Dealers Association; located at Hibiya Marine Bldg, 3F, 1-5-1 Yuraku-cho, Chiyoda-ku, Tokyo 100-0006; telephone +813 5251<br />
6100; facsimile +813 5251 6101.<br />
India: <strong>Jefferies</strong> India Private Limited, which is licensed by the Securities and Exchange Board of India as a Merchant Banker (INM000011443) and a Stock<br />
Broker with Bombay Stock Exchange Limited (INB011438539) and National Stock Exchange of India Limited (INB231438533) in the Capital Market<br />
Segment; located at 42/43, 2 North Avenue, Maker Maxity, Bandra-Kurla Complex, Bandra (East) Mumbai 400 051, India; Tel +91 22 4356 6000.<br />
This material has been prepared by <strong>Jefferies</strong> employing appropriate expertise, and in the belief that it is fair and not misleading. The information set<br />
forth herein was obtained from sources believed to be reliable, but has not been independently verified by <strong>Jefferies</strong>. Therefore, except for any obligation<br />
under applicable rules we do not guarantee its accuracy. Additional and supporting information is available upon request. Unless prohibited by the<br />
provisions of Regulation S of the U.S. Securities Act of 1933, this material is distributed in the United States ("US"), by <strong>Jefferies</strong> LLC, a US-registered<br />
broker-dealer, which accepts responsibility for its contents in accordance with the provisions of Rule 15a-6, under the US Securities Exchange Act of<br />
1934. Transactions by or on behalf of any US person may only be effected through <strong>Jefferies</strong> LLC. In the United Kingdom and European Economic<br />
Area this <strong>report</strong> is issued and/or approved for distribution by <strong>Jefferies</strong> International Limited and is intended for use only by persons who have, or have<br />
been assessed as having, suitable professional experience and expertise, or by persons to whom it can be otherwise law<strong>full</strong>y distributed. <strong>Jefferies</strong><br />
International Limited has adopted a conflicts management policy in connection with the preparation and publication of research, the details of which<br />
are available upon request in writing to the Compliance Officer. <strong>Jefferies</strong> International Limited may allow its analysts to undertake private consultancy<br />
work. <strong>Jefferies</strong> International Limited’s conflicts management policy sets out the arrangements <strong>Jefferies</strong> International Limited employs to manage any<br />
potential conflicts of interest that may arise as a result of such consultancy work. For Canadian investors, this material is intended for use only by<br />
professional or institutional investors. None of the investments or investment services mentioned or described herein is available to other persons<br />
or to anyone in Canada who is not a "Designated Institution" as defined by the Securities Act (Ontario). In Singapore, <strong>Jefferies</strong> Singapore Limited is<br />
regulated by the Monetary Authority of Singapore. For investors in the Republic of Singapore, this material is provided by <strong>Jefferies</strong> Singapore Limited<br />
pursuant to Regulation 32C of the Financial Advisers Regulations. The material contained in this document is intended solely for accredited, expert or<br />
institutional investors, as defined under the Securities and Futures Act (Cap. 289 of Singapore). If there are any matters arising from, or in connection<br />
with this material, please contact <strong>Jefferies</strong> Singapore Limited, located at 80 Raffles Place #15-20, UOB Plaza 2, Singapore 048624, telephone: +65<br />
6551 3950. In Japan this material is issued and distributed by <strong>Jefferies</strong> (Japan) Limited to institutional investors only. In Hong Kong, this <strong>report</strong> is<br />
issued and approved by <strong>Jefferies</strong> Hong Kong Limited and is intended for use only by professional investors as defined in the Hong Kong Securities and<br />
Futures Ordinance and its subsidiary legislation. In the Republic of China (Taiwan), this <strong>report</strong> should not be distributed. The research in relation to<br />
this <strong>report</strong> is conducted outside the PRC. This <strong>report</strong> does not constitute an offer to sell or the solicitation of an offer to buy any securities in the PRC.<br />
PRC investors shall have the relevant qualifications to invest in such securities and shall be responsible for obtaining all relevant approvals, licenses,<br />
verifications and/or registrations from the relevant governmental authorities themselves. In India this <strong>report</strong> is made available by <strong>Jefferies</strong> India Private<br />
Limited. In Australia this information is issued solely by <strong>Jefferies</strong> International Limited and is directed solely at wholesale clients within the meaning of<br />
the Corporations Act 2001 of Australia (the "Act") in connection with their consideration of any investment or investment service that is the subject of<br />
this document. Any offer or issue that is the subject of this document does not require, and this document is not, a disclosure document or product<br />
disclosure statement within the meaning of the Act. <strong>Jefferies</strong> International Limited is authorised and regulated by the Financial Conduct Authority<br />
under the laws of the United Kingdom, which differ from Australian laws. <strong>Jefferies</strong> International Limited has obtained relief under Australian Securities<br />
and Investments Commission Class Order 03/1099, which conditionally exempts it from holding an Australian financial services licence under the<br />
Act in respect of the provision of certain financial services to wholesale clients. Recipients of this document in any other jurisdictions should inform<br />
themselves about and observe any applicable legal requirements in relation to the receipt of this document.<br />
This <strong>report</strong> is not an offer or solicitation of an offer to buy or sell any security or derivative instrument, or to make any investment. Any opinion or<br />
estimate constitutes the preparer's best judgment as of the date of preparation, and is subject to change without notice. <strong>Jefferies</strong> assumes no obligation<br />
to maintain or update this <strong>report</strong> based on subsequent information and events. <strong>Jefferies</strong>, its associates or affiliates, and its respective officers, directors,<br />
and employees may have long or short positions in, or may buy or sell any of the securities, derivative instruments or other investments mentioned or<br />
described herein, either as agent or as principal for their own account. Upon request <strong>Jefferies</strong> may provide specialized research products or services<br />
to certain customers focusing on the prospects for individual covered stocks as compared to other covered stocks over varying time horizons or<br />
under differing market conditions. While the views expressed in these situations may not always be directionally consistent with the long-term views<br />
expressed in the analyst's published research, the analyst has a reasonable basis and any inconsistencies can be reasonably explained. This material<br />
does not constitute a personal recommendation or take into account the particular investment objectives, financial situations, or needs of individual<br />
clients. Clients should consider whether any advice or recommendation in this <strong>report</strong> is suitable for their particular circumstances and, if appropriate,<br />
seek professional advice, including tax advice. The price and value of the investments referred to herein and the income from them may fluctuate. Past<br />
performance is not a guide to future performance, future returns are not guaranteed, and a loss of original capital may occur. Fluctuations in exchange<br />
rates could have adverse effects on the value or price of, or income derived from, certain investments. This <strong>report</strong> has been prepared independently of<br />
any issuer of securities mentioned herein and not in connection with any proposed offering of securities or as agent of any issuer of securities. None<br />
of <strong>Jefferies</strong>, any of its affiliates or its research analysts has any authority whatsoever to make any representations or warranty on behalf of the issuer(s).<br />
<strong>Jefferies</strong> policy prohibits research personnel from disclosing a recommendation, investment rating, or investment thesis for review by an issuer prior<br />
to the publication of a research <strong>report</strong> containing such rating, recommendation or investment thesis. Any comments or statements made herein are<br />
those of the author(s) and may differ from the views of <strong>Jefferies</strong>.<br />
This <strong>report</strong> may contain information obtained from third parties, including ratings from credit ratings agencies such as Standard & Poor’s. Reproduction<br />
and distribution of third party content in any form is prohibited except with the prior written permission of the related third party. Third party content<br />
page 91 of 92<br />
Jeffrey Holford, PhD, ACA, Equity Analyst, (212) 336-7409, jholford@jefferies.com<br />
Please see important disclosure information on pages 88 - 92 of this <strong>report</strong>.
Healthcare<br />
Rating | Target | Estimate Change<br />
May 28, 2013<br />
providers do not guarantee the accuracy, completeness, timeliness or availability of any information, including ratings, and are not responsible for<br />
any errors or omissions (negligent or otherwise), regardless of the cause, or for the results obtained from the use of such content. Third party content<br />
providers give no express or implied warranties, including, but not limited to, any warranties of merchantability or fitness for a particular purpose or<br />
use. Third party content providers shall not be liable for any direct, indirect, incidental, exemplary, compensatory, punitive, special or consequential<br />
damages, costs, expenses, legal fees, or losses (including lost income or profits and opportunity costs) in connection with any use of their content,<br />
including ratings. Credit ratings are statements of opinions and are not statements of fact or recommendations to purchase, hold or sell securities. They<br />
do not address the suitability of securities or the suitability of securities for investment purposes, and should not be relied on as investment advice.<br />
<strong>Jefferies</strong> research <strong>report</strong>s are disseminated and available primarily electronically, and, in some cases, in printed form. Electronic research is<br />
simultaneously available to all clients. This <strong>report</strong> or any portion hereof may not be reprinted, sold or redistributed without the written consent of<br />
<strong>Jefferies</strong>. Neither <strong>Jefferies</strong> nor any officer nor employee of <strong>Jefferies</strong> accepts any liability whatsoever for any direct, indirect or consequential damages<br />
or losses arising from any use of this <strong>report</strong> or its contents.<br />
For Important Disclosure information, please visit our website at https://javatar.bluematrix.com/sellside/Disclosures.action or call 1.888.JEFFERIES<br />
© 2013 <strong>Jefferies</strong> Group LLC<br />
page 92 of 92<br />
Jeffrey Holford, PhD, ACA, Equity Analyst, (212) 336-7409, jholford@jefferies.com<br />
Please see important disclosure information on pages 88 - 92 of this <strong>report</strong>.

![1530 Wed 3 Basic Energy Services [Compatibility Mode] - Jefferies](https://img.yumpu.com/23648530/1/190x135/1530-wed-3-basic-energy-services-compatibility-mode-jefferies.jpg?quality=85)