Explanation of Terms.databkxls - Jefferson County Public Schools
Explanation of Terms.databkxls - Jefferson County Public Schools
Explanation of Terms.databkxls - Jefferson County Public Schools
You also want an ePaper? Increase the reach of your titles
YUMPU automatically turns print PDFs into web optimized ePapers that Google loves.
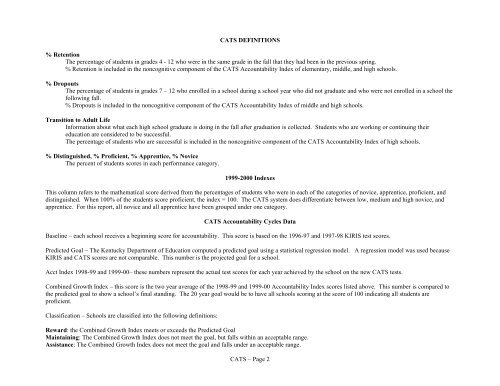
CATS DEFINITIONS<br />
% Retention<br />
The percentage <strong>of</strong> students in grades 4 - 12 who were in the same grade in the fall that they had been in the previous spring.<br />
% Retention is included in the noncognitive component <strong>of</strong> the CATS Accountability Index <strong>of</strong> elementary, middle, and high schools.<br />
% Dropouts<br />
The percentage <strong>of</strong> students in grades 7 – 12 who enrolled in a school during a school year who did not graduate and who were not enrolled in a school the<br />
following fall.<br />
% Dropouts is included in the noncognitive component <strong>of</strong> the CATS Accountability Index <strong>of</strong> middle and high schools.<br />
Transition to Adult Life<br />
Information about what each high school graduate is doing in the fall after graduation is collected. Students who are working or continuing their<br />
education are considered to be successful.<br />
The percentage <strong>of</strong> students who are successful is included in the noncognitive component <strong>of</strong> the CATS Accountability Index <strong>of</strong> high schools.<br />
% Distinguished, % Pr<strong>of</strong>icient, % Apprentice, % Novice<br />
The percent <strong>of</strong> students scores in each performance category.<br />
1999-2000 Indexes<br />
This column refers to the mathematical score derived from the percentages <strong>of</strong> students who were in each <strong>of</strong> the categories <strong>of</strong> novice, apprentice, pr<strong>of</strong>icient, and<br />
distinguished. When 100% <strong>of</strong> the students score pr<strong>of</strong>icient, the index = 100. The CATS system does differentiate between low, medium and high novice, and<br />
apprentice. For this report, all novice and all apprentice have been grouped under one category.<br />
CATS Accountability Cycles Data<br />
Baseline – each school receives a beginning score for accountability. This score is based on the 1996-97 and 1997-98 KIRIS test scores.<br />
Predicted Goal – The Kentucky Department <strong>of</strong> Education computed a predicted goal using a statistical regression model. A regression model was used because<br />
KIRIS and CATS scores are not comparable. This number is the projected goal for a school.<br />
Acct Index 1998-99 and 1999-00– these numbers represent the actual test scores for each year achieved by the school on the new CATS tests.<br />
Combined Growth Index – this score is the two year average <strong>of</strong> the 1998-99 and 1999-00 Accountability Index scores listed above. This number is compared to<br />
the predicted goal to show a school’s final standing. The 20 year goal would be to have all schools scoring at the score <strong>of</strong> 100 indicating all students are<br />
pr<strong>of</strong>icient.<br />
Classification – <strong>Schools</strong> are classified into the following definitions:<br />
Reward: the Combined Growth Index meets or exceeds the Predicted Goal<br />
Maintaining: The Combined Growth Index does not meet the goal, but falls within an acceptable range.<br />
Assistance: The Combined Growth Index does not meet the goal and falls under an acceptable range.<br />
CATS – Page 2


