Operating profit - JUKI
Operating profit - JUKI
Operating profit - JUKI

You also want an ePaper? Increase the reach of your titles
YUMPU automatically turns print PDFs into web optimized ePapers that Google loves.
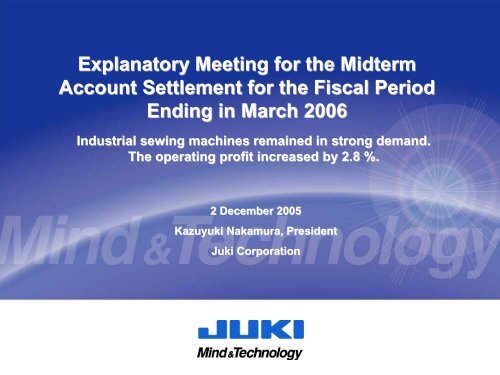
Explanatory Meeting for the Midterm<br />
Account Settlement for the Fiscal Period<br />
Ending in March 2006<br />
Industrial sewing machines remained in strong demand.<br />
The operating <strong>profit</strong> increased by 2.8 %.<br />
2 December 2005<br />
Kazuyuki Nakamura, President<br />
Juki Corporation<br />
0
Table of Contents<br />
Part 1 Business performance for the first half of fiscal period (2005) ending in March 2006<br />
1-1-1 Business performance for the first half of fiscal period (2005) ending in March 2006<br />
1-1-2 Business performance for the first half of fiscal period (2005) ending in March 2006: Change in the business performance<br />
1-2-1 Change in major financial index: Gross assets/Interest-bearing debts<br />
1-2-2 Change in major financial index: Equity capital/Earned surplus<br />
1-3 Change in cash flow (for operation and investment)<br />
Part 2 Segment-by-segment business performance and trend in the business<br />
2-1-1Change in the segment-by-segment sales: Comparison with the first second halves of fiscal 2004<br />
2-1-2Change in the segment-by-segment <strong>profit</strong>: Comparison with the first and second halves of fiscal 2004<br />
2-2-1Industrial sewing machines business: Change in the amount of sales and operating <strong>profit</strong><br />
2-2-2Industrial sewing machines business: Change in the region-by-region sales<br />
2-2-3Industrial sewing machines business: Major new products launched in the first half of fiscal 2005<br />
2-3-1SMT systems business: Change in the amount of sales and operating <strong>profit</strong><br />
2-3-2SMT systems business: Change in the region-by-region sales<br />
2-3-3SMT systems business: New products<br />
2-4-1Household sewing machines business: Change in the sales and operating <strong>profit</strong><br />
2-4-2Household sewing machines business: Change in region-by-region sales<br />
2-5 Electronic equipment and computer peripherals business: Change in sales and operating <strong>profit</strong><br />
2-6 Other lines of business<br />
Part 3 Business performance forecast throughout the fiscal period (2005) ending March 2006<br />
3-1 Business performance forecast throughout the fiscal period (2005) ending March 2006: Comparison with the previous fiscal year<br />
3-2-1Segment-by-segment business performance forecast: Year-on-year comparison of sales<br />
3-2-2Segment-by-segment business performance forecast: Year-on-year comparison of the operating <strong>profit</strong><br />
1
Part 1<br />
Business performance for the first half of<br />
fiscal period (2005) ending in 2006<br />
2
1-1-1<br />
Business performance for the first half of the fiscal period (2005) ending in March 2006<br />
Change in business performance: Comparison with the first and second halves of fiscal 2004<br />
Income decreased by 4.7 % from the level reported in the first half of<br />
2004. <strong>Operating</strong> <strong>profit</strong>, on the other hand, increased by 2.8 %. Ordinary<br />
<strong>profit</strong> decreased by 67 million yen. The current net <strong>profit</strong> increased by<br />
1,065 million yen.<br />
Unit: Million yen<br />
Result for the<br />
first half of<br />
fiscal 2004<br />
Result for the<br />
second half<br />
of fiscal 2004<br />
Result for the<br />
first half of<br />
fiscal 2005<br />
Comparison with<br />
the result for the<br />
first half of 2004<br />
Increase/decrease<br />
Comparison with<br />
the result for the<br />
second half of 2004<br />
Increase/decrease<br />
Amount of sales<br />
6,696.2 6,098.7 6,379.8 △316.4 281.1<br />
<strong>Operating</strong> <strong>profit</strong><br />
582.9<br />
461.2<br />
599.5<br />
16.6<br />
138.3<br />
Ordinary <strong>profit</strong><br />
507.9<br />
356.7<br />
501.2<br />
△6.7<br />
144.5<br />
Current net <strong>profit</strong><br />
190.4<br />
361.9<br />
296.9<br />
106.5<br />
△65.0<br />
3
1-1-2<br />
Business performance for the first half of fiscal period (2005)<br />
ending in March 2006: Change in the business performance<br />
The business result dropped in the second half of 2004. Both the<br />
amount of sales and operating <strong>profit</strong> recovered in the first half of fiscal<br />
2005, however.<br />
Amount of sales<br />
(Amount of sales)<br />
Unit: Billion yen<br />
70<br />
60<br />
50<br />
40<br />
30<br />
20<br />
10<br />
0<br />
66.9<br />
Result for the<br />
first half of<br />
fiscal 2004<br />
60.9<br />
5.8<br />
5.0<br />
4.6<br />
3.5<br />
Result for the<br />
second half of<br />
fiscal 2004<br />
63.7<br />
6.0<br />
5.0<br />
Result for the<br />
first half of<br />
fiscal 2005<br />
(<strong>Operating</strong> <strong>profit</strong><br />
Ordinary <strong>profit</strong>)<br />
6<br />
5<br />
4<br />
3<br />
2<br />
1<br />
0<br />
The amount of sales dropped in the<br />
second half of fiscal 2004. It recovered<br />
moderately in the first half of fiscal 2005,<br />
but not to the level reported in the first<br />
half of fiscal 2004.<br />
<strong>Operating</strong> <strong>profit</strong><br />
<strong>Operating</strong> <strong>profit</strong> dropped in the second<br />
half of fiscal 2004 and recovered in the<br />
first half of fiscal 2005.<br />
Profit in the first half of fiscal 2005 rose<br />
from the level reported in the first half<br />
of fiscal 2004.<br />
Ordinary <strong>profit</strong><br />
Ordinary <strong>profit</strong> dropped in the second<br />
half of fiscal 2004 and recovered in the<br />
first half of fiscal 2005. Profit for the<br />
first half of fiscal 2005 stood at about<br />
the same level as that reported in the<br />
first half of fiscal 2004.<br />
4
1-2-1<br />
Change in major financial index: Gross assets/Interestbearing<br />
debts<br />
Gross assets and interest-bearing liabilities both decreased, improving<br />
the company balance sheet.<br />
Unit: Billion yen<br />
210.9<br />
205.2<br />
200<br />
169.4 169.1<br />
156.0 155.1<br />
150<br />
136.5<br />
139.0<br />
123.3<br />
115.5<br />
120.3 119.2 118.5<br />
100<br />
114.1<br />
104.0<br />
50<br />
120.6<br />
118.5<br />
79.3<br />
Gross assets<br />
Interest-bearing<br />
debts<br />
Sales amount<br />
127.9<br />
115.9 111.9<br />
66.8<br />
125<br />
59.4<br />
0<br />
1998 1999 2000 2001 2002 2003 2004 1st half of<br />
FY2005<br />
5
1-2-2<br />
Change in major financial index: Equity capital/Earned<br />
surplus<br />
Cumulative loss was totally cleared away in fiscal 2004. Equity<br />
capital increased.<br />
Unit: Billion yen<br />
20<br />
Equity capital<br />
Earned surplus<br />
17.2<br />
13.6<br />
10<br />
0<br />
1.4<br />
10.2<br />
5.2<br />
6.7<br />
2.1<br />
3.3<br />
0.2<br />
2.6<br />
-10<br />
△6.6<br />
△6.9<br />
△6.9<br />
△10.1<br />
△9.2<br />
-20<br />
△15.5<br />
1998 1999 2000 2001 2002 2003 2004 1st half of<br />
FY2005<br />
6
1-3<br />
Change in cash flow (for operation and investment)<br />
An operating cash flow of 9.2 billion yen was secured in the first half<br />
of fiscal 2005.<br />
― Interest-bearing debts decreased by 7.4 billion yen. ―<br />
Unit: Billion yen<br />
15<br />
10<br />
7.5<br />
10.7<br />
11.3<br />
14.0<br />
7.3<br />
9.2<br />
<strong>Operating</strong> CF<br />
Investing CF<br />
Reduced amount in<br />
interest-bearing debts<br />
7.4<br />
5<br />
3.0<br />
2.2<br />
5.6<br />
5.1<br />
2.6<br />
0<br />
-5<br />
Result for the<br />
first half of<br />
fiscal 2003<br />
Result for the<br />
second half of<br />
fiscal 2003<br />
△1.2 △1.0<br />
Result for the<br />
first half of<br />
fiscal 2004<br />
Result for the<br />
second half of<br />
fiscal 2004<br />
△ 1.8<br />
Result for the<br />
first half of<br />
fiscal 2005<br />
7
Part 2<br />
Segment-by-segment business<br />
performance and trend in the business<br />
8
2-1-1<br />
Change in segment-by-segment sales: Comparison with<br />
the first and second halves of fiscal 2004<br />
Profits from industrial machines continued to rise. Profits from other<br />
segments were all down from the levels reported in the first half of fiscal 2004.<br />
Profits in all segments rose from the levels reported in the second half of<br />
2004, however.<br />
Unit: Billion yen<br />
First half of<br />
fiscal 2004<br />
Second half<br />
of fiscal 2004<br />
First half of<br />
fiscal 2005<br />
Comparison with<br />
the first half of<br />
fiscal 2004<br />
Increase/decrease<br />
Comparison with<br />
the second half of<br />
fiscal 2004<br />
Increase/decrease<br />
Industrial sewing<br />
machines<br />
3,076.5 3,157.8 3,354.2 277.7 196.4<br />
SMT system<br />
1,268.6<br />
988.2<br />
1,083.8<br />
△184.8<br />
95.6<br />
Household sewing<br />
machines<br />
682.3<br />
572.2<br />
575.5<br />
△106.8<br />
3.3<br />
Electronic equipment &<br />
computer peripherals<br />
887.5<br />
583.7<br />
711.6<br />
△175.9<br />
127.9<br />
Others<br />
781.1 796.8 654.4 △126.7 △142.4<br />
Total amount of sales<br />
6,696.2 6,098.7 6,379.8 △316.4 281.1<br />
9
2-1-2<br />
Change in segment-by-segment <strong>profit</strong>: Comparison with<br />
the first and second halves of fiscal 2004<br />
Profits from industrial sewing machines rose for the second consecutive<br />
fiscal period. Profits from household sewing machines have continuously<br />
decreased.<br />
Unit: Billion yen<br />
First half of<br />
fiscal 2004<br />
Second half<br />
of fiscal 2004<br />
First half of<br />
fiscal 2005<br />
Comparison with<br />
the first half of<br />
fiscal 2004<br />
Increase/decrease<br />
Comparison with<br />
the second half of<br />
fiscal 2004<br />
Increase/decrease<br />
Industrial sewing<br />
machines<br />
286.6 352.8 497.2 210.6 144.4<br />
SMT system<br />
103.7<br />
5.9<br />
45.2<br />
△58.5<br />
39.3<br />
Household sewing<br />
machines<br />
496<br />
16.9<br />
11.9<br />
△37.7<br />
△5.0<br />
Electronic equipment &<br />
computer peripherals<br />
108.5<br />
64.9<br />
79.4<br />
△29.1<br />
14.5<br />
Others<br />
101.9 37.4 28.7 △73.2 △8.7<br />
(Elimination of <strong>profit</strong>)<br />
△67.5 △16.7 △63.0 4.5 △46.3<br />
Total operating <strong>profit</strong><br />
582.9 461.2 599.5 16.6 138.3<br />
10
2-2-1<br />
Industrial sewing machines business: Change in the<br />
amount of sales and operating <strong>profit</strong><br />
The amount of sales and operating <strong>profit</strong> both increased robustly.<br />
Amount of sales<br />
Unit: Billion yen<br />
40.0<br />
30.0<br />
20.0<br />
10.0<br />
0.0<br />
31.4<br />
7.6%<br />
28.3<br />
12.8%<br />
30.8<br />
9.3%<br />
31.6<br />
11.2%<br />
33.5<br />
14.8%<br />
2.40 3.62 2.87 3.53 4.97<br />
Result for<br />
the first half<br />
of fiscal<br />
2003<br />
Result for<br />
the second<br />
half of fiscal<br />
2003<br />
Result for<br />
the first half<br />
of fiscal<br />
2004<br />
Result for<br />
the second<br />
half of fiscal<br />
2004<br />
Result for<br />
the first half<br />
of fiscal<br />
2005<br />
The operating <strong>profit</strong> ratio improved due to rising sales of<br />
high-value added products.<br />
<strong>Operating</strong> income<br />
Amount of<br />
sales/operating<br />
<strong>profit</strong> ratio<br />
11
2-2-2<br />
Industrial sewing machines business: Change in regionby-region<br />
sales<br />
The amount of sales increased mainly in China and Asia. (The<br />
amount of sales that from the sale of parts, etc.)<br />
Unit: Billion yen<br />
30<br />
20<br />
10<br />
0<br />
24.5<br />
1.4<br />
1.6<br />
5.6<br />
4.8<br />
1.2 1.2<br />
7.2<br />
7.4<br />
9.1 8<br />
Result for<br />
the first half<br />
of fiscal<br />
2003<br />
23.0<br />
Result for<br />
the second<br />
half of fiscal<br />
2003<br />
25.1 26.3<br />
2<br />
2.2<br />
4 4.3<br />
1 1.2<br />
8 8.9<br />
10 9.7<br />
Result for<br />
the first half<br />
of fiscal<br />
2004<br />
Result for<br />
the second<br />
half of fiscal<br />
2004<br />
29.3<br />
2.2<br />
4<br />
1.2<br />
8.8<br />
13.1<br />
Result for<br />
the first half<br />
of fiscal<br />
2005<br />
USA<br />
Europe<br />
Japan<br />
Asia<br />
China<br />
The amount of sales in China substantially increased in the first<br />
half of fiscal 2005 due to the removal of the quota system (January<br />
2005) and surge in demand during the Chinese New Year.<br />
12
2-2-3<br />
Industrial sewing machines business: Major new products<br />
launched in the first half of fiscal 2005<br />
<strong>JUKI</strong> promoted the development of new products as a strategy to<br />
position the company far apart from its competitors.<br />
Apparel field<br />
Knit field<br />
Leather and heavy-weight<br />
materials<br />
AMS‐210E MO‐6700D LU‐2212N7<br />
Sewing machine provided with a<br />
thread trimmer to dramatically<br />
shorten the cycle time from<br />
sewing to thread trimming when<br />
attaching labels, emblems, and<br />
name-labels.<br />
Semi-dry head overlock machine<br />
designed to prevent defects due<br />
to oil stains when sewing knits<br />
such as sportswear and<br />
underwear.<br />
Sewing machine equipped with an<br />
automatic thread trimmer applicable<br />
for the sewing of a broader range of<br />
leather and heavy-weight materials<br />
such as car seats and sofas<br />
13
2-3-1<br />
SMT systems business: Change in the amount of sales<br />
and operating <strong>profit</strong><br />
The amount of sales and operation <strong>profit</strong> both improved, but not to the<br />
levels reported in the first half of fiscal 2004.<br />
Unit: Billion yen<br />
15<br />
10<br />
5<br />
0<br />
-5<br />
7.8<br />
Result for<br />
the first half<br />
of fiscal<br />
2003<br />
12.7<br />
9.8 9.9 10.8<br />
△0.97 △0.15<br />
-12.4%<br />
-1.6%<br />
Result for<br />
the second<br />
half of fiscal<br />
2003<br />
8.2%<br />
1.04<br />
Result for<br />
the first half<br />
of fiscal<br />
2004<br />
0.6%<br />
0.06<br />
Result for<br />
the second<br />
half of fiscal<br />
2004<br />
4.2%<br />
0.45<br />
Result for<br />
the first half<br />
of fiscal<br />
2005<br />
A <strong>profit</strong>able trend was established in the first half of<br />
fiscal 2004 and beyond.<br />
Amount of<br />
sales<br />
<strong>Operating</strong><br />
<strong>profit</strong><br />
Amount of<br />
sales/operating<br />
<strong>profit</strong> ratio<br />
14
2-3-2<br />
SMT systems business: Change in region-by-region sales<br />
The amount of sales recovered to about the 10 billion yen level. Sales<br />
improvements were principally achieved through a leveraging of the<br />
economic upturn in China and Asia.<br />
Unit: Billion yen<br />
12<br />
10<br />
8<br />
6<br />
4<br />
2<br />
7.8<br />
0.8<br />
0.6<br />
0.8<br />
2.2<br />
3.4<br />
9.7<br />
1.2<br />
1.4<br />
0.7 0.9<br />
0.5<br />
1.3<br />
1.5<br />
4<br />
1<br />
2.3<br />
3.1<br />
4.7<br />
12.6<br />
6<br />
9.8<br />
3.5<br />
10.8<br />
0.9<br />
1<br />
1.6<br />
2.8<br />
4.5<br />
USA<br />
Europe<br />
Asia<br />
Japan<br />
China<br />
0<br />
Result for<br />
the first half<br />
of fiscal<br />
2003<br />
Result for<br />
the second<br />
half of fiscal<br />
2003<br />
Result for<br />
the first half<br />
of fiscal<br />
2004<br />
Result for<br />
the second<br />
half of fiscal<br />
2004<br />
Result for<br />
the first half<br />
of fiscal 200<br />
The amount of sales recovered from the level reported in the second<br />
half of fiscal 2004, but not to the level reported in the first half of<br />
fiscal 2004.<br />
15
2-3-3<br />
SMT systems business: New products<br />
General-purpose modular type CX-1<br />
(launched on the market from October)<br />
Semiconductor<br />
manufacturing device<br />
Semiconductor components (bare chips)<br />
Pick & Placer<br />
Surface-mount components<br />
Generalpurpose<br />
modular<br />
type CX-1<br />
[Features of CX-1]<br />
1 [Combined placement is possible.]<br />
A single unit of the modular type CX-1 is<br />
capable of placing semiconductor components<br />
and surface-mount components at the same<br />
time in a normal operating environment.<br />
2 [Improved versatility]<br />
Applicable as a standard pick & placer<br />
when the placement of bare chips is not<br />
required.<br />
16
2-4-1<br />
Household sewing machines business: Change in the<br />
sales and operating <strong>profit</strong><br />
The downward trend in operating <strong>profit</strong> continued.<br />
Unit: Billion yen<br />
10<br />
Amount of<br />
sales<br />
5<br />
0<br />
7.0 6.6 6.8<br />
12.7%<br />
0.89<br />
Result for<br />
the first half<br />
of fiscal<br />
2003<br />
10.6%<br />
0.7<br />
Result for<br />
the second<br />
half of fiscal<br />
2003<br />
7.3%<br />
0.5<br />
Result for<br />
the first half<br />
of fiscal<br />
2004<br />
5.7<br />
5.8<br />
3.0%<br />
2.1%<br />
0.17 0.12<br />
Result for<br />
the second<br />
half of fiscal<br />
2004<br />
Result for<br />
the first half<br />
of fiscal<br />
2005<br />
<strong>Operating</strong><br />
<strong>profit</strong><br />
Amount of<br />
sales/operati<br />
ng <strong>profit</strong> ratio<br />
The amount of sales in the first half of fiscal 2005 rose slightly from<br />
the level reported in the second half of fiscal 2004. <strong>Operating</strong> <strong>profit</strong><br />
continued to decrease, however.<br />
17
2-4-2<br />
Household sewing machines business: Change in regionby-region<br />
sales<br />
Revenue from door-to-door sales hovered at a low level.<br />
Unit: Billion yen<br />
6<br />
4<br />
7.0<br />
0.73<br />
1.02<br />
6.6<br />
6.8<br />
0.87 0.94<br />
0.87 0.97<br />
5.7 5.8<br />
0.77 0.68<br />
0.77 0.84<br />
Export<br />
(overseas)<br />
Sales through<br />
agents (domestic)<br />
2<br />
0<br />
5.17 4.87 4.86<br />
Result for<br />
the first half<br />
of fiscal<br />
2003<br />
Result for<br />
the second<br />
half of fiscal<br />
2003<br />
Result for<br />
the first half<br />
of fiscal<br />
2004<br />
4.12 4.21<br />
Result for<br />
the second<br />
half of fiscal<br />
2004<br />
Result for<br />
the first half<br />
of fiscal<br />
2005<br />
Door-to-door<br />
sales<br />
(domestic)<br />
[Factors responsible for the downturn in door-to-door sales]<br />
* Change in circumstances surrounding door-to-door sales<br />
18
2-5<br />
Electronic equipment and computer peripherals business:<br />
Change in sales and operating <strong>profit</strong><br />
Both figures recovered from the levels reported in the second half of<br />
fiscal 2004, but not to the levels reported in the first half of 2004.<br />
Unit: Billion yen<br />
10.0<br />
5.0<br />
0.0<br />
4.7<br />
11.3%<br />
0.53<br />
Result for<br />
the first half<br />
of fiscal<br />
2003<br />
8.2<br />
15.5%<br />
1.27<br />
Result for<br />
the second<br />
half of fiscal<br />
2003<br />
8.9<br />
5.8<br />
7.1<br />
12.2% 11.1% 11.2%<br />
1.09 0.65 0.8<br />
Result for<br />
the first half<br />
of fiscal<br />
2004<br />
Result for<br />
the second<br />
half of fiscal<br />
2004<br />
Result for<br />
the first half<br />
of fiscal<br />
2005<br />
Amount of<br />
sales<br />
<strong>Operating</strong><br />
<strong>profit</strong><br />
Amount of<br />
sales/operati<br />
ng <strong>profit</strong> ratio<br />
The amount of sales surged in the second half of fiscal 2003 and the<br />
first half of fiscal 2004 due to a special procurement demand.<br />
Income and <strong>profit</strong> both decreased in the second half of fiscal 2004<br />
but rose again in the first half of fiscal 2005.<br />
19
2-6<br />
Other lines of business<br />
Changes in the amount of sales and operating <strong>profit</strong><br />
Both the amount of sales and operating <strong>profit</strong> decreased due a<br />
decline in the special procurement demand and other causes.<br />
Unit: Billion yen<br />
10.0<br />
5.0<br />
0.0<br />
8.1<br />
4.0%<br />
0.32<br />
Result for<br />
the first half<br />
of fiscal<br />
2003<br />
8.9<br />
8.2%<br />
0.73<br />
Result for<br />
the second<br />
half of fiscal<br />
2003<br />
7.8<br />
13.0%<br />
1.02<br />
Result for<br />
the first half<br />
of fiscal<br />
2004<br />
8.0<br />
4.7%<br />
0.37<br />
Result for<br />
the second<br />
half of fiscal<br />
2004<br />
6.5<br />
4.4%<br />
0.29<br />
Result for<br />
the first half<br />
of fiscal<br />
2005<br />
Amount of<br />
sales<br />
<strong>Operating</strong><br />
<strong>profit</strong><br />
Amount of<br />
sales/operati<br />
ng <strong>profit</strong> ratio<br />
20
Part 3<br />
Business performance forecast throughout<br />
the fiscal period (2005) ending March 2006<br />
21
3-1<br />
Business performance forecast throughout the fiscal period (2005)<br />
ending March 2006: Comparison with the previous fiscal year<br />
Revised values for 8/4 are maintained.<br />
Unit: Billion yen<br />
Result for fiscal<br />
2004<br />
8/4 forecast<br />
Forecast<br />
throughout<br />
fiscal 2005<br />
Increase/decrease<br />
in comparison with<br />
the result for the<br />
previous year<br />
Amount of sales<br />
12,794.9 12,500 12,500<br />
△294.9<br />
<strong>Operating</strong> <strong>profit</strong><br />
1,044.1<br />
1,100<br />
1,100<br />
55.9<br />
Ordinary <strong>profit</strong><br />
864.6<br />
900<br />
900<br />
35.4<br />
Current net <strong>profit</strong><br />
552.3<br />
4600<br />
460<br />
△92.3<br />
* The dividend will be JPY6, an increase from the JPY2 dividend paid out the year before.<br />
22
3-2-1<br />
Segment-by-segment business performance forecast:<br />
Year-on-year comparison of sales<br />
The amount of sales of industrial sewing machines is expected to<br />
increase. For the other segments, however, sales are expected to<br />
decrease.<br />
Result for fiscal<br />
2004<br />
Forecast<br />
throughout fiscal<br />
2005<br />
Unit: Billion yen<br />
Increase/decrease in<br />
comparison with the result<br />
for the previous year<br />
Industrial sewing<br />
machines<br />
6,234.3 6,500<br />
265.7<br />
SMT system<br />
2,256.8<br />
2,150<br />
△106.8<br />
Household sewing<br />
machines<br />
1,254.5<br />
1,150<br />
△104.5<br />
Electronic equipment &<br />
computer peripherals<br />
1,471.2<br />
1,400<br />
△71.2<br />
Others<br />
Total amount of sales<br />
1,577.9 1,300 △277.9<br />
12,794.9 12,500 △294.7<br />
23
3-2-2<br />
Segment-by-segment business performance forecast:<br />
Year-on-year comparison of the operating <strong>profit</strong><br />
The rise in the operating <strong>profit</strong> achieved by industrial sewing<br />
machines is expected to cover the total decrease suffered by the<br />
other segments.<br />
Result for fiscal<br />
2004<br />
Forecast<br />
throughout fiscal<br />
2005<br />
Unit: Billion yen<br />
Increase/decrease in<br />
comparison with the result<br />
for the previous year<br />
Industrial sewing<br />
machines<br />
639.4 850<br />
210.6<br />
SMT system<br />
1,09.6<br />
100<br />
△9.6<br />
Household sewing<br />
machines<br />
66.5<br />
20<br />
△46.5<br />
Electronic equipment &<br />
computer peripherals<br />
173.4<br />
150<br />
△23.4<br />
Others*<br />
Total operating <strong>profit</strong><br />
55.1 △20 △75.1<br />
1,044.1 1,100 56.0<br />
* Elimination of <strong>profit</strong>s are included.<br />
24
The prospective future results described in this document are only forecasts<br />
determined based on the currently available information. Potential risks and<br />
uncertain factors are not included in the forecast. Accordingly, please take a<br />
note that the actual results in the future may differ from the results herein<br />
forecasted.<br />
Juki Corporation<br />
Corporate Planning Department<br />
Telephone: 81-3-3480-1742<br />
Telefacsimile: 81-3-3480-9734<br />
URL: http://www.juki.co.jp/<br />
25