Two-year clinical outcome after implantation of sirolimus-eluting and ...
Two-year clinical outcome after implantation of sirolimus-eluting and ...
Two-year clinical outcome after implantation of sirolimus-eluting and ...

Create successful ePaper yourself
Turn your PDF publications into a flip-book with our unique Google optimized e-Paper software.
<strong>Two</strong>-<strong>year</strong> <strong>clinical</strong> <strong>outcome</strong> <strong>after</strong> <strong>implantation</strong> <strong>of</strong> SES <strong>and</strong> PES 721<br />
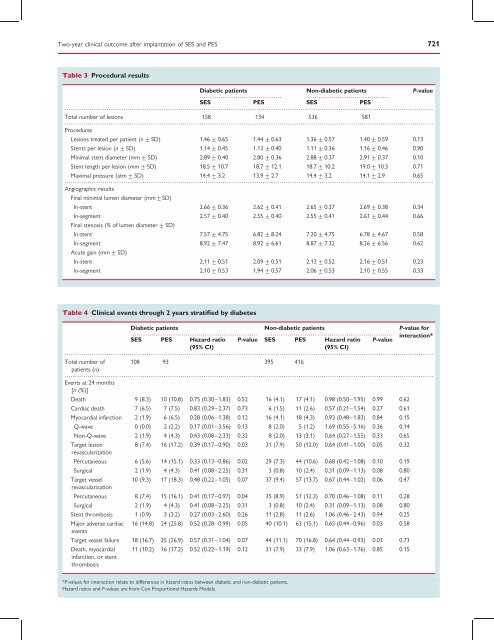
Table 3 Procedural results<br />
Diabetic patients<br />
.......................................<br />
Non-diabetic patients<br />
.......................................<br />
P-value<br />
SES PES SES PES<br />
...............................................................................................................................................................................<br />
Total number <strong>of</strong> lesions 158 134 536 581<br />
...............................................................................................................................................................................<br />
Procedures<br />
Lesions treated per patient (n + SD) 1.46 + 0.65 1.44 + 0.63 1.36 + 0.57 1.40 + 0.59 0.13<br />
Stents per lesion (n + SD) 1.14 + 0.45 1.13 + 0.40 1.11 + 0.36 1.16 + 0.46 0.90<br />
Minimal stent diameter (mm + SD) 2.89 + 0.40 2.80 + 0.36 2.88 + 0.37 2.91 + 0.37 0.10<br />
Stent length per lesion (mm + SD) 18.5 + 10.7 18.7 + 12.1 18.7 + 10.2 19.0 + 10.3 0.71<br />
Maximal pressure (atm + SD) 14.4 + 3.2 13.9 + 2.7 14.4 + 3.2 14.1 + 2.9 0.65<br />
...............................................................................................................................................................................<br />
Angiographic results<br />
Final minimal lumen diameter (mm+SD)<br />
In-stent 2.66 + 0.36 2.62 + 0.41 2.65 + 0.37 2.69 + 0.38 0.34<br />
In-segment 2.57 + 0.40 2.55 + 0.40 2.55 + 0.41 2.61 + 0.44 0.66<br />
Final stenosis (% <strong>of</strong> lumen diameter + SD)<br />
In-stent 7.57 + 4.75 6.82 + 8.24 7.20 + 4.75 6.78 + 4.67 0.58<br />
In-segment 8.92 + 7.47 8.92 + 6.61 8.87 + 7.32 8.26 + 6.56 0.62<br />
Acute gain (mm + SD)<br />
In-stent 2.11 + 0.51 2.09 + 0.51 2.13 + 0.52 2.16 + 0.51 0.23<br />
In-segment 2.10 + 0.53 1.94 + 0.57 2.06 + 0.53 2.10 + 0.55 0.33<br />
Table 4 Clinical events through 2 <strong>year</strong>s stratified by diabetes<br />
Diabetic patients Non-diabetic patients P-value for<br />
............................................................ ............................................................. interaction*<br />
SES PES Hazard ratio P-value SES PES Hazard ratio P-value<br />
(95% CI)<br />
(95% CI)<br />
...............................................................................................................................................................................<br />
Total number <strong>of</strong> 108 93 395 416<br />
patients (n)<br />
...............................................................................................................................................................................<br />
Events at 24 months<br />
[n (%)]<br />
Death 9 (8.3) 10 (10.8) 0.75 (0.30–1.83) 0.52 16 (4.1) 17 (4.1) 0.98 (0.50–1.95) 0.99 0.62<br />
Cardiac death 7 (6.5) 7 (7.5) 0.83 (0.29–2.37) 0.73 6 (1.5) 11 (2.6) 0.57 (0.21–1.54) 0.27 0.61<br />
Myocardial infarction 2 (1.9) 6 (6.5) 0.28 (0.06–1.38) 0.12 16 (4.1) 18 (4.3) 0.93 (0.48–1.83) 0.84 0.15<br />
Q-wave 0 (0.0) 2 (2.2) 0.17 (0.01–3.56) 0.13 8 (2.0) 5 (1.2) 1.69 (0.55–5.16) 0.36 0.14<br />
Non-Q-wave 2 (1.9) 4 (4.3) 0.43 (0.08–2.33) 0.32 8 (2.0) 13 (3.1) 0.64 (0.27–1.55) 0.33 0.65<br />
Target lesion<br />
8 (7.4) 16 (17.2) 0.39 (0.17–0.90) 0.03 31 (7.9) 50 (12.0) 0.64 (0.41–1.00) 0.05 0.32<br />
revascularization<br />
Percutaneous 6 (5.6) 14 (15.1) 0.33 (0.13–0.86) 0.02 29 (7.3) 44 (10.6) 0.68 (0.42–1.08) 0.10 0.19<br />
Surgical 2 (1.9) 4 (4.3) 0.41 (0.08–2.25) 0.31 3 (0.8) 10 (2.4) 0.31 (0.09–1.13) 0.08 0.80<br />
Target vessel 10 (9.3) 17 (18.3) 0.48 (0.22–1.05) 0.07 37 (9.4) 57 (13.7) 0.67 (0.44–1.02) 0.06 0.47<br />
revascularization<br />
Percutaneous 8 (7.4) 15 (16.1) 0.41 (0.17–0.97) 0.04 35 (8.9) 51 (12.3) 0.70 (0.46–1.08) 0.11 0.28<br />
Surgical 2 (1.9) 4 (4.3) 0.41 (0.08–2.25) 0.31 3 (0.8) 10 (2.4) 0.31 (0.09–1.13) 0.08 0.80<br />
Stent thrombosis 1 (0.9) 3 (3.2) 0.27 (0.03–2.60) 0.26 11 (2.8) 11 (2.6) 1.06 (0.46–2.43) 0.94 0.25<br />
Major adverse cardiac 16 (14.8) 24 (25.8) 0.52 (0.28–0.99) 0.05 40 (10.1) 63 (15.1) 0.65 (0.44–0.96) 0.03 0.58<br />
events<br />
Target vessel failure 18 (16.7) 25 (26.9) 0.57 (0.31–1.04) 0.07 44 (11.1) 70 (16.8) 0.64 (0.44–0.93) 0.03 0.73<br />
Death, myocardial 11 (10.2) 16 (17.2) 0.52 (0.22–1.19) 0.12 31 (7.9) 33 (7.9) 1.06 (0.63–1.76) 0.85 0.15<br />
infarction, or stent<br />
thrombosis<br />
*P-values for interaction relate to differences in hazard ratios between diabetic <strong>and</strong> non-diabetic patients.<br />
Hazard ratios <strong>and</strong> P-values are from Cox Proportional Hazards Models.