February 13
February 13
February 13

You also want an ePaper? Increase the reach of your titles
YUMPU automatically turns print PDFs into web optimized ePapers that Google loves.
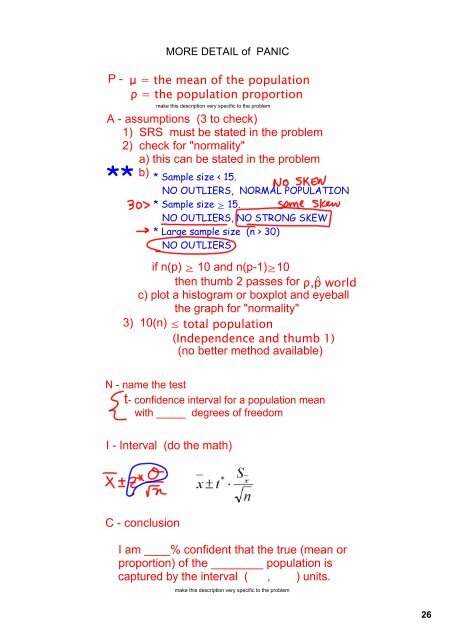
MORE DETAIL of PANIC<br />
P μ = the mean of the population<br />
ρ = the population proportion<br />
make this description very specific to the problem<br />
A assumptions (3 to check)<br />
1) SRS must be stated in the problem<br />
2) check for "normality"<br />
a) this can be stated in the problem<br />
b)<br />
**<br />
* Sample size < 15.<br />
NO OUTLIERS, NORMAL POPULATION<br />
* Sample size ≥ 15.<br />
NO OUTLIERS, NO STRONG SKEW<br />
* Large sample size (n > 30)<br />
NO OUTLIERS<br />
if n(p) ≥ 10 and n(p1)≥10<br />
∧<br />
then thumb 2 passes for ρ,p world<br />
c) plot a histogram or boxplot and eyeball<br />
the graph for "normality"<br />
3) 10(n) ≤ total population<br />
(Independence and thumb 1)<br />
(no better method available)<br />
N name the test<br />
t confidence interval for a population mean<br />
with _____ degrees of freedom<br />
I Interval (do the math)<br />
C conclusion<br />
I am ____% confident that the true (mean or<br />
proportion) of the ________ population is<br />
captured by the interval ( , ) units.<br />
make this description very specific to the problem<br />
26