1 CLASS LECTURE NOTES - What is Applied Statistics ...
1 CLASS LECTURE NOTES - What is Applied Statistics ...
1 CLASS LECTURE NOTES - What is Applied Statistics ...

You also want an ePaper? Increase the reach of your titles
YUMPU automatically turns print PDFs into web optimized ePapers that Google loves.
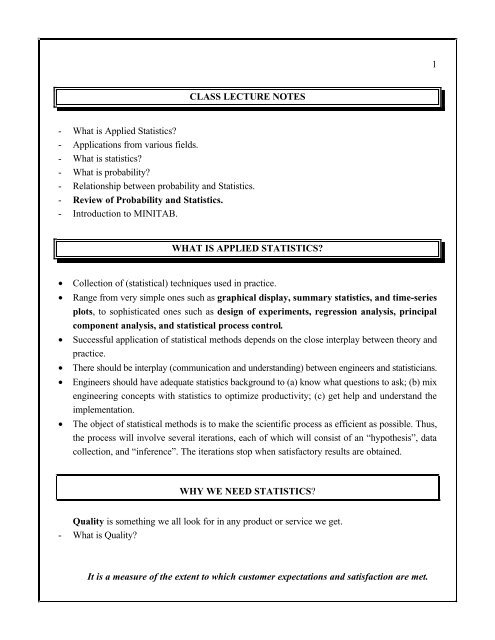
1<br />
<strong>CLASS</strong> <strong>LECTURE</strong> <strong>NOTES</strong><br />
- <strong>What</strong> <strong>is</strong> <strong>Applied</strong> Stat<strong>is</strong>tics?<br />
- Applications from various fields.<br />
- <strong>What</strong> <strong>is</strong> stat<strong>is</strong>tics?<br />
- <strong>What</strong> <strong>is</strong> probability?<br />
- Relationship between probability and Stat<strong>is</strong>tics.<br />
- Review of Probability and Stat<strong>is</strong>tics.<br />
- Introduction to MINITAB.<br />
WHAT IS APPLIED STATISTICS?<br />
• Collection of (stat<strong>is</strong>tical) techniques used in practice.<br />
• Range from very simple ones such as graphical d<strong>is</strong>play, summary stat<strong>is</strong>tics, and time-series<br />
plots, to soph<strong>is</strong>ticated ones such as design of experiments, regression analys<strong>is</strong>, principal<br />
component analys<strong>is</strong>, and stat<strong>is</strong>tical process control.<br />
• Successful application of stat<strong>is</strong>tical methods depends on the close interplay between theory and<br />
practice.<br />
• There should be interplay (communication and understanding) between engineers and stat<strong>is</strong>ticians.<br />
• Engineers should have adequate stat<strong>is</strong>tics background to (a) know what questions to ask; (b) mix<br />
engineering concepts with stat<strong>is</strong>tics to optimize productivity; (c) get help and understand the<br />
implementation.<br />
• The object of stat<strong>is</strong>tical methods <strong>is</strong> to make the scientific process as efficient as possible. Thus,<br />
the process will involve several iterations, each of which will cons<strong>is</strong>t of an “hypothes<strong>is</strong>”, data<br />
collection, and “inference”. The iterations stop when sat<strong>is</strong>factory results are obtained.<br />
WHY WE NEED STATISTICS?<br />
Quality <strong>is</strong> something we all look for in any product or service we get.<br />
- <strong>What</strong> <strong>is</strong> Quality?<br />
It <strong>is</strong> a measure of the extent to which customer expectations and sat<strong>is</strong>faction are met.
2<br />
- It <strong>is</strong> not static and changes with time.<br />
- Continuous quality improvement program <strong>is</strong> a MUST to stay competitive in these days.<br />
- Final quality and cost of a product are pretty much dependent on the (engineering) designs and<br />
the manufacture of the products.<br />
- Variability <strong>is</strong> present in machines, materials, methods, people, environment, and measurements.<br />
- Manufacturing a product or providing a service involves at least one of the above 6 items (may<br />
be some other items in addition to these)<br />
- Need to understand the variability.<br />
- Stat<strong>is</strong>tically designed experiments are used to find the optimum settings that improve the quality.<br />
- In every activity, we see people use (or abuse?) stat<strong>is</strong>tics to express sat<strong>is</strong>faction (or<br />
d<strong>is</strong>sat<strong>is</strong>faction) towards a product.<br />
- There <strong>is</strong> no such a thing as good stat<strong>is</strong>tics or bad stat<strong>is</strong>tics.<br />
- It <strong>is</strong> the people who report the stat<strong>is</strong>tics manipulate the numbers to their advantage.<br />
- Stat<strong>is</strong>tics properly used will be more productive.<br />
EXPLORE, ESTIMATE and CONFIRM<br />
Stat<strong>is</strong>tical experiments are carried out to<br />
EXPLORE: gather data to study more about the process or the product.<br />
ESTIMATE: use the data to estimate various effects.<br />
CONFIRM: gather additional data to verify the hypotheses.<br />
EXAMPLE 1 ( EEC )<br />
Bonding Example: An engineer working for a chemical company has the following diary of activities<br />
with regard to a “new bonding method” that <strong>is</strong> under consideration by the company.<br />
Hypothes<strong>is</strong> 1: A new bonding method to bond two films <strong>is</strong> expected to yield a higher bonding<br />
strength compared to the current method.<br />
In order to verify the hypothes<strong>is</strong>, I started by gathering a l<strong>is</strong>t of key variables in consultation<br />
with the group involved in the project. The key variables identified are: bonding glue, temperature,<br />
density and thickness of the films, and pressure setting. I ran the following experiment first.<br />
Experiment 1: Two films were bonded together by choosing bonding glue type A, temperature level
to be 300 o C, the thickness of the two films to be 4 mils, and a pressure setting to be 200 psi.<br />
Data 1: The bonding strength measured was lower than the current method.<br />
3<br />
Question 1: Why <strong>is</strong> data 1 not supportive of the hypothes<strong>is</strong> 1?<br />
After thinking over th<strong>is</strong> experiment I arrived at the following conclusion.<br />
Induction 1: The temperature setting may be low causing the glue to perform at below optimum level.<br />
Experiment 2: Three sets of two films were bonded together by choosing bonding glue type A, the<br />
thickness of the two films to be 4 mils, and a pressure setting to be 200 psi. The temperature settings<br />
for these three sets were taken to be 400 o C, 450 o C and 500 o C, respectively.<br />
Data 2: The bonding strengths for the three specimens were as follows:<br />
At 400 o C the strength was still lower than the current one;<br />
At 450 o C the strength was higher than the current one;<br />
At 500 o C the strength was lower than the current one;<br />
Induction 2: The temperature setting at 450 o C seems to give a better bonding strength when all other<br />
variables are set at the above mentioned levels.<br />
The above investigation in various steps illustrates the basic ideas in a stat<strong>is</strong>tical experiment<br />
conducted in a scientific way. The remaining series of steps, with possible modifications including<br />
varying the settings of the variables simultaneously, form the bas<strong>is</strong> of an experimental design. Th<strong>is</strong><br />
will be seen in great detail later.<br />
The basic ideas of th<strong>is</strong> experiment can be summarized as follows.<br />
- Constraint: the films should not peel off under “normal” usage.<br />
- Key variables: bonding glue, temperature, density and thickness of the films, and pressure<br />
setting.<br />
- Goal: the effectiveness of such bonding method.<br />
- Procedure: All possible configurations in actual production setup should be considered in the<br />
study.<br />
EXPLORE: Bond specimens of films at several settings and measure the bonding strength.<br />
ESTIMATION: Suppose our study shows that the bonding strength <strong>is</strong> affected by glue, temperature
and setting, then we would like to estimate the strength.<br />
4<br />
CONFIRMATION: Once we find the optimal settings, we run additional experiments to verify that<br />
the settings are in fact “best”.<br />
Recommendation: If the study <strong>is</strong> done scientifically, then we may have one of the following:<br />
(a) Continue with the production.<br />
(b) Not to use the method.<br />
(c) Suggest appropriate modification in the process.<br />
However, if it <strong>is</strong> not scientifically done, the conclusion may be totally false.<br />
APPLICATIONS<br />
• Stat<strong>is</strong>tical methods have applications in many areas: industrial, medical, behavioral, sociological<br />
and economic.<br />
• General principles and strategies to be adopted in these areas will all be the same. However,<br />
certain problems can call for some special techniques.<br />
Some detailed engineering applications are given below. You may want to add more to these as<br />
we go along.
5<br />
ENGINEERING APPLICATIONS EXAMPLES<br />
The following are examples taken mainly from past students= class projects. Additional ones<br />
are taken from publ<strong>is</strong>hed sources, such as journals, magazines, and technical reports.<br />
1. The cradle mount system, cons<strong>is</strong>ting of both rubber and metal assemblies, <strong>is</strong> used in automobiles<br />
to reduce the vibration and no<strong>is</strong>e from the engine and from the ride. Th<strong>is</strong> will improve the ride<br />
character<strong>is</strong>tics of the automobile. In one study, the objective was to find an optimum configuration<br />
for the three variables: neck type, rate ring and material, that will give the best vertical dynamic rate.<br />
In th<strong>is</strong> study these three variables were used at 2 levels each. The stat<strong>is</strong>tical tools used here are:<br />
Design of experiments and regression analys<strong>is</strong>. The student was able to collect the data and came up<br />
with a recommendation for the best design. In another study involving the cradle mount system, the<br />
student=s objective was to minimize the damping of a rubber component. Two factors: temperature<br />
and the time were considered at three levels. Using 3 2 factorial design, the student recommended an<br />
optimum setting for the temperature and the time.<br />
2. Th<strong>is</strong> project involves the peening process, where in the operation involves moving aluminum<br />
material around a stainless steel ball. The ball <strong>is</strong> used to plug entrance holes where drilling operations<br />
are required. The objective of the study <strong>is</strong> to establ<strong>is</strong>h a planned replacement for the peen tools and<br />
to increase tool life and thus to increase machine uptime. Before the project was undertaken, there<br />
was no establ<strong>is</strong>hed tool life for the process and only v<strong>is</strong>ual inspection of the part was used to<br />
determine when a tool needs to be changed. He chose a set of four balls and used initial data to come<br />
up with some interesting observations. He indicates that th<strong>is</strong> will be a starting point for further<br />
analys<strong>is</strong> involving other locations as well as using some additional factors in the study.<br />
3. Paint process <strong>is</strong> a costly and a very involved one. Air spray pain guns and electrostatic rotary<br />
atomizers (referred to as bells) are two of the many ways to paint an automobile. Air spray guns use<br />
high air pressure to atomize and direct the flow of paint, and thus leads to a lot of wastage of the<br />
paint. In th<strong>is</strong> project, a student was involved in finding optimal initial process parameters to achieve<br />
a target paint film thickness using “bells”. The process parameters chosen for the study were: d<strong>is</strong>tance<br />
from bell to body, linear speed of the robot and bell, rotational speed of the turbine, paint flow rate,<br />
and shaping air pressure. Using design of experiments and regression analys<strong>is</strong>, the student identified<br />
optimal factor settings that resulted in film builds that were extremely close to the target value.
6<br />
4. As <strong>is</strong> known Sulfur dioxide (SO 2 ) <strong>is</strong> one of the contributors to the “greenhouse effects”. EPA <strong>is</strong><br />
very strict about the amount of SO 2 released from the manufactruing processes. Many assembly plants<br />
and other component facilities produce the much needed steam through gas, oil or coal fired boilers.<br />
As <strong>is</strong> known, when burning coal, on average 98 % of the sulfur present in coal will be emitted as SO 2 .<br />
The amount of SO 2 emitted <strong>is</strong> dependent only on the percentage of the sulfur in the coal, and not on<br />
the boiler size, the firing configuration, or the operation of the boiler. In th<strong>is</strong> project, the student was<br />
interested in the amount of sulfur and the energy content of the coal supplied to her company. There<br />
were two coal suppliers to her company, one of which <strong>is</strong> believed to supply a better quality. She was<br />
interested in testing th<strong>is</strong> claim as well as to determine whether one supplier has superior em<strong>is</strong>sion<br />
character<strong>is</strong>tics over the other, and if so, which parameter can be attributed to th<strong>is</strong> phenomenon. Using<br />
stat<strong>is</strong>tical analys<strong>is</strong> (including 2-sample tests) the student came up with a number of interesting<br />
conclusions.<br />
5. Th<strong>is</strong> project deals with evaluation of a prototype mechan<strong>is</strong>m for fuel economy improvement. That<br />
<strong>is</strong>, a particular device, which <strong>is</strong> claimed to improve fuel economy by converting engine pumping loss<br />
into electrical output to supplant the engine driven alternator, and thereby reducing fuel consumption,<br />
was under study. The objective of th<strong>is</strong> project was to determine whether the vehicle test data that<br />
were previously collected supports the need for the device. Using stat<strong>is</strong>tical tools (tests of hypotheses,<br />
regression analys<strong>is</strong>) the student concluded that the device does have an impact on the engine<br />
performance for combustion and em<strong>is</strong>sions; and also the device could increase MPG.<br />
6. Th<strong>is</strong> project deals with tube size variation study. Tube sizing <strong>is</strong> a process in which the diameter <strong>is</strong><br />
changed for a given piece of tubing. Th<strong>is</strong> feature <strong>is</strong> critical in exhaust system applications. Tubes that<br />
are too large may not fit into mating tubes and thus prevent assembly. On the other hand, tubes that<br />
are too small will fit, but may not seal exhaust gases. Thus, it <strong>is</strong> very important to study the variation<br />
in the tube sizing process. After a brain storming session, the student identified 5 key variables (all<br />
at two levels) that might explain the variability and also help to find the best configuration setting.<br />
Using design of experiments, the student summarized h<strong>is</strong> findings and recommendations for future<br />
work.<br />
7. Th<strong>is</strong> deals with the problem of part thickness. A flat metallic part (which comes in varying<br />
thickness) <strong>is</strong> pressed to a specified thickness. Since parts were coming with various thickness initially,<br />
it <strong>is</strong> important to adjust the pressing mechan<strong>is</strong>m to get the final product to be of the same thickness.<br />
The student used a linear regression model to predict the relationship between change in part<br />
thickness and the pressure applied.
7<br />
8. Spark plug insulators are extremely abrasive and hence results in tool wear out prematurely. In th<strong>is</strong><br />
project, the student was interested in determining whether one or two different coatings will help<br />
extend the life of the nests that hold the parts. Using one machine and testing 3types of nests, it was<br />
determined that these three types do not significantly extend the life and it was recommended to test<br />
using different materials and coatings.<br />
9. Th<strong>is</strong> project deals with window regulator pivot joint=s effect on the sash angle. The angle of the<br />
glass sash in the full up position <strong>is</strong> an important parameter and indicates how well the glass <strong>is</strong> sealing<br />
in the header. Th<strong>is</strong> <strong>is</strong> important as any leak will lead to structural problem. The student first developed<br />
a regression model of the current pivot design and then developed a similar one for an alternate pivot<br />
design. He concluded that the alternate design could control the variance better than the current one,<br />
but requires additional testing in view of an increase in the alternate design=s diameter.<br />
10. In order to compare the system throughput before and after the initiation of process improvement<br />
efforts within the body shop of a leading automobile company, th<strong>is</strong> student used standard stat<strong>is</strong>tical<br />
methodology to conclude that the process improvement team continue the efforts and also monitor<br />
the throughput to establ<strong>is</strong>h certain factors, such as cycle time and machine downtime.<br />
11. Over the last few years the use of heated exhaust oxygen sensors has grown due to the em<strong>is</strong>sions<br />
related benefits. With the increasing emphas<strong>is</strong> on quality improvements and process/product variation<br />
reduction, it has become very essential to look at and analyze process control data to ensure that key<br />
product character<strong>is</strong>tics are being met cons<strong>is</strong>tently, and the process performance <strong>is</strong> meeting or<br />
exceeding requirements. In th<strong>is</strong> project, the student uses the data on ceramic heater res<strong>is</strong>tance, which<br />
was compiled for a three-month time period, to make a number of useful recommendations and<br />
conclusions.<br />
12. Testing electronic components to assure the res<strong>is</strong>tive and capacitive values are correct for the<br />
components requires stat<strong>is</strong>tical analys<strong>is</strong>. In th<strong>is</strong> project, the student was interested to see whether or<br />
not the test values obtained are cons<strong>is</strong>tent from tester to tester as well as from fixture to fixture within<br />
the testers. Using Analys<strong>is</strong> of variance techniques, some interesting conclusions and recommendations<br />
are drawn here.<br />
13. In th<strong>is</strong> project, the student=s interest was to verify whether the product HVM (heating and<br />
ventilating module) for cars, <strong>is</strong> of high quality and free from defects. He used basic stat<strong>is</strong>tical methods<br />
as well as h<strong>is</strong> own program to analyze the data and make useful recommendations.<br />
14. Color <strong>is</strong> one of the main ingredients in marketing strategy. We see these in food items, medicine,
8<br />
containers, packing materials, and so on. Consumers are attracted to color products more than plain<br />
ones. The product may not be good, but the presentation of the product may have more influence in<br />
people acquiring the product. One of the major problems in coloring products <strong>is</strong> environmental in<br />
nature. For example, in plastic industries heavy-metal pigment approach for coloring has been very<br />
popular until 1980's, when environmentally safer coloration began to emerge. One such method <strong>is</strong><br />
using mixed-metal oxides (MMO's), which <strong>is</strong> quite efficient and more expensive than the traditional<br />
method. However, due to federal and state regulations, MMO's are being used. Stat<strong>is</strong>tics (DOE) <strong>is</strong><br />
used to determine the optimal composition of MMO's.<br />
15. Composite materials are used as pressure release systems in many devices. In order to improve<br />
the reliability assessment of these materials, stat<strong>is</strong>tics (regression analys<strong>is</strong>) <strong>is</strong> used.<br />
16. Any company that produces a product invests time and money to study the product's reliability.<br />
That <strong>is</strong>, the company <strong>is</strong> interested to (a) know (predict) the lifetime of the product, (b) find how long<br />
a warranty, if any, should be given to the product, (c) calculate the probability that the product will<br />
function without any problem during the warranty period, (d) identify the causes of different types<br />
of failures of the product, (e) study alternative method, if any needed, that might improve the product,<br />
and so on. Problems of th<strong>is</strong> nature fall under the general theme of "reliability data analys<strong>is</strong>" or "life<br />
time data analys<strong>is</strong>". Analyzing the reliability data <strong>is</strong> one of the major functioning components of the<br />
engineering and management department of the R&D of any company. Much of the analys<strong>is</strong> requires<br />
knowledge from probability and stat<strong>is</strong>tics.<br />
17. Steel containers are used in transporting many goods including oil and nuclear power plant waste.<br />
Hence, it <strong>is</strong> very important to develop acceptance res<strong>is</strong>tance criterion for the containers to brittle<br />
failures. The main variables of interest are the crack size and the stress intensity. Since these are<br />
random variables, the study of these requires probability theory and stat<strong>is</strong>tics.<br />
18. Vinyls are used as siding in the houses to protect the brick walls (or dry walls). Since colored<br />
PVC can reach temperatures high enough to cause early failure of the vinyl siding. Hence, it <strong>is</strong><br />
imperative to know the maximum temperature that a piece of pigmented PVC can reach when<br />
exposed to sunlight. Stat<strong>is</strong>tics (regression analys<strong>is</strong>) <strong>is</strong> used to predict the heat buildup of pigmented<br />
PVC as a function of the amount of sunlight absorbed by the PVC panels.<br />
19. PCR resin <strong>is</strong> used in the manufacture of trash bags/liners. From environmental point of view it <strong>is</strong><br />
very important the bags/liners have very high recyclable contents. Th<strong>is</strong> requires the study of the
9<br />
physical properties of the bags/liners that have different grade of polyethylene films and different<br />
resins. Again, DOE <strong>is</strong> used to determine the maximum performance character<strong>is</strong>tics.<br />
20. Thin films are used in many diverse fields such as food packaging industries, housing industries,<br />
paper industries, and medicine. The film obtained from the blown film <strong>is</strong> known to be influenced by<br />
many variables. For example, in the polymer the variables are MW, MWD, density and branching; in<br />
the equipment, the die size, the die gap, the air ring, IBC, and IRIS are some of the variables; the<br />
output, melting temperature, and frost line height will be the variables in the process. The DOE <strong>is</strong><br />
used to determine the effects of fabrication variables: the blown-up ratio (bubble radius/die radius),<br />
the specific output rate, the melting temperature, and the frost line height.<br />
21. Cycle time (time between the completion of the last product and the completion of the next<br />
product) <strong>is</strong> an important quantity in the manufacturing processes. Depending on the product and the<br />
layout of the manufacturing area (some products such as a car and a semiconductor chip may require<br />
many different processing steps before rolling out as a final product)the cycle time, in reality, <strong>is</strong> a<br />
difficult one to quantify. The manufacturing company would like to estimate th<strong>is</strong> variable as<br />
accurately as possible, to figure out the cost, <strong>is</strong>olate any problem, identify source, if any, of variability<br />
and so on. Probability and stat<strong>is</strong>tics are the essential tools for such study.<br />
22. Package delivery companies are interested in scheduling the delivery trucks and the drivers to pick<br />
up and deliver packages. The companies have several hubs (central processing places) where the<br />
packages are sorted. One of the important factors in efficient delivery of packages <strong>is</strong> to estimate the<br />
number of drivers needed in each of the hubs for each of the working days as well as the season of<br />
the year. Regressions analys<strong>is</strong> and time-series analys<strong>is</strong> are used in developing stat<strong>is</strong>tical models for<br />
predicting the number of drivers as well as the number of packages. Also from the past data, ANOVA<br />
techniques are used to allocate the resources among the various div<strong>is</strong>ions in each hub.<br />
23. Devices such as the pillars supporting the platform of an offshore drilling unit, the pillars of a<br />
bridge, electronic items mounted on outboard the ship, and others, are exposed to several hazards<br />
in a marine environment. These hazards in the form of chemical, electrical, thermal, or mechanical<br />
stresses lead to degradation and eventual failure of the device. Maintenance and replacement of such<br />
devices are time-consuming and expensive. Hence, it <strong>is</strong> imperative to estimate the reliability of such<br />
devices as functions of time.<br />
24. In order to determine whether there <strong>is</strong> any stat<strong>is</strong>tical difference between metal and ceramic
10<br />
substrates on the em<strong>is</strong>sion performance of automotive exhaust systems, a design of experiment was<br />
conducted. A fractional factorial design (2 5-1 design) was used to conclude that metal substrate may<br />
only be marginally better than ceramic substrate.<br />
25. The assembly of a blower motor into a fan coil blower requires that a band be assembled around<br />
the motor, which captures and pins the assembly legs against the motor. The band <strong>is</strong> fastened using<br />
a bolt and nut through the ears of the band. It <strong>is</strong> noted that if the bold and nut assembly <strong>is</strong> over<br />
torqued, the band, which <strong>is</strong> fabricated from sheet metal, fractures in the bend forming the ears. Th<strong>is</strong><br />
leads to eventual band failure resulting in more damage to the blower, its housing and the evaporator<br />
coil. Hence, a design of experiment was conducted to identify the optimum settings for nut material,<br />
bolt material, lubricant/no lubricant, and, nut and bolt size.<br />
26. Rubber weather strips are used on automobiles to seal out water, dust, and vehicle and road no<strong>is</strong>e.<br />
The seal around a vehicle door are some of the most important ones as the weather strips are easily<br />
noticeable by the occupants’ of the vehicle. During the introduction of a new model car, an<br />
unacceptable no<strong>is</strong>e level was noticed and a team was assembled to resolve th<strong>is</strong> problem. The team<br />
identified four key variables (automotive coating type, thickness, degree of cure, and weather strip<br />
(rubber) type. Using a 2 4 design, optimum settings were identified and the production process used<br />
these settings to reduce the no<strong>is</strong>e level.<br />
27. An engineer in a small production process within the manufacturing plant was interested in<br />
comparing two 10.5-hour shifts with respect to the production output. These two shifts meet the<br />
same daily production requirements. In order to determine whether one shift cost less than the second<br />
one to operate (using electrical power consumption as the differentiating factor), the engineer<br />
collected data on a number of key variables. Using ANOVA, interesting conclusions were drawn.<br />
28. An ABS manufacturing company was asked by one of its customers to reduce the base brake<br />
leakage in their ABS braking system solenoid values. To accompl<strong>is</strong>h th<strong>is</strong>, the engineer set up a DOE<br />
with many key factors and came up with very interesting findings.<br />
29. A high percentage of “pole height” rejects was a concern of an engineer working in a<br />
manufacturing plant of sensors. A team cons<strong>is</strong>ting of 9 members identified key factors using f<strong>is</strong>hbone<br />
diagram and conducted a series of experiments iteratively. The problem (at least at the time of<br />
submitting the report) was not solved. However, the conclusion of th<strong>is</strong> report underscores the<br />
importance of applied stat<strong>is</strong>tics and so <strong>is</strong> quoted directly from the student’s report as follows. “It was<br />
a very good thing for me to be working in th<strong>is</strong> project, because I was able to apply what I saw in the<br />
class and really understand the results and the steps we had to follow to determine the solution. It <strong>is</strong>
11<br />
very easy in the production real world that when you have a problem you start to shoot everything<br />
you think can be affecting, and sometimes you spend more time on th<strong>is</strong> because you do not have the<br />
right tools of you just do not understand them. The problem has not been solved yet, but the<br />
variability was brought down to two major reasons and thanks to all the stat<strong>is</strong>tical tools that each<br />
member of the team knew how to use.”<br />
30. The primary function and design of the core crimp <strong>is</strong> to optimize the electrical performance of he<br />
cable/terminal interface for the service life of the terminal. The core crimp design utilizes the set of<br />
relationships between the terminal, the cable, the core crimp subtools, and the crimp die to provide<br />
th<strong>is</strong> high quality connection needed for sufficient power and signal d<strong>is</strong>tribution in automotive<br />
applications. For signal d<strong>is</strong>tribution, or low energy systems operating under 5 volts, the core crimp<br />
connection must sustain optimal electrical performance in the face of extreme environmental<br />
conditions. Th<strong>is</strong> investigation uses regression analys<strong>is</strong> to establ<strong>is</strong>h a linear relationship between<br />
environmental conditions and core crimp geometry and their effects on core crimp res<strong>is</strong>tance.<br />
31. In th<strong>is</strong> project dealing with the study of an automobile glove box door alignment, the student uses<br />
a 2 4 design to identify the optimal settings that improves the door parallel<strong>is</strong>m to measure within a<br />
given tolerance limit.<br />
32. A multiple linear regression analys<strong>is</strong> was used to determine the effects of the duration of laser heat<br />
and the tension force on the taper length of an optical fiber
EXAMPLE 2 ( Application )<br />
12<br />
- Nashua Corporation (in NH) manufactures carbonless paper.<br />
- 1100 ft/min; used 3.6 lbs of chemicals/3000 sq.ft.<br />
- 3.6 lbs of chemicals were high. Idea to buy a costly coating head.<br />
- Operator was adjusting constantly.<br />
- Stat<strong>is</strong>tics was used to determine that adjustments were made based delayed data and so it didn’t<br />
pertain to current conditions.<br />
- New operating instructions led to fewer adjustments and reduced the average to 2.6lbs<br />
- Resulted in savings of $800,000/year in addition to not buying a new machine.<br />
BRAINSTORMING<br />
- Th<strong>is</strong> <strong>is</strong> a starting point for any analys<strong>is</strong>, more so in a stat<strong>is</strong>tical study.<br />
- Gather information about the problem by assembling a group of people involved.<br />
- Simple statement of the problem; get all ideas; group these into several classes.<br />
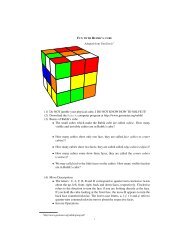
- Draw a cause-and-effect diagram. The following <strong>is</strong> an example.<br />
Cause-and-effect Diagram for Gas Mileage<br />
Measurements<br />
Materials<br />
Men<br />
Fuel tank<br />
Speedometer type<br />
Gage for pressure<br />
Gasoline type<br />
oil type<br />
fuel additiv e<br />
Driv er Training<br />
Driv er<br />
Number of passengers<br />
Weather conditions<br />
Terrain<br />
Highway or city<br />
Environment<br />
Methods<br />
Machines<br />
GAS MILEAGE<br />
Engine Warm-up time Tire type<br />
Tune-ups<br />
Transm<strong>is</strong>sion ty pe<br />
Tire pressure<br />
Tire rotation<br />
Air conditioner<br />
Ride breaks<br />
Front/Rear driv e<br />
Maintenance<br />
Weight<br />
Fast start<br />
carburator
13<br />
EXAMPLE 3 (Illustrative)<br />
- To illustrate and to motivate the need for probability and stat<strong>is</strong>tics, we will take a concrete<br />
example from practice. Automotive news <strong>is</strong> one of the magazines that publ<strong>is</strong>h all kinds of data<br />
about automobiles. Some of these include information about<br />
- MPG's of cars (different types) and trucks;<br />
- Dimensions of wheelbase, overall length, overall width, overall height, curb height, curb weight,<br />
front-seat head room, and rear tread.<br />
- Engine data such as type, number of valves, bore and stroke, d<strong>is</strong>placement, compression ratio<br />
and net HP.<br />
- Capacities such as fuel tank, cooling system, and crankcase.<br />
- M<strong>is</strong>cellaneous data about the transm<strong>is</strong>sion, axle ratio, drive system and number of passengers.<br />
- A sample data sheet <strong>is</strong> attached at the end.<br />
- Suppose that MPG of a particular mid-size car (say, Olds Ciera) <strong>is</strong> to be "estimated". Note the<br />
word estimated!<br />
- We cannot find the exact value of the MPG of th<strong>is</strong> type of car (WHY?). Obviously we cannot test<br />
all the cars rolling out of that particular model. We need to select a "representative" sample of<br />
cars from th<strong>is</strong> model and estimate the "true" average MPG. Note that true average will be known<br />
only when all the cars in that model are tested. As we all know, th<strong>is</strong> <strong>is</strong> not practical. So we can<br />
only estimate the true value. We can estimate without testing a single car (by simply using the<br />
past performance?) But th<strong>is</strong> will not take into account any improvement made on the model. So,<br />
what <strong>is</strong> the best way to do?<br />
Well, we take a sample of n cars. Test them and find the average MPG. Which n cars to be selected<br />
for testing? Is it important to know which cars are selected? How are the cars tested? Does the same<br />
driver drive these? Are all these cars driven under one type of road condition? These are some of the<br />
important questions and should be addressed properly if the estimate <strong>is</strong> to make any sense! These<br />
questions can only be properly addressed using probability and stat<strong>is</strong>tics. Stat<strong>is</strong>tics also provides a<br />
wide variety of techniques, which can be applied to build quality into data, performance and dec<strong>is</strong>ions.<br />
Stat<strong>is</strong>tics also helps us to detect, estimate, control, compare and measure effectiveness of key<br />
elements.<br />
Before we proceed further, let us see the definition of data.
WHAT IS DATA?<br />
14<br />
- Data <strong>is</strong> collection of information pertaining to a specific problem under study.<br />
- For example, referring to MPG example above, the data would be the miles per gallon of the cars<br />
that were tested.<br />
- Suppose we are interested in the braking d<strong>is</strong>tance (at 35mph) of that particular model car, then<br />
the data would compr<strong>is</strong>e the braking d<strong>is</strong>tances of the tested cars.<br />
- As another example if one w<strong>is</strong>hes to study the income level of people in a city (to see whether it<br />
<strong>is</strong> profitable to start a new business), the data for th<strong>is</strong> would be the income of all people living in<br />
the city.<br />
- A quality control engineer <strong>is</strong> interested to see whether the machines under h<strong>is</strong> superv<strong>is</strong>ion are<br />
producing items within the specifications. Naturally he has to collect data to verify th<strong>is</strong>.<br />
- A pharmaceutical company <strong>is</strong> planning to introduce a new drug into the market and <strong>is</strong> interested<br />
in seeing the reception for the drug. The company performs a pilot study through contacting a<br />
number of physicians and gathers information (data) to see the impact of the drug.<br />
- The data can be quantitative or qualitative.<br />
- Variables, such as the MPG of a new model car, number of defective in a lot sampled, the weight<br />
of a cereal box, etc, <strong>is</strong> quantitative.<br />
- Quantitative variable can be d<strong>is</strong>crete or continuous.<br />
- Variables, which cannot be quantified such as the color of the eyes, location, etc., are classified<br />
as qualitative variables.<br />
- A qualitative variable which can be ordered (according to some scale)<strong>is</strong> referred to as ordinal.<br />
- An unordered qualitative variable (such as the color of the hair) <strong>is</strong> referred to as nominal.<br />
- In dealing with data one has to be aware of major types of problems such as data errors, outliers<br />
and m<strong>is</strong>sing observations.<br />
- A data error <strong>is</strong> an observation that <strong>is</strong> incorrectly recorded.<br />
- Recording error, typing error, transcription (copying) error, repetition error and deliberate<br />
(falsification) error.<br />
- An outlier <strong>is</strong> an observation that falls away from the rest of the data.<br />
- M<strong>is</strong>sing observations ar<strong>is</strong>e for a number of reasons.<br />
- For example, in response to a questionnaire people may forget to answer some questions. In<br />
agricultural experiments the crops may suddenly die in some plots leading to no yield, which<br />
cannot be taken as 0 yield.<br />
- Some analys<strong>is</strong> becomes more involved due to m<strong>is</strong>sing observations. We shall see more of these<br />
in the d<strong>is</strong>cussion of Analys<strong>is</strong> of variance techniques.<br />
- There are two kinds of data: raw and grouped.
- Raw data: not compiled in any way.<br />
- Grouped data: classified into several groups or classes according to some criteria.<br />
15<br />
UNI- AND MULTI-VARIATE DATA<br />
If the study involved <strong>is</strong> only on one variable, such as the MPG of a new model car as a function of<br />
the size of the car then we are dealing with univariate data. However, if the study deals with more<br />
than one variable at a time, then we are dealing with multivariate data. For example, if we are<br />
interested in the study of MPG as a function of the engine size, HP, passenger capacity, fuel capacity,<br />
etc, then the study deals with multivariate data.<br />
MULTIVARIATE ANALYSIS<br />
Multivariate analys<strong>is</strong> deals with study involving simultaneous measurements on many variables.<br />
Multivariate stat<strong>is</strong>tical techniques differ from univariate in the sense that the attention <strong>is</strong> drawn away<br />
from the analys<strong>is</strong> of mean and variance of a single variable. Instead, the attention <strong>is</strong> focused on:<br />
(i) Data reduction;<br />
(ii) Sorting and grouping;<br />
(iii) Study of dependence among variables.<br />
There are several multivariate techniques available for investigating the above three areas. These<br />
include: (a) multiple regression; (b) d<strong>is</strong>criminant analys<strong>is</strong>; (c) multivariate ANOVA; (d) correlation<br />
analys<strong>is</strong>; (e) logit analys<strong>is</strong>; (e) principal component analys<strong>is</strong>; (f) factor analys<strong>is</strong>; (g) cluster analys<strong>is</strong>;<br />
(h) metric multidimensional scaling.<br />
In th<strong>is</strong> course, we will concentrate only on the principal component analys<strong>is</strong>. First, you need to review<br />
your matrix algebra, specifically the concepts of linear combination, eigenvalues, eigenvectors, and<br />
positive definite matrices.<br />
PRINCIPAL COMPONENT ANALYSIS<br />
The main idea of principal component analys<strong>is</strong> deals with explaining the variance-covariance<br />
structure of the variables under study through a small number of linear combinations of the original<br />
variables. These linear combinations are constructed in such a way that much of the total variation<br />
in the original variables <strong>is</strong> explained by these few linear combination ones. Thus, we are concerned<br />
with data reduction (in the form of identifying a small number of linear combinations of the original<br />
variables) and interpretation. It should be noted that principal components serve as intermediate steps<br />
in multiple regression (to be seen later), factor analys<strong>is</strong> and cluster analys<strong>is</strong>.
16<br />
HOW TO USE STATISTICS (efficiently)?<br />
• <strong>What</strong> <strong>is</strong> the main objective of the study?<br />
Then, we ask:<br />
(a) <strong>What</strong> information <strong>is</strong> available on th<strong>is</strong> problem?<br />
(b) Do we have data on th<strong>is</strong> problem? If so how the data was selected?<br />
(c) Has any study been done on th<strong>is</strong> problem before?<br />
INVESTIGATION STAGES<br />
Proper stat<strong>is</strong>tical study of a problem involves:<br />
Stage 1: Proper understanding of the problem and the goals of the study.<br />
Stage 2: Determine the type of data to be used for the study.<br />
Stage 3: We need to assess the structure and the quality of the data.<br />
Stage 4: Perform an initial examination of the data.<br />
Stage 5: Carry out a number of formal stat<strong>is</strong>tical procedures to analyze the data.<br />
Stage 6: Compare with any previous findings.<br />
Stage 7: Summarize the findings through report writings and presentation of important graphs to<br />
highlight the crucial findings.<br />
The process of analyzing the data involves the study of populations, samples, variation and other<br />
concepts.<br />
Population: <strong>is</strong> a collection of all units defined by some character<strong>is</strong>tic, which <strong>is</strong> the subject under<br />
study.<br />
- In the study of the MPG of a new model car, the population cons<strong>is</strong>ts of the MPG's of all cars of<br />
that model.<br />
- To study the income level of a particular city the population cons<strong>is</strong>ts of the incomes of all working<br />
people in that city.<br />
Sample: <strong>is</strong> a subset (part) of the population.<br />
Since it <strong>is</strong> infeasible (and impossible in many cases) to study the entire population, one has to rely on<br />
samples to make the study.<br />
- Samples have to be as representative as possible in order to make valid conclusions about the<br />
populations under study.<br />
- Contain more or less the same type of information that the population has.<br />
- For example if workers from three shifts are involved in assembling cars of a particular model,
17<br />
then the sample should contain units from all three. -Simple random sampling <strong>is</strong> the most<br />
commonly used one, although there are several types of sampling possible.<br />
- These include cluster sampling, stratified sampling, convenience sampling and judgement<br />
sampling.<br />
- Once the data has been gathered, what do we do next?<br />
EXPLORATORY DATA ANALYSIS<br />
Before any formal stat<strong>is</strong>tical inference through estimation or test of hypotheses <strong>is</strong> conducted,<br />
exploratory data analys<strong>is</strong> should be employed. Th<strong>is</strong> <strong>is</strong> a procedure by which the data <strong>is</strong> carefully<br />
looked for patterns, if any, and to <strong>is</strong>olate them. It often provides the first step in identifying<br />
appropriate model for further analys<strong>is</strong> including prediction. The main difference between exploratory<br />
data analys<strong>is</strong> and the conventional data analys<strong>is</strong> <strong>is</strong> while the former, which <strong>is</strong> more flexible (in terms<br />
of any assumptions on the nature of the populations from which the data are gathered) emphasizes<br />
on searching for evidence and clues for the patterns, the latter concentrates on evaluating the evidence<br />
and the hypotheses on the nature of the parameters of the population(s) under study.<br />
DESCRIPTIVE STATISTICS<br />
- Deals with characterization and summary of key observations from the data.<br />
- Quantitative measures: mean, median, mode, standard deviation, percentiles, etc.<br />
- Graphs: h<strong>is</strong>togram, Box plot, scatter plot, Pareto diagram, stem-and-leaf plot, etc.<br />
- Here one has to be careful in interpreting the numbers. Usually more than one descriptive measure<br />
will be used to assess the problem on hand.<br />
- Before we se various descriptive quantitative measures, let us first give a brief introduction to<br />
MINITAB and then d<strong>is</strong>cuss the graphical d<strong>is</strong>play of the data.<br />
DIFFERENT TYPES OF PLOTS<br />
1. Point plot: The horizontal ax<strong>is</strong> (x-ax<strong>is</strong>) covering the range of the data values and vertically plot<br />
the points, stacking any repeated values.<br />
2. Time series plot: x-ax<strong>is</strong> corresponds to the number of the observation or the time of the<br />
observation or the day and so on and the y-ax<strong>is</strong> will correspond to the value of the observation.
3. Scatter plot: Construct x-ax<strong>is</strong> and y-ax<strong>is</strong> that cover the ranges of two variables. Plot (x i , y i ) points<br />
for each observation in the data set.<br />
18<br />
4. H<strong>is</strong>togram: Th<strong>is</strong> <strong>is</strong> a bar graph, where the data <strong>is</strong> grouped into many classes. The x-ax<strong>is</strong><br />
corresponds to the classes and the y-ax<strong>is</strong> gives the frequency of the observations.<br />
5. Stem-and-leaf plot: Data <strong>is</strong> plotted in such a way the output will look like h<strong>is</strong>togram and also<br />
features a frequency d<strong>is</strong>tribution. The idea <strong>is</strong> to use the digits of the data to illustrate its range, shape<br />
and density. Each observation <strong>is</strong> split into leading digits and trailing digits. All the leading digits are<br />
sorted and l<strong>is</strong>ted to the left of a vertical line. The trailing digits are written to the right of the vertical<br />
line.<br />
6. Pareto Diagram: Named after the Italian econom<strong>is</strong>t. Th<strong>is</strong> <strong>is</strong> a bar diagram for qualitative factors.<br />
Th<strong>is</strong> <strong>is</strong> very useful to identify and separate the commonly occurring factors from the less important<br />
ones. V<strong>is</strong>ually it conveys the information very easily.<br />
7. Box plot: <strong>is</strong> due to J. Tukey and provides a great deal of information. A rectangle whose lower<br />
and upper limits are the first and third quartiles, respectively, <strong>is</strong> drawn. The median <strong>is</strong> given by a<br />
horizontal line segment inside the rectangle box. The average value <strong>is</strong> marked by a symbol such as<br />
“x” or “+”. All points that are more extreme are identified.<br />
8. Quantile plot: Th<strong>is</strong> plot <strong>is</strong> very useful when we want to identify/ verify an hypothesized population<br />
d<strong>is</strong>tribution from which the data set could have been chosen. A quantile, Q(r), <strong>is</strong> a number that<br />
divides a sample (or population) into two groups so that the specified fraction r of the data values <strong>is</strong><br />
less than or equal to the value of the quantile.<br />
9. Probability plot: Th<strong>is</strong> involves plotting the cumulative probability and the observed value of the<br />
variable against a suitable probability scale which will result in linearization of the data. The basic<br />
steps involved here are: (a) Sorting the data into ascending order; (b) Computing the plotting points;<br />
(c) Selecting appropriate probability paper; (d) Plot the points; (e) Fitting a “best” line to data.<br />
In the following we will use 93CAR data to illustrate the use of MINITAB.
MINITAB<br />
19<br />
- First make sure that you have installed the software correctly [ Refer to the user’s guide for full<br />
details].<br />
- READ Session one (pp3.1-3.21) in the User’s guide and Chapter 1 (pp1.1-1.28) in the Reference<br />
Manual.<br />
- A brief introduction of how to get into MINITAB and manipulate the data will be given in the<br />
class.<br />
- Remember that unless and until you try on your own, it <strong>is</strong> difficult to follow the class<br />
demonstration.<br />
STEM & LEAF DISPLAY<br />
Here the data <strong>is</strong> plotted in such a way the output will look like h<strong>is</strong>togram and also features<br />
a frequency d<strong>is</strong>tribution. The basic idea <strong>is</strong> to use the digits of the data to illustrate its range, shape and<br />
density. Each observation <strong>is</strong> split into leading digits and trailing digits. All the leading digits are sorted<br />
and l<strong>is</strong>ted to the left of a vertical line. The trailing digits are written to the right of the vertical line in<br />
the appropriate places. The main steps are: (a) Choose a suitable unit to divide the data into leading<br />
and trailing digits; (b) L<strong>is</strong>t the sets of all possible leading digits in a column in ascending order; (c)<br />
For each observation l<strong>is</strong>t the trailing digits on the same line.<br />
Stem-and-leaf of MPG_C N = 93<br />
Leaf Unit = 1.0<br />
2 1 55<br />
13 1 66677777777<br />
35 1 8888888888889999999999<br />
(14) 2 00000000111111<br />
44 2 222222233333333<br />
29 2 44444555555<br />
18 2 66<br />
16 2 88999999<br />
8 3 011<br />
5 3 23<br />
3 3<br />
3 3<br />
3 3 9<br />
2 4<br />
2 4 2<br />
1 4<br />
1 4 6
20<br />
DOT PLOT<br />
Here construct the horizontal ax<strong>is</strong> (x-ax<strong>is</strong>) covering the range of the data values and vertically<br />
plot the points, stacking any repeated values.<br />
Size .<br />
Compact : : : .<br />
.: : :: : :.<br />
-------+---------+---------+-------MPG_C<br />
18.0 24.0 30.0<br />
HISTOGRAM<br />
Th<strong>is</strong> <strong>is</strong> a bar graph, where the data <strong>is</strong><br />
H<strong>is</strong>togram of City MPG<br />
grouped into many classes. The x-ax<strong>is</strong><br />
corresponds to the classes and the y-<br />
20<br />
ax<strong>is</strong> gives the frequency of the<br />
observations. Note that th<strong>is</strong> <strong>is</strong> bar<br />
graph for numerical categories. The<br />
10<br />
shape of the diagram provides an idea<br />
of the true population d<strong>is</strong>tribution.<br />
0<br />
The construction of h<strong>is</strong>togram<br />
10<br />
20<br />
30<br />
40<br />
50<br />
depends on the number of classes.<br />
mpg_c<br />
Usually one looks at the range of the<br />
data and then with the number of classes known, determines the width of the interval. Once, the<br />
frequency for each class <strong>is</strong> determined, plotting <strong>is</strong> done very easily.<br />
Frequency<br />
SCATTER PLOT<br />
Construct x-ax<strong>is</strong> and y-ax<strong>is</strong> that<br />
cover the ranges of two variables.<br />
Plot (x i , y i ) points for each<br />
observation in the data set.<br />
mpg_c<br />
45<br />
35<br />
25<br />
Plot of City MPG vs HP<br />
15<br />
100<br />
hp<br />
200<br />
300
21<br />
BOX PLOT<br />
Th<strong>is</strong> <strong>is</strong> due to J. Tukey and provides<br />
Box Plot of City MPG vs Size<br />
a great deal of information about the<br />
45<br />
data. Th<strong>is</strong> plot describes the data by<br />
a rectangle whose lower and upper<br />
35<br />
limits are the first and third quartiles,<br />
respectively. The median (50th<br />
25<br />
percentile or second quartile) <strong>is</strong><br />
designated by a horizontal line<br />
15<br />
Small Midsize Compact Large Sports Van<br />
segment inside the rectangle box.<br />
size<br />
The average value <strong>is</strong> marked by a<br />
symbol such as "x" or "+". The width of the box <strong>is</strong> usually arbitrary. The main steps for a box plot<br />
are: (a) Calculate the mean and the quartiles of the data; (b) Calculate the inter-quartile range(IQR);<br />
(c) Draw a box with a convenient width such that the upper edge <strong>is</strong> at the third quartile, lower edge<br />
<strong>is</strong> the first quartile, a horizontal line within the box identifying the median, and put an "x" to identify<br />
the mean; (d) Draw vertical lines from the center of the upper and lower edges of the box to the most<br />
extreme data values (that are no farther than 3 IQR); (e) Plot all points that are more extreme than<br />
the vertical lines.<br />
mpg_c<br />
PARETO CHART<br />
Pareto Chart for : Failures<br />
Solder Defects (Messina:SQC for MM, 1987)<br />
Percent<br />
100<br />
80<br />
60<br />
40<br />
20<br />
800<br />
700<br />
600<br />
500<br />
400<br />
300<br />
200<br />
100<br />
Number of Occurrences<br />
0<br />
Defect<br />
Insufficient so<br />
Blow holes<br />
Unwetted<br />
Unsoldered<br />
Pinholes<br />
Shorts<br />
0<br />
Count<br />
Percent<br />
Cum %<br />
440<br />
55.0<br />
55.0<br />
120<br />
15.0<br />
70.0<br />
80<br />
10.0<br />
80.0<br />
64<br />
8.0<br />
88.0<br />
56<br />
7.0<br />
95.0<br />
40<br />
5.0<br />
100.0
22<br />
MEASURES OF LOCATION<br />
Suppose that X i , 1 # i # n, denotes the i-th observation of the sample taken from the<br />
population under study.<br />
Mean: <strong>is</strong> used very often in analyzing the data. Although th<strong>is</strong> <strong>is</strong> a common measure, if the data vary<br />
greatly the average may take a non-typical value and could be m<strong>is</strong>leading.<br />
Median: <strong>is</strong> the halfway point of the data and tells us something about the location of the d<strong>is</strong>tribution<br />
of the data.<br />
Mode: if ex<strong>is</strong>ts, gives the data point that occur most frequently. It <strong>is</strong> possible for a set of data to have<br />
0, 1 or more modes.<br />
- Mean and median always ex<strong>is</strong>t.<br />
- Mode need not ex<strong>is</strong>t.<br />
- Median and mode are less sensitive to extreme observations.<br />
- Mean <strong>is</strong> most widely used.<br />
- There are some data set for which median or mode may be more appropriate than mean.<br />
Percentiles: The 100p-th percentile of a set of data <strong>is</strong> the value below which a proportion p of the<br />
data points will lie.<br />
- Percentiles convey more information and are very useful in setting up warranty or guarantee<br />
periods for manufactured items.<br />
- Also referred to as quantiles.<br />
The shape of the frequency data can be classified into several classes.<br />
- Symmetric: mean = median = mode<br />
- Positively skewed: tail to the right; mean > median<br />
- Negatively skewed:tail to the right; median > mean<br />
- In problems, such as waiting time problems one <strong>is</strong> interested in the tails of the d<strong>is</strong>tributions.<br />
- For skewed data median <strong>is</strong> preferred to the mean.<br />
MEASURES OF SPREAD<br />
As pointed out before, one should not solely rely on mean or median or mode. Also two or<br />
more sets of data may have the same mean but they may be qualitatively different. In order to make<br />
a meaningful study, we need to rely on other measures. For example, we may be interested to see how<br />
the data <strong>is</strong> spread.
Range: <strong>is</strong> the difference between the largest and the smallest observations.<br />
- Quick estimate on the standard deviation.<br />
- Plays an important role in SPC.<br />
23<br />
Standard deviation: describes how the data <strong>is</strong> spread around its mean.<br />
Coefficient of variation: The measures we have seen so far depend on the unit of measurements. It<br />
<strong>is</strong> sometimes necessary and convenient to have a measure that <strong>is</strong> independent of the unit and such a<br />
useful and common measure <strong>is</strong> given by the ratio of the standard deviation to the mean called the<br />
coefficient of variation.<br />
Interquartile range: <strong>is</strong> the difference between the 75th and 25th percentiles.<br />
- Gives the interval which contains the central 50 % of the observations.<br />
- Avoids the total dependence on extreme data<br />
HOW TO TAKE SAMPLES?<br />
So far we d<strong>is</strong>cussed the computation of some basic numerical measures given a set of data.<br />
Most of the times we are interested in making inferences about the population(s) under study.<br />
- The inference <strong>is</strong> very much dependent on the sample(s) drawn from the population(s).<br />
- Much care should be devoted to the sampling.<br />
- There <strong>is</strong> always going to be some error involved in making inferences about the populations based<br />
on the samples.<br />
- The goal <strong>is</strong> to minimize th<strong>is</strong> error as much as possible.<br />
- There are many ways of bringing in systematic bias (cons<strong>is</strong>tently m<strong>is</strong>represent the population).<br />
- Th<strong>is</strong> can be avoided by taking random samples.<br />
Simple random sample: all units are equally likely to be selected.<br />
Multi-stage sample: units are selected in several stages.<br />
Cluster sample: <strong>is</strong> used when there <strong>is</strong> no l<strong>is</strong>t of all the elements in the population and the elements<br />
are clustered in larger units.
Stratified sample: In cases where population under study may be viewed as compr<strong>is</strong>ing different<br />
groups (stratas) and where elements in each group are more or less homogeneous, we randomly<br />
select elements from every one of the strata.<br />
24<br />
Convenience sample: samples are taken based on convenience of the experimenter.<br />
Systematic sample: units are taken in a systematic way such as selecting every 10 th item after<br />
selecting the first item at random.<br />
HOW TO USE SAMPLES?<br />
- Samples should represent the population.<br />
- Random sample obtained will not always be an exact copy of the population.<br />
- Thus, there <strong>is</strong> bound to be some error:<br />
1. Random or unbiased error: Th<strong>is</strong> <strong>is</strong> due to the random selection of the sample and the mean<br />
of such error will be 0 as positive deviation and negative deviation cancel out. Th<strong>is</strong> random error<br />
<strong>is</strong> also referred to as random deviation and <strong>is</strong> measured by the standard deviation of the estimator.<br />
2. Non-random or biased error: th<strong>is</strong> occurs due to several sources such as human, machines,<br />
m<strong>is</strong>takes due to copying or punching, recording and so on. Through careful planning we should<br />
try to avoid or minimize th<strong>is</strong> error.<br />
EXPERIMENTS USING MINITAB<br />
We will illustrate the concepts of sample, sampling error, etc with practical data using MINITAB.<br />
See class lecture for details.