- Page 1 and 2: $12.00 RADIO AMATEUR SATELLITE COR
- Page 3 and 4: Copyright @ 1991 by The American Ra
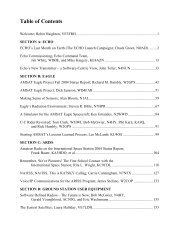
- Page 5 and 6: Table of Contents AMSAT-NA Ninth Sp
- Page 7 and 8: MOTION AND COLOR VIDEO VIA THE PHAS
- Page 9 and 10: etc. with digital video broadcasts,
- Page 11 and 12: would allow far more users to be ac
- Page 13 and 14: THB PROJECT A minimal mission will
- Page 15 and 16: As to transponder frequency, either
- Page 17: A SIMULATOR FOR PACSAT~l DOWNLINK T
- Page 21 and 22: In addition to supplying the simula
- Page 23 and 24: Table 5 Results of Initial Simulat
- Page 25 and 26: about evenly divided. The only valu
- Page 27 and 28: lations assume the same user traffi
- Page 29 and 30: AN AMATEUR SPACE EXPLORATION GROUN
- Page 31 and 32: themselves seem to be in good condi
- Page 33 and 34: mechanism as well as aiming the dis
- Page 35 and 36: WHAT'S UP WITH WEBERSAT by Stephen
- Page 37 and 38: As shown in FIGURE 2, the satellite
- Page 39 and 40: L-Band Video Uplink Webersat's 1.26
- Page 41 and 42: cost, Charged coupled Device (CCO)
- Page 43 and 44: Level Cantral Meter Mode (Peak I Av
- Page 45 and 46: of valid photo attempts have occurr
- Page 47 and 48: BIBLIOGRAPHY "CCD Cameras: Digital
- Page 49 and 50: FIGURE 3 THE SUN PICTURE TAKEN JU
- Page 51 and 52: Studies by DJ4ZC showed that the so
- Page 53 and 54: Fig 1--Phase IV, the AMSAT-NA geost
- Page 55: Fig 5--Seven sided Marburg configur
- Page 59 and 60: Gateways to the 21 st Century Joe
- Page 61 and 62: Gateways to the 21st Century Figure
- Page 63 and 64: Gateways to the 21st Century Table
- Page 65 and 66: Gateways to the 21st Century Figure
- Page 67 and 68: Gateways to the 21st Century Figure
- Page 69 and 70:
Gateways to the 21st Century Figure
- Page 71 and 72:
· Gateways to the 21st Century Int
- Page 73 and 74:
Gateways to the 21st Century S11m m
- Page 75 and 76:
Telemetry: Past, Present and Futur
- Page 77 and 78:
Telemetry :- Past Present and Futur
- Page 79 and 80:
Telemetry :- Past Present and Futur
- Page 81 and 82:
Telemetry :- Past Present and Futur
- Page 83 and 84:
Telemetry :- Past Present and Futur
- Page 85 and 86:
Te1emeuy :- Past Present and Future
- Page 87 and 88:
Telemetry :- Past Present and Futur
- Page 89 and 90:
Telemetry :- Past Present and Futur
- Page 91 and 92:
Telemetry :- Past Present and Futur
- Page 93 and 94:
Telemetry :- Past Present and Futur
- Page 95 and 96:
Telemetry :- Past Present and Futur
- Page 97 and 98:
Telemetry:- Past Present and Future
- Page 99 and 100:
Telemetry :- Past Present and Futur
- Page 101 and 102:
Telemetry :- Past Present and Futur
- Page 103 and 104:
Telemetry :- Past Present and Futur
- Page 105 and 106:
ORBIT SELECTION CONSIDERATIONS FOR
- Page 107 and 108:
elements that will be slowly pertur
- Page 109 and 110:
""'/ = 7/ '71,.. '3 W= 27iJ~ FIGURE
- Page 111 and 112:
Higher M/N values correspond to low
- Page 113 and 114:
TABLE 2 ORBITAL ELEMENTS MIN =3/2
- Page 115 and 116:
,~, ECHO 319 ms ,,~, FRQ 2400.0000
- Page 117 and 118:
FIGURE 15 FIGURE 16 ....> "430 FIGU
- Page 119 and 120:
several days until the apogee drift
- Page 121 and 122:
The argument of perigee has an effe
- Page 123 and 124:
P3DorbiIs AO-13 long-tenn predictio
- Page 125 and 126:
PRELIMINARY DECISION OF THE PHASE..
- Page 127 and 128:
eceive filtering is not necessary.
- Page 129 and 130:
While modern technology has brought
- Page 131 and 132:
VITA Operations Using UOSAT-3 by Er
- Page 133 and 134:
Performance of ground stations in t
- Page 135 and 136:
The equipment was then inventoried
- Page 137 and 138:
But we cannot do it alone. VITA is
- Page 139 and 140:
80386SX -type computer Table II. E
- Page 141 and 142:
November (cont..) 6. Ghana 7. Niger
- Page 143 and 144:
A RADIO ASTRONOMY EXPERIMENT FOR PH
- Page 145 and 146:
antenna at all, or with the aerospa
- Page 147 and 148:
where m represents the mass of the
- Page 149 and 150:
than the transmitted signal. The se
- Page 151 and 152:
are of course the familiar Doppler
- Page 153 and 154:
ESTIMATING ORBITAL PERIOD The Doppl
- Page 155 and 156:
CONCLUSIONS Since their inception i
- Page 157 and 158:
SOLAR SAIL EXPEDITION TO THE MOON A
- Page 159 and 160:
LAUNCH CONFIGURATION The launch -co
- Page 161 and 162:
Propulsion Module Spacecraft Bus P
- Page 163 and 164:
packet techniques to guarantee virt
- Page 165 and 166:
ADSAT THE ASTRONAUT DEPLOYABLE SAT
- Page 167 and 168:
in January of 1990. The satellite c
- Page 169 and 170:
For satellite reception to be made
- Page 171 and 172:
A final significant experiment to b
- Page 173 and 174:
FUTURE PROGRAMS Building a satellit
- Page 175 and 176:
SUNSAT - A JOINT UNIVERSITY OF STEL
- Page 177 and 178:
The power system is conventional. T
- Page 179 and 180:
IMAGE-ENABLING YOUR SATELLITE STATI
- Page 181 and 182:
chip to provide an 8 bit. (256 leve
- Page 183 and 184:
can be done a m:inimal expense thro
- Page 185 and 186:
available once again from D RIG B B
- Page 187 and 188:
Fig. 2. HRPT image of Florida taken
- Page 189 and 190:
.... co w Fig. 6. Soviet 0 kean 2 A
- Page 191 and 192:
Jileng Tun I-B. 28 January 1991, 08
- Page 193 and 194:
SEDSAT 1 Overview SEDSAT 1 is a mic
- Page 195 and 196:
tested on the mode A transponder is
- Page 197 and 198:
Foreword We're pleased to publish,
- Page 199 and 200:
spacecraft and receiving telemetry.
- Page 201 and 202:
SAREX.-A POST FLIGHT REPORT FROM TW
- Page 203 and 204:
oth the students and the public ali
- Page 205 and 206:
I posted a notice on packet about o
- Page 207 and 208:
o o the dropouts could hopefully be
- Page 209 and 210:
Amsat - NA Technical Symposium and
- Page 211 and 212:
We can compare an amateur radio sat
- Page 213 and 214:
Let me wish you all a very fruitful
- Page 215 and 216:
descending whistler tones appeared
- Page 217 and 218:
that uses the electrical energy to
- Page 219 and 220:
USING THE RECEIVER Even though hig
- Page 221 and 222:
Bringing Space into the Classroom
- Page 223 and 224:
Bringing Space into the Classroom
- Page 225 and 226:
Bringing Space into the Classroom d
- Page 227 and 228:
Bringing Space into the Classroom R
- Page 229 and 230:
Bringing Space into the Classroom
- Page 231 and 232:
Bringing Space into the Classroom (
- Page 233 and 234:
Bringing Space into the Classroom F
- Page 235 and 236:
Bringing Space into the Classroom o
- Page 237 and 238:
Bringing Space into the Classroom a
- Page 239 and 240:
· ., '''/ .~. Chaminade MicroSat P
- Page 241 and 242:
4. Watch the time on Traksat and mo
- Page 243 and 244:
~ o..:c III til ..... ::> 'tI > ..
- Page 245 and 246:
SOLAR ECLIPSE OF JULY 11,1991 LUSA
- Page 247 and 248:
To start the program type: C:\TRAKS
- Page 249 and 250:
Using Amateur satellite and Weather
- Page 251 and 252:
packet radio, the educational commu
- Page 253 and 254:
the schools. 5. Have this organizat
- Page 255 and 256:
ought new experiences into the clas
- Page 257 and 258:
The University of Stellenbosch and
- Page 259 and 260:
Space Education and the SEDSAT 1 Pr
- Page 261 and 262:
SEDSAT 1, Amateur Radio, and a Spac
- Page 263:
Conclusions Some of the goals of th